Y. Abe et al.Three Spectral State of 4U 1630-47 \Received2004 November 17\Accepted2005 May 10\Published
accretion, accretion disks — black hole physics — stars: individual (4U 1630-47) — X-rays: stars
Three Spectral States of the Disk X-Ray Emission of the Black-Hole Candidate 4U 1630-47
Abstract
We studied a time history of X-ray spectral states of a black-hole candidate, 4U 1630-47, utilizing data from a number of monitoring observations with the Rossi X-Ray Timing Explorer over 1996–2004. These observations covered five outbursts of 4U 1630-47, and most of the data recorded typical features of the high/soft states. We found that the spectra in the high/soft states can be further classified into three states. The first spectral state is explained by a concept of the standard accretion disk picture. The second state appears in the so-called very high state, where a dominant hard component is seen and the disk radius apparently becomes too small. These phenomena are explained by the effect of inverse Compton scattering of disk photons, as shown by Kubota, Makishima, & Ebisawa (2001, ApJ, 560, L147) for GRO J1655-40. The third state is characterized in such a way that the disk luminosity varies in proportion to , rather than , where is the inner-disk temperature. This state is suggested to be an optically-thick and advection-dominated slim disk, as suggested by Kubota & Makishima (2004, ApJ, 601, 428) for XTE J1550-564. The second and third states appear, with good reproducibility, when and the total X-ray luminosity are higher than 1.2 keV and erg s-1, respectively, where is the distance to the object and is the inclination angle to the disk. The present results suggest that these three spectral states commonly appear among black-hole binaries under high accretion rates.
1 Introduction
The physics of accreting black holes is naturally the same among stellar-mass black holes, ultraluminous X-ray sources (ULXs), and active galactic nuclei (AGN), and information concerning accretion disks enables us to understand the spacetime geometry around the central black holes. Among many classes of black holes, galactic black hole binaries (hereafter BHBs) are the best for detailed spectral and timing studies, and often the observational results of BHBs are considered as a basis to understand other classes of black holes. Therefore, it is essentially important to precisely understand the accretion-disk structure of BHBs from observed spectra.
In classical understanding, the X-ray spectrum of BHBs exhibits two distinct features of high/soft and low/hard states (e.g. [Tanaka, Lewin (1995)]). In the high/soft state, the spectrum consists of a dominant soft component accompanied by a powerlaw component with a photon index of –2.5 (e.g., [Tanaka, Lewin (1995)]). The dominant soft component is believed to be a thermal emission from a geometrically thin and optically thick standard accretion disk ([Shakura, Sunyaev (1973)]) extending down to the last Keplerian orbit around the central black hole. This is the standard view of the high/soft state BHBs. In fact, this soft component is well reproduced by a multicolor disk model (MCD model or diskbb in the xspec package; [Mitsuda et al. (1984)]) that approximates the integrated emission from the standard disk. The MCD model has two parameters: an inner disk temperature and a normalization with an apparent disk inner radius , a disk inclination angle , and a source distance . Correcting with the inner boundary condition ([Kubota et al. (1998)]) and color-to-effective temperature, we can estimate the true inner radius, . Past observations of many BHBs revealed that is kept remarkably constant even though the X-ray luminosity varies considerably ([Makishima et al. (1986), Takizawa (1991), Ebisawa et al. (1993)], 1994). Moreover, through studies of many BHBs, including Cyg X-1 ([Dotani et al. (1997)]), the inner radius is found to be consistent with the last stable orbit, , where is the Schwarzschild radius, is the gravitational constant, is the light velocity, and is the mass of the non-spinning black hole. Therefore, it is strongly supported that the standard view is realized in the high/soft state BHBs.
However, this simple, but physically well-understood, picture was found to be sometimes broken when the disk luminosity reaches a certain critical luminosity. The biggest problem is that the estimated values of do not remain constant when the powerlaw contribution becomes significant for the total luminosity. Based on the Rossi X-Ray Timing Explorer (RXTE) observations of the galactic BHBs GRO J and XTE J, Kubota, Makishima, Ebisawa (2001), Kubota, Makishima (2004b) found that this anomaly is observed when the disk luminosity exceeds a certain critical value (or a critical temperature around 1.0–1.2 keV), while the standard view is realized below such a luminosity. They called this branch an anomalous regime to distinguish from the standard high/soft state (standard regime). Together with the anomalies in , the anomalous regime can be characterized by a large intensity variation associated with quasi-periodic oscillations (QPOs) and the strong hard emission described by steeper powerlaw of –3. The characteristics of the anomalous regime are naturally the same as those of the very high state in the literatures (e.g., Miyamoto et al. (1993); McClintock, Remillard (2003); van der Klis (2004)). Kubota, Makishima, Ebisawa (2001), Kubota, Makishima (2004b) found that the strong hard emission is caused by inverse Compton scattering due to high-energy electrons that may reside around the disk, and for the first time found quantitatively that the returns to the same value as seen in the standard regime, if the Compton effect is taken into account. This scenario is consistent with those of QPOs, which are usually thought to be related to the corona surrounding the disk.
Kubota, Makishima, Ebisawa (2001), Kubota, Makishima (2004b) also found that another unusual state appeared in the brightest period of XTE J1550-564 and the beginning of the outburst of GRO J. The X-ray spectrum is apparently expressed by the dominant soft component and very weak powerlaw tail like in the case of the standard high/soft state. However, is not proportional to , but to (or ) under the MCD plus powerlaw model, and the spectral shape of the soft component is somewhat distorted from that of the standard disk. This regime is called an apparently standard regime by Kubota, Makishima (2004b). They suggested that the apparently standard regime shows a sign of a slim disk, in which optically thick advective cooling becomes significant (Abramowicz et al. (1988)).
These observed three spectral regimes seem to be consistent with the theoretically predicted -shape sequence for the optically thick accretion-disk solutions. This correspondence is simple, and it is sometimes referred to understand the spectral behavior of ULXs (e.g., Kubota, Done, Makishima (2002); Mizuno et al. 2001). However, such three regimes have ever been confirmed for only two Galactic black holes, GRO J1655-40 and XTE J1550-564, and it is not yet clear whether these regimes are general. Moreover, we have not known whether the critical luminosity is always the same in recurrent BHBs that repeat outbursts. In this paper, we hence present spectral analyses of a recurrent black hole binary, 4U 1630-47.
This object is one of the famous historical BHBs (e.g., Tanaka, Lewin (1995)), and is known to repeat X-ray outbursts with a period of about 600–650 days (Jones et al. (1976); Parmar et al. 1995). No optical counterpart is known for 4U 1630-47, probably due to its high reddening and crowded field (Parmar et al. 1986). A number of authors have shown the observational results of this source based on X-ray observations with Ginga (Parmar et al. (1997)), EXOSAT (Parmar et al. 1986; Kuulkers et al. 1997), BATSE/CGRO (Bloser et al. (1996)), Beppo-SAX (Oosterbroek et al. (1998)), and so on. We here analyzed 322 RXTE data of this source during 1996–2004 observations, consisting of 5 outbursts. RXTE data of the 1996 and 1998 outbursts have already been analyzed by other authors, including Tomsick, Lapshov, Kaaret (1998), Kuulkers et al. (1998), Cui, Chen, Zhang (2000), Hjellming et al. (1999), Dieters et al. (2000), Trudolyubov, Borozdin, Priedhorsky (2001), and Kalemci et al. (2004). The anomaly of (e.g., Oosterbroek et al. (1998)), together with existence of QPOs (e.g., Tomsick, Kaaret (2000)) during the 1998 outburst has been reported.
The aim of the present work was (1) to test whether the anomalous regime and apparently standard regime are found in the complete RXTE data set of this source, (2) to determine the critical luminosity and to test whether the critical luminosity is the same among all outbursts of this single source, (3) to confirm the scenario of the inverse Compton scattering in the anomalous regime (i.e., to test whether the scenario can solve the problem of variable ), and (4) to test the slim disk scenario if the apparently standard regime appears, and then we can discuss the generality of the scenario suggested by Kubota, Makishima, Ebisawa (2001) and Kubota, Makishima (2004b). This is very important to understand the spectral evolution of accreting black holes. The black hole mass, distance , and inclination of 4U 1630-47 are not determined; in this paper we assume kpc and = , following the previous works, and do not treat the data in the low state.
Before presenting the analyses, we briefly compare the spectral regimes applied in this paper to a more seminal definition of the spectral and timing behavior used in other literature in section 2. In section 3, we show the observation and data-reduction criteria, and in subsection 4.1, we characterize the observed spectral states based on the canonical MCD plus powerlaw model. In subsection 4.2 and subsection 4.3, we consider the effects of the inverse Compton effect and the slim disk, respectively. In section 5, we give a discussion on the results from the view point of the disk structure.
2 Brief Notes On Seminal Definition of Spectral/Timing States
The spectral/timing states of BHBs are sometimes complicated. Therefore, we here briefly show the correspondence of the spectral states that we used in the present work to the states defined in other literature. A summary is given in table 1. Beyond the two classical low and high states, several subdivisions are defined in the literature: the very high state and/or the intermediate state, the disk dominant high/soft state, the low/hard, and the off/quiescent state (e.g., McClintock, Remillard (2003)).
The off/quiescent state is in an extraordinarily faint period () and generally understood by a picture of advection-dominated accretion flow (ADAF: Narayan, Yi (1994), 1995; Narayan et al. 1996). The low/hard state is characterized by a single powerlaw spectrum of with an exponential cutoff around several tens of keV; the accretion is thought to still be dominated by advection. Large intensity variation of a strong flat-top noise accompanied by type-C (or C’) QPOs with a variable centroid frequency (Remillard et al. (2002)) is usually observed in this state (McClintock, Remillard (2003)).
The disk-dominant high/soft state is just the same as the standard regime, where the standard disk is realized. The intensity variation is very weak and QPOs are seldom observed, except on rare occasion of type-A QPOs associated with a weak red noise (e.g., Remillard et al. (2002); Nespoli et al. (2003); Casella et al. (2004); Homan et al. (2001)). Based on the spectral shape and the luminosity, the apparently standard regime is also classified into the disk-dominant high/soft state, even though we are suggesting that the standard disk is not justified in this regime.
| this paper | classification | MR03∗ | QPO type † | Remarks ‡ |
|---|---|---|---|---|
| (off/quiescent) | off/quiescent | hard | unknown | thermal IC |
| (low/hard) | low/hard | hard | C or C’ | thermal IC |
| (very high state with strong hard emission) | very high (intermediate) | SPL | C or C’ | thermal IC |
| anomalous | very high (intermediate) | SPL | B | thermal IC |
| standard | high/soft | TD | A or none | disk dominant + PL |
| apparently standard | high/soft | TD | none | disk dominant + weak PL |
| ∗ State definition by McClintock and Remillard (2003). SPL and TD represents a steep powerlaw state and a thermal dominant state, respectively. | ||||
| † QPO type is referred to Remillard et al. (2002). Note that majority of QPOs are found as type B. | ||||
| ‡ Characteristics of X-ray spectrum. IC and PL represent an inverse Compton scattering model and a powerlaw model, respectively | ||||
Definitions of the very high state and/or the intermediate state are somehow controversial. In the original paper by Miyamoto et al. (1993), the very high state was first defined as a high luminosity state with a large intensity variation, in contradiction to the standard high/soft state. After their pioneering work, spectral studies revealed that the very high state is associated with a very strong hard component with a steeper photon index of –3.0 than the hard tail in the standard high/soft state (McClintock, Remillard (2003) and references therein). Based on this strong and steep hard component, McClintock, Remillard (2003) called the very high state the steep powerlaw state. Detailed timing studies found that, in the very high state, QPOs were generally observed like in the case of the low/hard state (van der Klis (1994), 2004 and references therein). In the case of XTE J1550-564, type-B QPOs are observed when the hard emission is less dominant (but still much stronger than the standard high/soft state), while type-C (or C’) QPOs are observed when the hard component is the most significant in the total emission (e.g., Remillard et al. (2002); Kubota, Makishima (2004b)). Some authors suggest that the very high state is itself the intermediate state of transition between the low/hard state and the disk-dominant high/soft state (e.g., Rutledge et al. (1999); Homan et al. (2001); van der Klis (1994)), while other authors suggest that the very high state is a bona fide state of BHBs, and note that nothing in their definitions constrains the order in which state transitions should occur (e.g., McClintock, Remillard (2003)). Recently, Belloni et al. (2005) classified the very high state and/or intermediate state into two regimes along the flare evolution. As previously described, the anomalous regime is basically the same as the very high state, but strictly speaking, corresponds to the very high state with type-B QPOs and weaker hard emission (Kubota, Done (2004a)) or the soft intermediate state (Belloni et al. (2005)). The very high state with much stronger hard emission accompanied by type-C QPOs was found just after the low/hard state, would correspond to the hard intermediate state (Belloni et al. (2005)), and the optically thick disk is somehow truncated at (Kubota, Done (2004a)). Thus, this type of the very high state may be associated with the state transition.
Thus, the states of bright BHBs are still being discussed from the view point of both spectral and timing phenomena. On the other hand, three regimes treated in the present work are based on the spectral features of the disk emission, including the standard disk model, the inverse Compton scattering, and the slim disk model. In this paper, to understand the disk structure in the high state, we focus on whether the standard disk picture is valid or broken against the luminosity and disk temperature, by considering the effects of the inverse Compton scattering and the slim disk, rather than reclassifying the high states. Such an approach is important to describe many complex features found in the bright period of BHBs, not phenomelogically, but physically.
3 Observation and Data Reduction
The black-hole candidate 4U 1630-47 has been continuously monitored by the RXTE/ASM (Bradt et al. 1993; Levine et al. (1996)). Figure 1 shows time histories of a 1.5–12 keV count rate and a hardness ratio of this source in 1996–2004, obtained with the RXTE/ASM. The source showed five outbursts since 1996. We analyzed 322 pointing observations with the RXTE/PCA of the five outbursts, which are indicated with arrows at the top in figure 1. In addition to the PCA data, the HEXTE data were analyzed only when their data quality was good. We analyzed the PCA standard-2 data and the HEXTE standard mode data for spectral fittings, and performed data selection on the condition of a minimum elevation angle of 10∘ above the Earth’s limb. Since the spacecraft attitude is not stable just after changing the pointing direction, we excluded the data obtained when the actual pointing direction is more than 002 away from the aimed direction. The selected data of the individual proportional counter units were co-added for spectral analyses. Systematic errors of 0.3 were added to the PCA spectra; furthermore, we added 2% and 10% systematic errors to the 4–8 keV and 25–30 keV band, respectively, referring to the PCA calibration results in Jahoda et al. (2005). The latter is due to the uncertainty associated with the instrumental Xenon edge. The response matrices are generated by the ftool pcarsp, considering the change of calibration parameters, including the gain of PCA.
We also utilized the ASCA/GIS data (Ohashi et al. (1996); Makishima et al. (1996)) for constraining the spectra at lower energies. The ASCA observation of this source was performed on 1998 February 26 (MJD = 50870), and this was almost simultaneous with the RXTE/PCA observation (observation ID 30188-02-20-00). The GIS events were extracted from a circular region of 6′ radius centered on the image peak, after selecting good time intervals in a standard procedure. The dead-time fractions were determined to be 9 for GIS 2 and 12 for GIS 3 in reference to the count-rate monitor data (Makishima et al. (1996)).


In pointing observations of ID 40112 in figure 1, the emission from 4U 1630-47 was very weak, and the count rate was constant, but higher, than the instrumental background level of the PCA. Considering further that a strong iron-line is present in the spectra, it is thought that diffuse X-ray emission from the Galactic plane was mainly observed in this period. This emission must be a background for the observed PCA spectra of 4U 1630-47. We fitted 29 pointing observations of ID 40112 with a thermal bremsstrahlung and a Gaussian representing the iron-line, multiplied by the interstellar absorption. Table 2 gives the values of the model parameters, each averaged over the 29 spectra. In a subsequent model fitting to the PCA spectra of 4U 1630-47, we included the Galactic X-ray background as a fixed model component, using the parameters in table 2.
| model | wabs∗ | bremss∗ | Gaussian∗ | ||||
| Normalization† | Line | Normalization | |||||
| (1022cm-2) | (keV) | (keV) | (photons cm-2 s-1) | ||||
| average | 1.62 | 17.0 | 0.025 | 6.58 | |||
| : ”wabs”, “bremss”, and “Gaussian” are spectral models in the xspec package; “wabs” represents the interstellar photoelectric absorption, “bremss” represents bremsstrahlung, and “Gaussian” represents an iron line. | |||||||
| : The normalization of “bremss” is in unit of [cm-5], where and are electron and ion densities, is the volume, and is the distance to the object. | |||||||
4 Data Analysis and Results
4.1 Spectral Fitting with the Standard Disk Model
In order to grasp how the X-ray spectra of 4U 1630-47 varied with time, we fitted all of the spectra with the MCD model plus a powerlaw model, multiplied by the interstellar photoelectric absorption. We left all of the continuum parameters free to vary. Since the interstellar absorption toward 4U 1630-47 is not well known, we first fitted all of the spectra with the column density, , left free, and then obtained an average value of = cm-2. We then repeated the fitting with fixed to this value. The values taken or obtained in previous studies are in the range of (5–12) cm-2 (Tomsick et al. 1998; Kuulkers et al. (1998); Cui et al. 2000; Dieters et al. (2000); Trudolyubov et al. 2001), and thus our value is consistent. The subsequent analysis employs the same value throughout. Because a broad iron-K absorption edge is often observed for black-hole binaries (Ebisawa et al. (1993)), we multiplied the powerlaw component by a smeared-edge model (hereafter smedge model) to improve the fits around the iron-edge region. The edge energy, , was typically found to be around 9 keV, and the optical depth, , was 0.1–3, with rather large errors. The edge width was not constrained. Therefore, hereafter, we do not discuss the edge feature. Hereafter, we call the above model as an “MCD plus powerlaw model”.
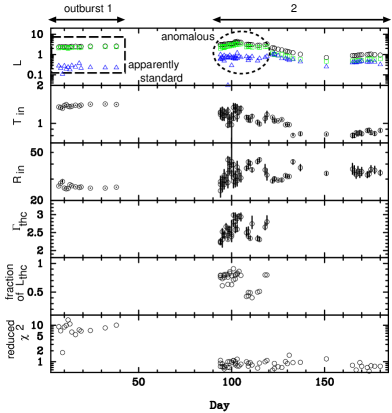
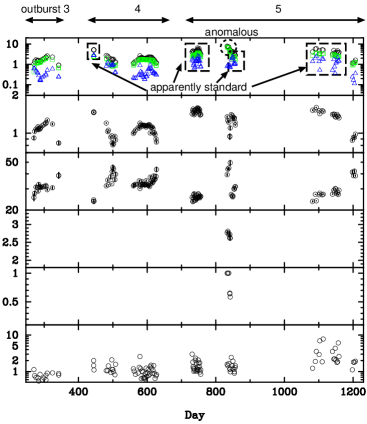
The best-fit parameters for a typical spectrum observed in each outburst are given in table 3, where the above model is indicated as “MD” model. In figure 2, we show time histories of the X-ray luminosity, best-fit parameters, and reduced . Based on the identification of the soft/hard transition by Tomsick, Kaaret (2000), we here do not treat the data with an X-ray luminosity of erg s-1, since such data are considered to be in the low/hard state. In addition, we discarded the data whose inner disk temperature is less than 0.8 keV, because the heavy interstellar absorption does not allow us to study such soft emission with confidence. In previous works, only outburst 2 was analyzed well, and our results concerning the MCD plus powerlaw model fits in the outburst 2 are almost consistent with those in Oosterbroek et al. (1998) and Tomsick, Kaaret (2000).
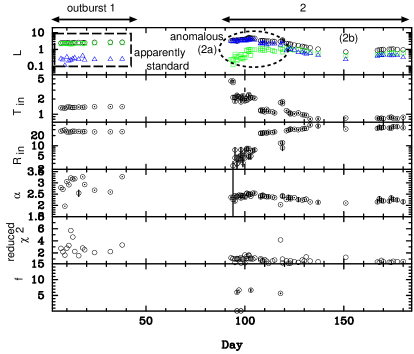
(a) Observation A (outburst 1)
apparently standard regime

(b) Observation B (outburst 2a)
anomalous regime

(c) Observation C (outburst 2b)
standard regime

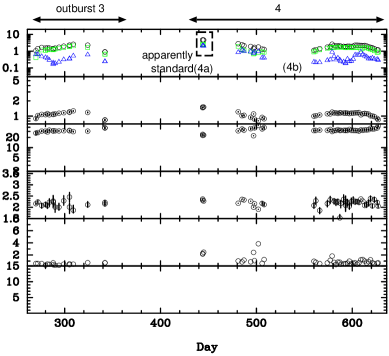
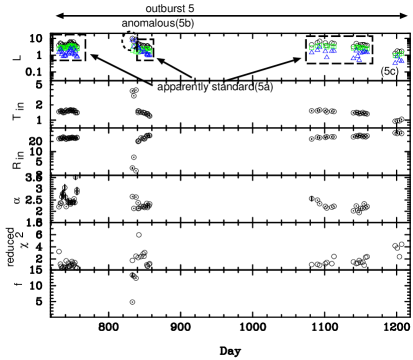
(d) Observation F (outburst 5a)
apparently standard regime

The apparent inner disk radius, , is calculated as . The value of can be related to the true inner radius, , as (Makishima et al. (2000)). Here, 1.7–2.0 (Shimura, Takahara (1995)) is a spectral hardening factor, and = 0.41 (Kubota et al. (1998)) is a correction factor for the inner boundary condition. We calculated the disk luminosity as from the best-fit apparent inner radius, , and the inner disk temperature, . The powerlaw luminosity, , in the 1–100 keV band is derived from the best-fit model, assuming an isotropic emission, and then the total luminosity is calculated as = + .
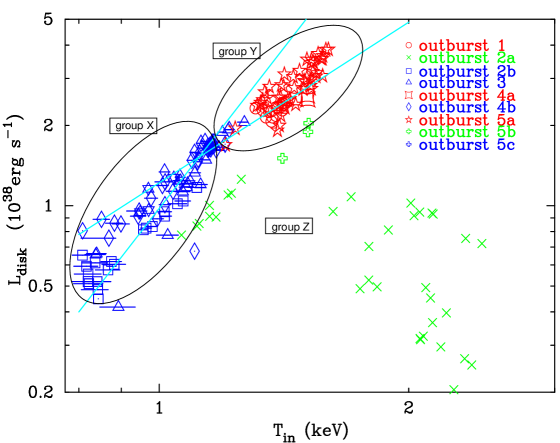
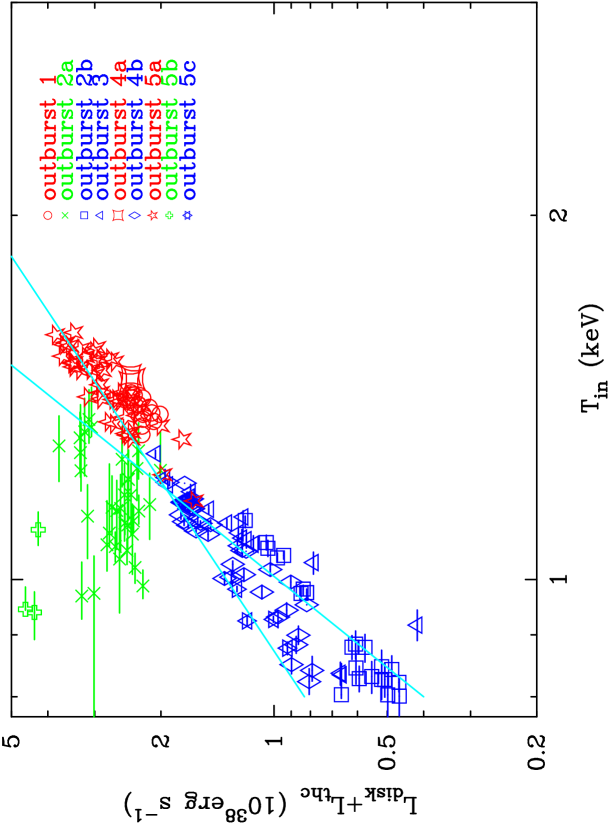
In figure 4, we show a scatter plot between and in order to see the overall behavior of the X-ray spectra. The data points, defined as group X in figure 4, generally follow the relation (the steeper solid line in the figure) which is expected for a standard accretion disk with a constant inner radius. However, two other groups of data deviate from this relation. One group (Y) of data shows to be higher than erg s-1, and follow a flatter dependence on than the standard relation of . The other group (Z) consists of those data points whose is much lower than those of the former two groups for the same , or whose is unusually high for black hole binaries. Below, we examine the data of individual groups to understand their spectral states.
Group X includes outburst 3 and the latter part of outbursts 2, 4, and 5 (hereafter 2b, 4b, and 5c, respectively). These data points have a constant , though changes from to erg s-1. The fits are acceptable, and as shown in figure 4c and table 3 for outburst 2b, the spectrum is represented by a dominant soft component and a powerlaw tail. These results indicate that the standard disk picture is realized in these periods. We hence ascribe the group-X data to the standard regime, after Kubota, Makishima, Ebisawa (2001) and Kubota, Makishima (2004b). The true inner radius, , can be estimated to be 30–45 km, corresponding to a non-spinning black-hole mass of 3.4–5.1. These values are reasonable for a black hole binary.
The former part of outburst 2 and the middle part of outburst 5 (hereafter, 2a and 5b respectively) are included in group Z. Sometimes, the values of are less than 10 km and is also as high as 2 keV or more. These values are unusual for black hole binaries. The typical spectrum in outburst 2a is shown in figure 4b. The hard powerlaw component is dominant compared with those in the (figure 4c). The fits are relatively poor; the reduced is relatively large in outburst 2a and quite large, 2, in outburst 5b. The luminosity of the powerlaw component dominates that of the MCD component for almost all of the group Z data, as seen in figure 2. Outburst 2a contains the period of the very high state defined in Trudolyubov, Borozdin, Priedhorsky (2001). These properties make this outburst reminiscent of the anomalous regime of GRO J1655-40 and XTE J1550-564 (Kubota et al. 2001, 2005). Hence, these data points are thought to correspond to the anomalous regime, which seems to appear at erg s-1 for 4U 1630-47.
Outburst 1 and the former part of outburst 4 (4a) are classified into group Y, so are two parts (outburst 5a) of outburst 5 before and after outburst 5b (figure 2). In outburst 1 (figure 4a and table 3), the reduced value is significantly large, even though the spectral shape is represented by the dominant soft component with a weak powerlaw tail as well as the standard regime. Large reduced values indicate that the spectra cannot be well represented by the standard disk model. As shown in figure 4a, the residual is significant between the data and MCD model around 5 keV. A narrow deep-edge structure is required around 7 keV for the powerlaw component in the MCD plus powerlaw model fitting, although this is thought to be artificial to explain the residual between the data and the MCD model, which is not the best model. Throughout this outburst, is very high at erg s-1, is quite low compared with (figure 2), and km is slightly smaller than that in the standard regime. Furthermore, the photon index of the powerlaw component is larger than 2.5, in contrast to the typical value of 2.0–2.5 in the standard regime of this source. These features of outburst 1 are the same as found in the apparently standard regime of XTE J1550-564. Outbursts 4a and 5a show several features that are somewhat different from those of outburst 1. The powerlaw component is not as weak as shown in figure 4d, and the photon index of the powerlaw component, 2.2–3.0, is only slightly larger than the typical values in the standard regime. Nevertheless, the disk luminosity is very high at erg s-1, and follows the relation of , as well as outburst 1. Therefore, while the spectral features of the powerlaw component are different among outbursts 1, 4a, and 5a, the behavior of the MCD component in these periods is similar to that of the apparently standard regime.
| ID∗ | ||||||||||
| model† | ‡ | ‡ | ‡ | ‡ | ‡ | ‡ | ‡ | ‡ | ‡ | /d.o.f. |
| (keV) | (km) | ‡ | (1038 erg s-1) | (keV) | (keV) | |||||
| ‡ | ||||||||||
| A (outburst 1) : apparently standard regime | ||||||||||
| MD | 9.5 | 1.32 | 28.6 | 2.71 | - | 2.24/-/0.11 | 7.00 | 1.00 | 0.01 | 92.7/52 |
| PF | 9.5 | 1.36 | 23.3 | 2.0(fix) | 0.65 | 1.74/-/0.34 | 7.00 | 0.15 | 0.21 | 29.7/49 |
| B§ (outburst 2a) : anomalous regime | ||||||||||
| MD | 9.5 | 1.83 | 7.15 | 2.33 | - | 0.52/-/3.21 | 7.76 | 0.05 | 10.8 | 196.6/107 |
| CM | 9.5 | 0.97 | 41.9 | 2.0 (fix) | 1.47 | 0.57/2.13/0.73 | 9.00 | 0.99 | 28.4 | 103.2/107 |
| 2.40 | ||||||||||
| C (outburst 2b) : standard regime | ||||||||||
| MD | 9.5 | 0.83 | 37.3 | 2.11 | - | 0.81/-/0.44 | 8.75 | 1.00 | 6.13 | 49.4/51 |
| D (outburst 3) : standard regime | ||||||||||
| MD | 9.5 | 1.03 | 27.6 | 2.21 | - | 1.18/-/0.48 | 8.92 | 1.00 | 8.92 | 35.6/46 |
| E (outburst 4a) : apparently standard regime | ||||||||||
| MD | 9.5 | 1.16 | 31.6 | 2.21 | - | 1.66/-/0.44 | 8.84 | 0.65 | 2.33 | 55.2/46 |
| PF | 9.5 | 1.22 | 26.9 | 2.0(fix) | 0.69 | 1.44/-/0.34 | 8.99 | 0.31 | 2.27 | 34.7/50 |
| F (outburst 5a) : apparently standard regime | ||||||||||
| MD | 9.5 | 1.55 | 23.6 | 2.50 | - | 2.96/-/1.47 | 8.24 | 1.00 | 23.2 | 64.4/47 |
| PF | 9.5 | 1.75 | 13.2 | 2.0(fix) | 0.54 | 1.48/-/1.09 | 8.57 | 0.19 | 1.69 | 31.6/44 |
| G§ (outburst 2a) : anomalous regime | ||||||||||
| MD | 9.5 | 1.22 | 23.5 | 2.35 | - | 1.04/-/2.02 | 8.98 | 0.71 | 29.8 | 115.5/109 |
| CM | 9.5 | 1.06 | 40.42 | 2.0 (fix) | 1.03 | 1.14/1.12/0.99 | 9.00 | 0.63 | 5.92 | 121.3/106 |
| 2.73 | ||||||||||
| CM∥ | 7.64 | 1.10 | 35.1 | 2.0 (fix) | 0.89 | 0.96/1.06/1.01 | 9.00 | 0.23 | 5.56 | 191.2/210 |
| 2.70 | ||||||||||
| :’A’, ’B’, ’C’, ’D’, ’E’, ’F’, and ’G’ corresponds to the observation ID 10411-01-04-00(MJD=50209), 30178-01-10-00(50862), 30172-01-08-00(50899), 40418-01-03-00(51310), 60118-01-07-00(52001), 70417-01-02-01(52532), and 30188-02-20-00(50870). | ||||||||||
| :“MD” is a MCD model plus a powerlaw model, multiplied by an interstellar absorption and a smeared edge (called as MCD plus powerlaw model in the text). “CM” is a model in which the model is included in addition to the “MD” model. “PF” is a -free disk model (see text subsection 4.3) plus a powerlaw model, multiplied by an interstellar absorption and a smeared edge. | ||||||||||
| : is the column density of the Galactic interstellar absorption in unit of cm-2. and are an inner disk temperature and radius, respectively. is a photon index of the powerlaw component. and are a normalization and a spectral index of the model (see text subsection 4.2). is a parameter of the -free disk model. , , and are the luminosity of the MCD, powerlaw (1–100 keV), and (0.01–100 keV) models, respectively. , and are an edge energy, depth and width, respectively, for the smeared edge model. | ||||||||||
| :Results by fitting the PCA and HEXTE spectra. The data other than ’B’ and ’G’ are results by using the PCA spectrum. | ||||||||||
| :Results by simultaneously fitting the PCA, HEXTE, and ASCA-GIS spectra. | ||||||||||
4.2 Consideration of the Inverse Compton Scattering
In the group-Z data, the spectral features are in good agreement with those in the of GRO J1655-40 and XTE J1550-564 (Kubota et al. 2001, 2005; Kobayashi et al. (2003)). We therefore consider, after these previous studies, that the enhanced powerlaw component with a steep slope is produced when a certain fraction of photons from the optically-thick disk are Compton-up-scattered by hot electrons around the disk. Following Kubota, Makishima (2004b), we refitted these spectra with a three-component model, in which a thermal Comptonization component (thcomp; Zycki et al. (1999)) is added to the original MCD plus powerlaw model. We hereafter refer this model to the “CM” model. We assumed that the seed photons are provided by the MCD emission, so the maximum color temperature of the seed photons was tied to . Furthermore, the electron temperature, , was fixed to 20 keV. Hence, the model has two free parameters: a photon index, , which expresses the spectral shape below , and a normalization, . Since the parameters of the and the powerlaw models can not be constrained independently, we fixed the photon index of the powerlaw component to 2.0, which is the average value in the standard regime. In figure 5, we show the time histories of the spectral parameters in the same manner as figure 2. Thus, the fit has been significantly improved, as shown in table 3 (see the line of “CM” model in table 3).
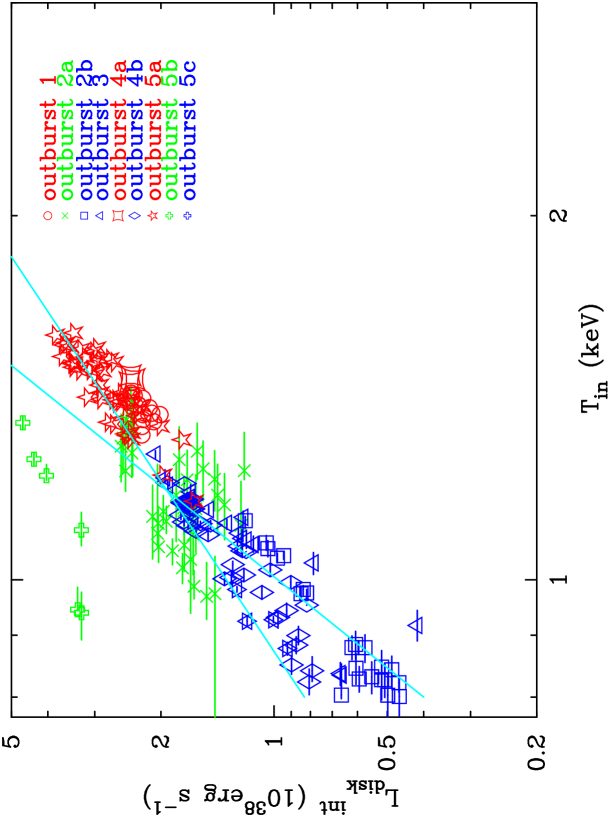
Following Kubota, Makishima (2004), we plot + against in figure 6a, where is a luminosity of the thcomp model in the 0.01–100 keV. The values of Tin become 0.9–1.4 keV, which are almost intermediate between the highest end of the standard regime and the lowest end of the apparently standard regime. However, the obtained values of + must be higher than the intrinsic luminosity of the underlying optically thick disk, , due to the inverse Compton scattering. To correct this effect, following the equation by Kubota, Makishima (2004), we calculate the intrinsic disk flux as
| (1) |
where and are 0.01–100 keV photon flux of the direct disk component and the Comptonized component, respectively. refers to the disk temperature obtained by considering the inverse Compton scattering. The intrinsic disk luminosity, , can be estimated as , where is given by equation (1). In figure 5, we plot a time history of estimated from obtained by this relation. Almost values of are obtained as 30–50 km, which are in good agreement with those in the standard regime. When the powerlaw photon index is fixed to a larger value of 2.3, the values of become smaller in such a way from 40 km to 32 km; the difference is not significant, and values obtained here are both close to that of the standard regime compared with the value in the MCD plus powerlaw model fitting. Figure 6b shows the estimated against ; the anomalous regime data points now align better along the standard disk locus, implying that the returns to its proper value. Thus, in the anomalous regime, the disk itself stays still in the standard state, whereas the inverse Compton-scattering process converts a significant fraction of its emission into the hard component, as suggested in GRO J1655-40 and XTE J1550-564.
Even after these corrections, some data points in figure 6b deviate from the standard relation. They are from outburst 5b, where the total luminosity becomes the highest among the RXTE observations. We speculate that the underlying disk, itself, becomes deviated in these period from the standard picture.
In outburst 2a, we have a simultaneous ASCA GIS coverage at MJD = 50870. The GIS covers the lower energy range of 0.7–10 keV than the PCA, which covers the energy range of 2–60 keV. Therefore, we can obtain more accurate values of and by using the GIS data. We included the 1–10 keV GIS spectrum in addition to the PCA and HEXTE spectra, and fit them simultaneously with the above “CM” model, without fixing the value of . The results are given in table 3 (label “G”), and the achieved fit is shown in figure 7. In spite of the wide energy range (1–100 keV) and the extremely high data statistics (of the GIS and the PCA/HEXTE), the “CM” model has provided an amazingly successful (d.o.f = 191.2/210) joint fit to the spectra. The best-fit parameters have remained close to those obtained with the RXTE data alone, without any knowledge for energies below 3 keV. These results give a strong justification to the “CM” modeling. As can be seen from figure 7a, the flux in an intermediate energy range (5–10 keV) is now carried by the component, with the MCD and powerlaw components dominating in the lower and higher energies, respectively. This makes a contrast to the conventional MCD plus powerlaw fit to the same PCA spectrum (figure 7b), in which the model tried to reproduce the intermediate-range flux by increasing (which in turn reduced ) and steepening the powerlaw.
(a)
(b)
(a)
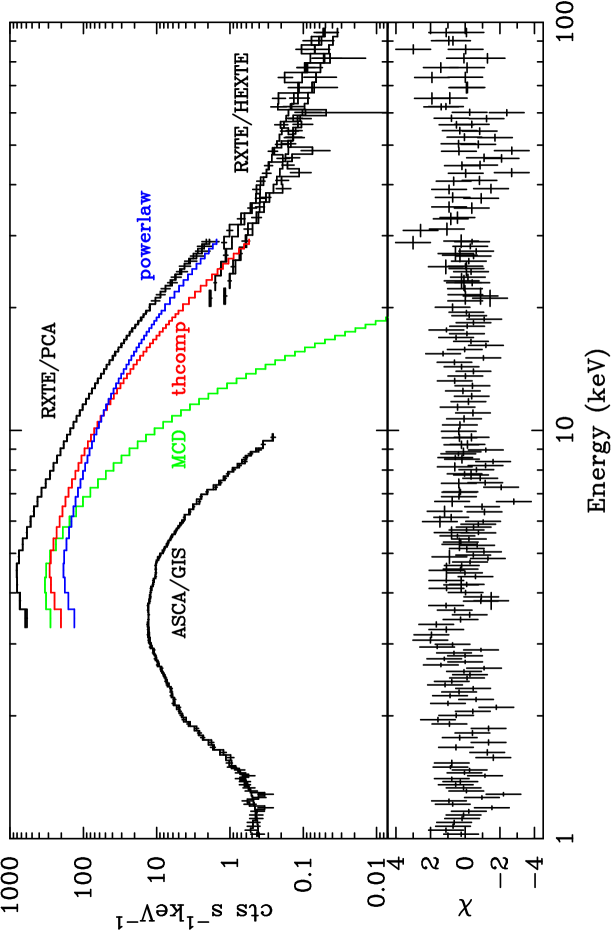
(b)

Here, for simplicity, only the PCA spectrum is shown.
4.3 Evidence of Slim Disk
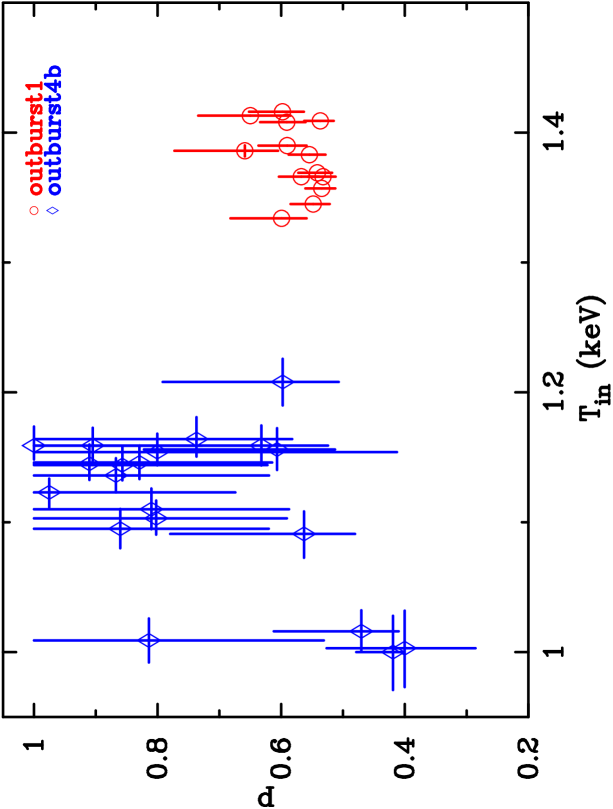
The spectral features in outbursts 1, 4a, and 5a (group Y) apparently resemble those in the standard regime. However, these data points follow the relation , as noticed in subsection 3.1, and the spectral shape is not necessarily represented by the standard MCD plus powerlaw model. This suggests that the spectral state in group Y corresponds to the apparently standard regime (Kubota, Makishima (2004b);Kubota et al. (2005)), in which the inner disk may be described by the slim-disk solution. In order to examine whether outburst 1 data can be described by the slim-disk picture, we here employ the -free disk model, which mathematically extends the MCD model (Mineshige et al. (1994); Hirano et al. (1995); Kubota et al. (2005)). This model assumes the radial temperature profile to be as , where is a free parameter. The profile with = 0.75 corresponds to the MCD model, while 0.75 yields a spectrum softer than the MCD model for the same . That is, a small suggests a low radiative efficiency at the inner portion of the accretion disk.
Following Kubota, Makishima (2004b), we fitted the spectra of the apparently standard regime, by replacing the MCD component with the -free disk model, by fixing the powerlaw photon index to 2. We hereafter refer this model to the “PF” model. The free parameters are , , normalization of the -free disk and the powerlaw model, and the smeared-edge model parameters. Here, we analyze the data of outbursts 1 and 4b; the former is in the apparently standard regime, while the latter is in the standard regime for comparison. The best-fit values and the reduced are plotted in figure 8a. It can be seen that the reduced for outburst 1 (apparently standard regime) dramatically becomes much smaller from to (see also figure 2 and table 3). The reduced values are still somewhat large, probably due to the incompleteness of the -free model, which does not take into account the inner boundary condition and relativistic effects. For outburst 4b (standard regime), the values widely scatter with large errors, indicating that the -free disk model introduces an extra parameter. Figure 8b shows the best-fit values of , plotted against obtained with the MCD plus powerlaw model fit. In this diagram, the values of in the apparently standard regime are 0.5–0.7, which is smaller than 0.8 in the standard regime at keV. Therefore, we suggest that the radiative efficiency at the inner accretion disk is lower in the apparently standard regime than in the standard regime; another cooling process, like advective cooling, is required in addition to radiative cooling. The theoretical solution of the slim disk takes into account the effect of advective cooling, and predicts smaller values of than the standard disk (e.g., Watarai et al. (2000)). In addition, a relation of is found, when the spectra predicted by the slim disk solution are fitted with the MCD plus powerlaw model (Watarai et al. (2000)). This explains the relation of of group Y. Thus, the X-ray spectra in group Y show evidence of a slim disk. This is the second example of such a state after XTE J1550-564. We note that the value of at a lower in outburst 4b (standard regime) is somewhat smaller, and such a trend is reported to be due to because the MCD model is a mere approximation of the exact standard-disk solution (Kubota, Makishima (2004b); Kubota et al. (2005)).
(a)


(b)
5 Discussion
5.1 Three Spectral States Concerned with the Disk Structure
Through an extensive spectral analysis of the RXTE data covering the five outbursts in 1996–2004, we confirmed that most of the X-ray spectra in the high state of 4U 1630-47 can be classified into three distinct spectral states. One state is well explained by the standard accretion disk, which appears when is less than 1.2 keV, or the X-ray luminosity is below erg s-1. In this standard regime, the data satisfies the relation, and thus this regime corresponds to the standard high/soft state. In this section, we give answers to aims 1, 3, and 4 of section 1.
When the X-ray luminosity exceeds erg s-1, the other two states appear. One of them, the anomalous regime, is characterized by the dominant steep ( 2.5) powerlaw, as well as the unusual values of and , which are obtained when fitting the spectra with the MCD plus powerlaw model. The dominant powerlaw component can be understood in such a way that a significant fraction of the disk emission (soft component) is converted into the hard component through inverse Compton scattering. The apparent variability of can be explained by this effect, and remains constant when we consider the Comptonized photons for the disk flux. Thus, after GRO J1655-40 and XTE J1550-564, 4U 1630-47 is the third source to exhibit the anomalous regime. The data of this regime is mostly in the very high state or intermediate state. Therefore, our interpretation by the Comptonization picture indicates that, in some parts of the very high state or intermediate state, the disk structure is still standard, but the ambient hot electron corona that Comptonizes the disk emission is formed and evolved. The quantification of spectral structures in the framework of Kubota, Makishima, Ebisawa (2001) is important, since the black hole mass measurement is still available, even in the very high state, and we can constrain the solid angle of the hot electron corona around the disk from the fraction of Comptonized photons in the disk emission.
The other state appears in outbursts 1, 4a, and 5a, where the spectral features are apparently similar to those in the standard regime. However, the disk luminosity is found to follow the relation , indicating a low radiation efficiency of the accretion disk. This feature is similar to those of the apparently standard regime observed in XTE J1550-564 (Kubota, Makishima (2004b)), and maybe interpreted as the formation of an optically thick advective disk, namely, a slim-disk. The apparently standard regime also corresponds to the standard high/soft state with very high X-ray luminosity. However, X-ray spectra are not exactly represented by the standard MCD plus powerlaw model, and prefer the -free disk model; and thus, we here stress that the disk structure somewhat deviates from the standard disk.
As above, we can mostly understand the disk structure in the high state of 4U 1630-47 within the framework of Kubota, Makishima, Ebisawa (2001) and Kubota, Makishima (2004b), after GRO J1655-40 and XTE J1550-564. However, some parts of the spectra cannot be well explained by the above three spectral states, and thus further studies are needed to understand the disk structure of a very high state or an intermediate state completely.
5.2 Flux Fraction of the Powerlaw Component and Critical Luminosity
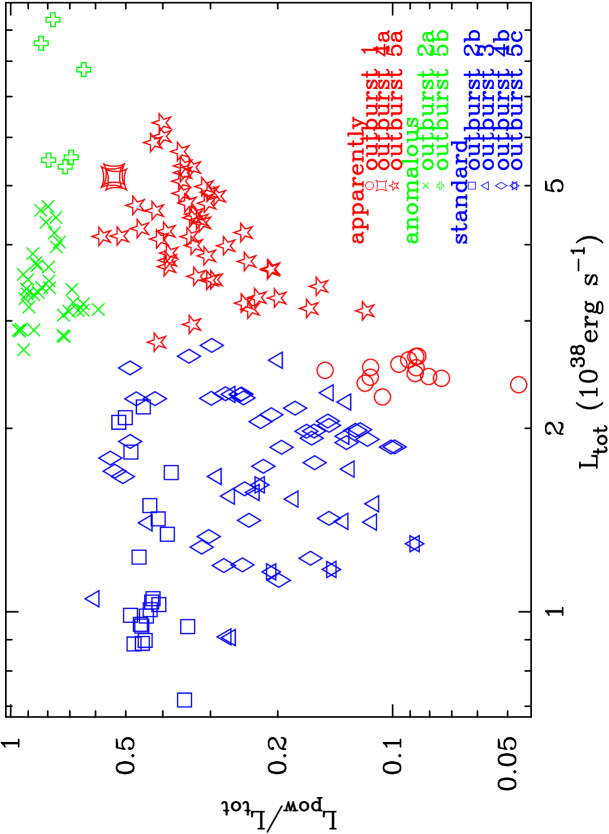
Although we have utilized luminosity-dependent spectral changes to distinguish the three states, there can be a simpler way of classification, which is usable even in limited snap-shot observations. In figure 9, we plot the luminosity ratio of the powerlaw to the total component, , against the total luminosity, , where is that obtained in the MCD plus powerlaw model fitting. It can be seen that the three states are clearly separated in this diagram. The standard regime (blue points) locates at erg s-1. The anomalous regime (green points) is characterized by erg s-1 and . The region of erg s-1 and corresponds to the apparently standard regime (red points). The threshold luminosity of erg s-1 should be different among black hole binaries, and hence cannot be constrained from the limited data. However, the anomalous regime can be identified only by . Therefore, if the data include the anomalous regime, we can constrain the threshold luminosity, and thus identify the apparently standard regime. This suggestion can be tested by using the RXTE data of a number of black hole binaries.
Throughout the five outbursts of 4U 1630-47, we have found that the well-defined critical luminosity of 2.5 1038 erg s-1 divides the standard regime from the other two, with a good reproducibility. This is the first case where the critical luminosity is almost the same among outbursts of one object, indicating that is proper to the object. Therefore, objective 2 in section 1 is achieved as above. We may also estimate the Eddington luminosity as (6.8–10.2) 1038 erg s-1, using the black hole mass estimate of 3.4–5.1 (subsection 4.1). Then, we find / = 0.25–0.35 for 4U 1630-47. This value is somewhat higher than the values of / 0.15–0.20 observed from GRO J1655-40 (Kubota et al. 2001) and XTE J1550-564 (Kubota, Makishima (2004b)), while lower than that for LMC X–3, / 0.9 (Kubota et al. 2001). The critical temperature corresponding to is 1.2 keV for 4U 1630-47 and GRO J1655-40, and 1.0 keV for XTE J1550-564. Therefore, the transition is not determined only by the temperature. We speculate that and the transition temperature may be determined by the combination of the black hole mass, spin, and the accretion rate.
5.3 Issues on the anomalous regime
Since the anomalous regime is important to understand the unified view of the very high state or intermediate state, we here briefly discuss two unresolved issues concerning the anomalous regime.
Outburst 2 was accompanied by an optically thin radio flare (Hjellming et al. (1999)). The radio flare lasted from MJD 50840 to MJD 50880, in good agreement with the anomalous regime period (figure 2). XTE J1550-564 also exhibits an optically thin radio flare (Wu et al. (2002)) in the anomalous regime (Kubota, Done (2004a)). In addition, for GRO J1655-40, XTE J1550-564, and 4U 1630-47, the radio flare and QPOs are associated with only the anomalous regime. These results suggest that the optically thin radio flare and QPOs have relations with the Comptonizing plasma, rather than the accretion disk, and these two phenomena are thus good indicators of the anomalous regime. Further studies of the correlation between the anomalous regime and a radio flare are interesting from the view point of the disk/jet connection.
In figure 6b, most data points of outburst 5b, which we identified as the anomalous regime, deviate from other data points toward higher luminosity. Such a deviation is similar to the case of the strong very high state in XTE J1550-564 (Kubota, Makishima, 2004b). They indicated that the accretion disk is not in the standard state and/or does not reach the last-stable orbit. In the case of 4U 1630-47, the high state continued just before outburst 5b, and thus the situation is different; the truncation of the disk is possibly caused by extremely high radiation pressure. Since the total luminosity was the highest in this outburst, the radiative pressure became highest. Then, the inner disk material is thought to produce a hot and optically thin corona. As a result, the disk is truncated and the inner disk radius, , becomes large, leading to the higher luminosity.
The authors give thanks to an anonymous referee for very useful comments and careful reading, and to the RXTE team for the satellite calibration and operations. This work has been supported by the Grant-in-Aid from the Japanese Ministry of Education, Culture, Sports, Science and Technology (14079206).
References
- Abramowicz et al. (1988) Abramowicz, M. A., Czerny, B., Lasota, J. P., & Szuszkiewicz, E. 1988, ApJ, 332, 646
- Belloni et al. (2005) Belloni, T., Homan, J., Casella, P., van der Klis, M., Nespoli, E., Lewin, W. H. G., Miller, J.M., & Méndez, M. 2005, A&A in press (astro-ph/0504577)
- Bloser et al. (1996) Bloser, P. F., Barret, D., Grindlay, J. E., Zhang, S. N., Harmon, B. A., Fishman, G. J., & Paciesas, W. S. 1996, A&AS, 120, 191
- Bradt, Swank, Rothschild (1993) Bradt, H., Rothschild, R. E., & Swank, J. H-. 1993, A&AS, 97, 355
- Casella et al. (2004) Casella, P., Belloni, T., Homan, J., & Stella, L. 2004, A&A, 426, 587
- Cui, Chen, Zhang (2000) Cui, W., Chen, W., & Zhang, S. N. 2000, ApJ, 529, 952
- Dieters et al. (2000) Dieters, S. W. et al. 2000, ApJ, 538, 307
- Dotani et al. (1997) Dotani, T., et al. 1997, ApJ, 485, L87
- Ebisawa et al. (1994) Ebisawa, K., et al. 1994, PASJ, 46, 375
- Ebisawa et al. (1993) Ebisawa, K., Makino, F., Mitsuda, K., Belloni, T., Cowley, A. P., Schmidtke, P. C., & Treves, A. 1993, ApJ, 403, 684
- Hirano et al. (1995) Hirano, A., Kitamoto, S., Yamada, T. T., Mineshige, S., & Fukue, J. 1995, ApJ, 446, 350
- Hjellming et al. (1999) Hjellming, R. M., et al. 1999, ApJ, 514, 383
- Homan et al. (2001) Homan, J., et al. 2001, ApJS, 132, 377
- Jahoda et al. (2005) Jahoda, K., et al. 2005, ApJS submitted
- Jones et al. (1976) Jones, C., Forman, W., Tananbaum, H., & Turner, M. J. L. 1976, ApJ, 210, L9
- Kalemci et al. (2004) Kalemci, E., Tomsick, J. A., Rothschild, R. E., Pottschmidt, K., & Kaaret, P. 2004, ApJ, 603, 231
- Kobayashi et al. (2003) Kobayashi, Y., Kubota, A., Nakazawa, K., Takahashi, T., & Makishima, K. 2003, PASJ, 55, 273
- Kubota, Done (2004a) Kubota, A., & Done, C. 2004a, MNRAS, 353, 980
- Kubota, Done, Makishima (2002) Kubota, A., Done, C., & Makishima, K. 2002, MNRAS, 337, L11
- Kubota et al. (2005) Kubota, A., Ebisawa, K., Makishima, K., & Nakazawa, K., 2005, ApJ submitted
- Kubota, Makishima (2004b) Kubota, A., & Makishima, K. 2004b, ApJ, 601, 428
- Kubota, Makishima, Ebisawa (2001) Kubota, A., Makishima, K., & Ebisawa, K. 2001, ApJ, 560, L147
- Kubota et al. (1998) Kubota, A., Tanaka, Y., Makishima, K., Ueda, Y., Dotani, T., Inoue, H., & Yamaoka, K. 1998, PASJ, 50, 667
- Kuulkers, van der Klis, Parmar (1997) Kuulkers, E., van der Klis, M., & Parmar, A. N. 1997, ApJ, 474, L47
- Kuulkers et al. (1998) Kuulkers, E., Wijnands, R., Belloni, T., Mendez, M., van der Klis, M., & van Paradijs, J. 1998, ApJ, 494, 753
- Levine et al. (1996) Levine, A. M., Bradt, H., Cui, W., Jernigan, J. G., Morgan, E. H., Remillard, R., Shirey, R. E., & Smith, D. A. 1996, ApJ, 469, L33
- Makishima et al. (1996) Makishima, K., et al. 1996, PASJ, 48, 171
- Makishima et al. (2000) Makishima, K., et al. 2000, ApJ, 535, 632
- Makishima et al. (1986) Makishima, K., Maejima, Y., Mitsuda, K., Bradt, H. V., Remillard, R. A., Tuohy, I. R., Hoshi, R., & Nakagawa, M. 1986, ApJ, 308, 635
- McClintock, Remillard (2003) McClintock, J. E., & Remillard, R. A. 2003, astro-ph/0306213
- Mineshige et al. (1994) Mineshige, S., Hirano, A., Kitamoto, S., & Yamada, T. T. 1994, ApJ, 426, 308
- Mitsuda et al. (1984) Mitsuda, K., et al. 1984, PASJ, 36, 741
- Miyamoto et al. (1993) Miyamoto, S., Iga, S., Kitamoto, S., & Kamado, Y. 1993, ApJ, 403, L39
- Mizuno, Kubota, Makishima (2001) Mizuno, T., Kubota, A., & Makishima, K. 2001, ApJ, 554, 1282
- Narayan, McClintock, Yi (1996) Narayan, R., McClintock, J. E., & Yi, I. 1996, ApJ, 457, 821
- Narayan, Yi (1994) Narayan, R., & Yi, I. 1994, ApJ, 428, L13
- Narayan, Yi (1995) Narayan, R., & Yi, I. 1995, ApJ, 452, 710
- Nespoli et al. (2003) Nespoli, E., Belloni, T., Homan, J., Miller, J. M., Lewin, W. H. G., Méndez, M., & van der Klis, M. 2003, A&A, 412, 235
- Ohashi et al. (1996) Ohashi, T., et al. 1996, PASJ, 48, 157
- Oosterbroek et al. (1998) Oosterbroek, T., Parmar, A. N., Kuulkers, E., Belloni, T., van der Klis, M., Frontera, F., & Santangelo, A. 1998, A&A, 340, 431
- Parmar, Angelini, White (1995) Parmar, A. N., Angelini, L., & White, N. E. 1995, ApJ, 452, L129
- Parmar, Stella, White (1986) Parmar, A. N., Stellar, L., & White, N. E. 1986, ApJ, 304, 664
- Parmar et al. (1997) Parmar, A. N., Williams, O. R., Kuulkers, E., Angelini, L., & White, N. E. 1997, A&A, 319, 855
- Remillard et al. (2002) Remillard, R. A., Sobczak, G. J., Muno, M. P., & McClintock, J. E. 2002, ApJ, 564, 962
- Rutledge et al. (1999) Rutledge, R. E., et al. 1999, ApJS, 124, 265
- Shakura, Sunyaev (1973) Shakura, N. I., & Sunyaev, R. A. 1973, A&A, 24, 337
- Shimura, Takahara (1995) Shimura, T., & Takahara, F. 1995, ApJ, 445, 780
- Takizawa (1991) Takizawa, M. 1991, Master Thesis, the University of Tokyo
- Tanaka, Lewin (1995) Tanaka, Y., & Lewin, W. H. G. 1995, in X-ray Binaries, ed. W. H. G. Lewin, J. van Paradijs, & E. P. J. van den Heuvel (Cambridge, UK: Cambridge University Press), 126
- Tomsick, Kaaret (2000) Tomsick, J. A., & Kaaret, P. 2000, ApJ, 537, 448
- Tomsick, Lapshov, Kaaret (1998) Tomsick, J. A., Lapshov, I., & Kaaret, P. 1998, ApJ, 494, 747
- Trudolyubov, Borozdin, Priedhorsky (2001) Trudolyubov, S. P., Borozdin, K. N., & Priedhorsky, W. C. 2001, MNRAS, 322, 309
- van der Klis (1994) van der Klis, M. 1994, A&A 283, 469
- van der Klis (2004) van der Klis, M. 2004, astro-ph/0410551
- Watarai et al. (2000) Watarai, K., Fukue, J., Takeuchi, M., & Mineshige, S. 2000, PASJ, 52, 133
- Wu et al. (2002) Wu, K., et al. 2002, ApJ, 565, 1161
- Zycki et al. (1999) Zycki, P. T., Done, C., & Smith, D. A. 1999, MNRAS, 309, 561