LYMAN ALPHA LINE SPECTRA OF THE FIRST GALAXIES: DEPENDENCE ON OBSERVED DIRECTION TO THE UNDERLYING CDM FILAMENT
Abstract
The first galaxies in the Universe are built up where cold dark matter (CDM) forms large scale filamentary structure. Although the galaxies are expected to emit numerous Ly photons, they are surrounded by plentiful neutral hydrogen with a typical optical depth for Ly of (H I halos) before the era of cosmological reionization. The H I halo almost follows the cosmological Hubble expansion with some anisotropic corrections around the galaxy because of the gravitational attraction by the underlying CDM filament. In this paper, we investigate the detectability of the Ly emissions from the first galaxies, examining their dependence on viewing angles. Solving the Ly line transfer problem in an anisotropically expanding H I halo, we show that the escape probability from the H I halo is the largest in direction along the filament axis. If the Ly source is observed with a narrow-band filter, the difference of apparent Ly line luminosities among viewing angles can be a factor of at an extreme case. Furthermore, we evaluate the predicted physical features of the Ly sources and flux magnification by gravitational lensing effect due to clusters of galaxies along the filament. We conclude that, by using the next generation space telescopes like the JWST, the Ly emissions from the first galaxies whose CDM filament axes almost face to us can be detected with the S/N of .
1 INTRODUCTION
One of the most important questions in cosmology is how galaxies are formed and evolved in the context of the cold dark matter (CDM) Universe. To answer the question, it is essential to search for young galaxies at high-redshift systematically and to study their observational properties in detail. In the hierarchical structure formation scenario of the CDM Universe, the first bright objects and/or the first galaxies are predicted to be formed in about some hundreds Myrs after the Big Bang (i.e., redshift ) and to be embedded in the deep gravitational potential wells of the CDM (see e.g., Abel et al., 1998; Bertschinger, 1998; Bromm et al., 1999; Yoshida et al., 2003). They are expected to be luminous at the Ly line (Partridge & Peebles, 1967) because the strong ionizing radiation from young massive stars in the galaxies should lead to prominent Ly emission through the recombination of hydrogen in their interstellar medium.
In this decade, many galaxies which appear to be at early stages have been observed (e.g., Rhoads et al., 2000; Steidel et al., 2000; Ajiki et al., 2003; Shapley et al., 2003; Hayashino et al., 2004; Matsuda et al., 2004; Wang et al., 2005). Recently, the galaxies beyond redshift 6 have been frequently detected by their prominent Ly emission with faint continuum (Ly emitters [LAEs]) by using ground-based large telescopes like Subaru (Kodaira et al., 2003; Nagao et al., 2004; Taniguchi et al., 2005; Shioya et al., 2005), Keck (Hu et al., 2002; Rhoads et al., 2004) and VLT (Cuby et al., 2003; Kurk et al., 2004; Tran et al., 2004). Moreover, surprisingly, the possible detection of a redshift galaxy is reported by Pelló et al. (2004), although this is still controversial (Bremer et al., 2004; Weatherley et al., 2004). In the following decade, next generation space telescopes like the James Webb Space Telescope (JWST) are launched. The expected limiting flux of JWST for a point source reaches to nJy-level () in the wavelength range of ; this range corresponds to the redshifted Ly wavelength at the source redshift of . Thus, it seems to be in not-so-distant future that the Ly emission from the first galaxies and/or the LAEs beyond redshift of 10 are firmly detected.
However, before the era of cosmological reionization, these first galaxies should be surrounded by plentiful neutral hydrogen in the intergalactic medium (IGM); we call this “H I halo” from now on. For completely neutral Universe, typical scattering optical depth for the Ly photons escaped from the galaxies at redshift about 10 is estimated to be by using the standard cosmological parameters. One might be discouraged by the extremely high optical depth for the Ly photons, but it has been shown that most of them can escape from the H I halo around a Ly source at young Universe and travel freely toward the observer (Loeb & Rybicki, 1999). The reasons are as follows: (1) Ly photons are not destroyed in the intergalactic space because free-electrons and dust as sources of the two-photon decay and the ultraviolet continuum absorption, respectively, rarely exist in the IGM in such early Universe; (2) in the H I halo, which is assumed to expand following the pure cosmological Hubble flow, the Ly photons are scattered many times and diffused redward in wavelength; at last, cumulative scattering redshift grows large enough to escape from the H I halo.
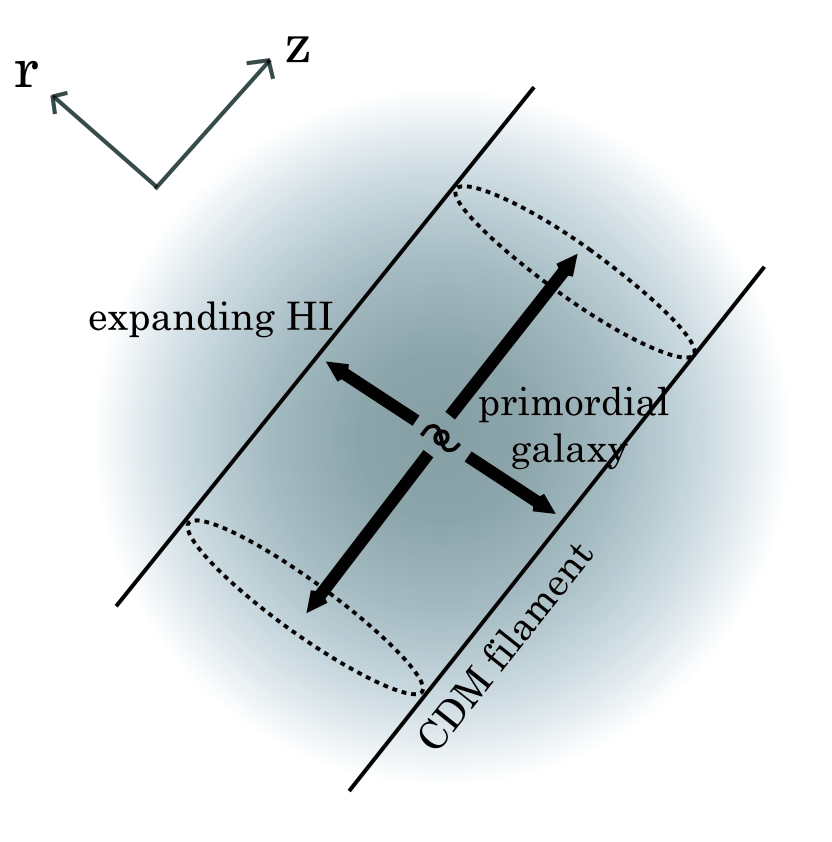
The hierarchical structure formation scenario of the CDM Universe indicates that the first galaxies are formed at high-density peak regions in the CDM distribution. In such regions, the CDM structures are predicted to be filamentary by numerical N-body simulations (e.g., Yoshida et al., 2003). The underlying CDM filament may affect the H I halos around them by gravitational attraction force. It is naturally expected that the gravity works anisotropically; it is the strongest in direction perpendicular to the axis of the CDM filament (-direction), while it is the weakest along the axis direction (-direction). This situation around one of the first galaxies is illustrated schematically in figure 1. Considering such situation, we assume an improved expansion law to the H I halo in our previous paper (Kobayashi & Kamaya, 2004, KK04 in short) (spheroidal expansion law; see equation (1) below): the H I halo expands following a pure Hubble expansion in -direction, while it is decelerated to some extent from the pure Hubble flow in -direction.
We have investigated the effects of the anisotropic expansion of the H I halo to the Ly line profiles and luminosities of the first galaxies in KK04. We have found the following two effects: (1) the peak of the Ly line is redshifted to longer wavelength; (2) the full width at half maximum (FWHM) of the line is broadened to wider than those of the isotropic expansion model to the H I halo. Since the FWHM corresponds to the Doppler width at the temperature of , it has been predicted that no intrinsic Ly line features of the first galaxies appear. As deceleration against the Hubble expansion by the gravity of the filament becomes strong, these two effects result in less luminosity of the diffuse Ly emission line.
Furthermore, as expected from the anisotropy in the expansion of the H I halo, the Ly line profile has dependence on the direction from which the Ly source galaxy is observed. Clarifying such dependence is essential to discuss the detectability of Ly emission lines from the first galaxies. The dependence can be studied by dividing the solid angle around the source into some regions and by investigating the Ly line profile in each region. However, we have not been able to examine the dependence in KK04 to keep the high statistical reliance of the numerical solution in a Monte Carlo simulation. This is because the following reason: in a Monte Carlo simulation, the convergence of the solution needs to be checked by increasing the number of test photons, but the total number of test photons has been restricted by the weak computational power to in KK04. We have improved the numerical code to solve the transfer problem with larger number of test photons than . Therefore, this is the time to revisit the Ly line transfer problem in the anisotropically expanding H I halo with the improved numerical code.
In this paper, we reexamine the Ly line transfer problem with 10 times larger number of test photons than that of KK04. In §2, followed by KK04, we summarize the formalism of the Ly line transfer problem in an expanding H I halo and discuss about the model of the H I halo. Our numerical results such as Ly line profiles, apparent Ly line luminosities, and typical angular sizes of the first galaxies in Ly emission observed from the - and -directions are shown in §3. Then, in §4, we give the Ly flux of the source with intrinsic Ly line luminosity of , and discuss the expected signal-to-noise ratio (S/N) for the source in the case of the observation by the JWST. Finally, we conclude the paper in §5. We adopt the WMAP cosmological parameters in the whole calculations of this paper, that is, and (Spergel et al., 2003).
2 FORMULATION AND CALCULATION
As briefly described in introduction, we have formulated a Ly line transfer problem in KK04 according to Loeb & Rybicki (1999), setting a simple assumption to the expansion law of H I halo, that is, spheroidal expansion law:
| (1) |
where is recession velocity, is the Hubble expansion rate at the Ly photon source redshift of , and is the asphericity or the decreasing rate of the recession velocity in -direction ( plane) to the pure Hubble expansion. In other words, this parameter represents the relative intensity of the gravitational attraction force by the underlying CDM filament to the cosmological Hubble expansion. We choose the parameter of as a free parameter from 1.0 (corresponds to the pure Hubble expansion in all directions) to 0.3 with a step of 0.1. As noted in KK04, is assumed to be a single value globally for simplicity, although it should have different values depending on the distance from the CDM filament and approach to unity as leaving the galaxy far behind. This assumption can be hold because of the following reason. The properties of escaping Ly photons are determined essentially at a position where the optical depth for the Ly photons decreases to about unity and where the physical distance from the source galaxy is . The characteristic proper distance of is a function of and gradually increases from 1.0 to 2.9 Mpc as decreases from 1.0 to 0.3. The gravity of the underlying CDM filament can affect this region even at the early Universe (Bond et al., 1996; Colberg et al., 2004).
Let , , ) be the specific intensity of a Ly line (in photons ), where is comoving frequency, is radial vector from the source galaxy, and is direction cosine vector. The comoving transfer equation for a Ly line with the assumption of isotropic coherent scattering is given by
| (2) |
Here, is the redshift of the frequency where is the resonant frequency of Ly and is the photon frequency; is the Ly scattering opacity at the frequency redshift (the analytical form is represented in KK04); is the mean intensity; is the Ly emission function; is the increasing rate of the frequency redshift per unit distance in the -direction (i.e. the direction in which the H I medium in a H I halo follows the pure Hubble expansion); and
| (3) |
represents the effect of the anisotropic expansion of a H I halo where is the -axis component of direction cosine. The source function on the right-hand side of equation (2) can be written as
| (4) |
where is the steady emission rate of Ly photons by the source (in photons ) and assumed to be constant.
In the whole calculation in this paper, we assume that a steady point source galaxy at redshift 10 which lit up before the cosmological reionization is surrounded by a uniform, completely neutral IGM. In other words, we assume that the reionization epoch is redshift , which is intermediate between the late epoch of (Becker et al., 2001) and the early epoch of (Kogut et al., 2003). Apparently, the assumption of completely neutral IGM at redshift is oversimplified since a local cosmological H II region can spread over the source of Ly photons (e.g., Haiman, 2002; Santos, 2004). Although the so-called “proximity effect” is important for quasars but is less so for galaxies, the typical sizes of the H II regions around Ly source galaxies are expected to be not much less than proper Mpc, which is comparable to the size of the scattering region discussing in this paper (Barkana & Loeb, 2001). So there simply must be a phase when H II regions around early galaxies are becoming larger than the surrounding filaments; our results can hold prior to the phase. Fortunately, as shown in KK04, the Ly line profiles of the first galaxies at redshift , which are considered to be in such phase, are analogous with those of sources at redshift 10 shown in this paper. However, some corrections for the model assumed in this paper due to the H II regions around Ly sources and the density fluctuations in H I halo may be necessary.
Our calculation algorithm is identical with that of KK04. Avoiding redundancy, we only summarize the Monte-Carlo technique used in the calculations here (see §2 and §3 of KK04 for the details). At first, according to an initial frequency redshift of test photons from the Ly line center, the initial distances of them from the source are determined stochastically by means of the diffusion solution of Loeb & Rybicki (1999). The tentative optical depth for a test photon is determined as , where is a random number between 0 and 1, and the photon proceeds the distance proportional to . Once , we say that the photon escapes from the H I halo. During scattering events, the frequency redshift of a photon is increased according to the value of . These procedures are repeated until all test photons escape from the H I halo.
The total number of the test photons is , which is ten times larger than that of KK04. Thanks to the increase of calculating photon number and the improvement of our numerical code, we can divide the whole solid angle into regions with almost the same statistical precision as that of KK04. These regions are selected to have the same solid angle of and to be axi-symmetric around the filament axis. Thus, it can be discussed meaningfully how much the Ly line profiles and the apparent Ly line luminosities of the first galaxies depend on the direction from which they are observed. We adopt and for all calculations shown in this paper.
3 RESULTS
First, we define the Ly line profile per unit wavelength per unit solid angle (in ), , as the following equation:
| (5) |
where is the number of escaping photons with the observed wavelength and solid angle in ranges of and , respectively; is the resonant wavelength of Ly in the rest-frame. The characteristic quantity on the denominator of the right-hand side of equation (5) represents the initial total energy of the test photons in the observer frame. Therefore, the integrated value of over the whole wavelength and solid angle becomes unity only if the wavelength redshifts caused by scattering in expanding H I halos are negligible.
3.1 Mean line profiles and scattered line luminosities
Before we investigate the dependence of the observed Ly line profile and apparent Ly line luminosity of the first galaxies on viewing angles to them, we show the characteristic effects of the anisotropic expansion of a H I halo to the Ly emission line according to KK04. For this purpose, here we define two tentative quantities: mean Ly line profile and scattered Ly line luminosity, denoted by and , respectively. We emphasize here that they are not observational quantities except for those with but make the effects of the anisotropic expansion of a H I halo clear.
For a certain , is obtained by counting the number of test photons with the observed wavelength in range of without distinction among escape directions, :
| (6) |
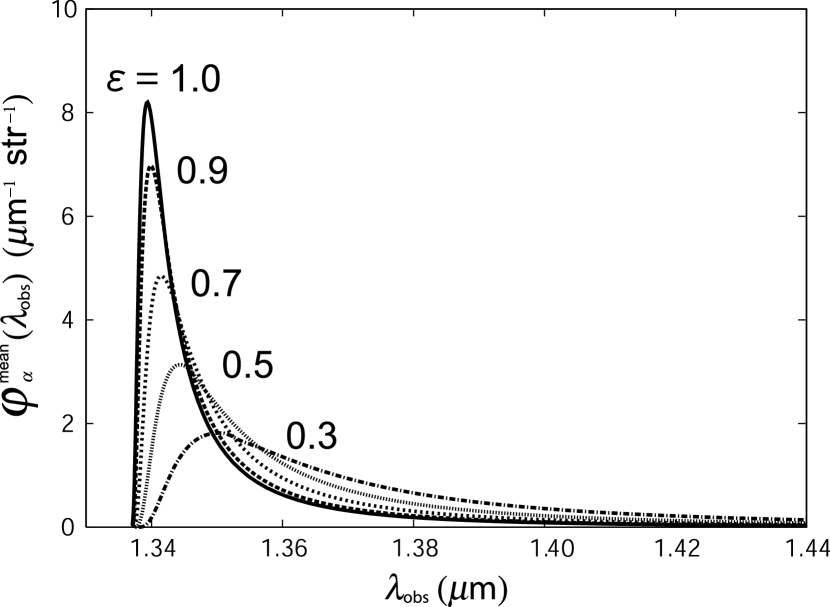
Note that is obtainable without knowing each line profile which is observed from a viewing angle. Figure 2 presents the mean Ly line profiles for the various values of the parameter . The solid, long-dashed, short-dashed, dotted, long dash-dotted lines are (the Hubble expansion), 0.9, 0.7, 0.5, and 0.3, respectively. As decreases, the wavelength at which has its peak value, , becomes longer as well as the peak value itself becomes lower; as a result, becomes more diffuse in wavelength. These lines are well in agreement with the results of KK04.
The scattered Ly line luminosity normalized by the total energy of the test photons in the observer frame, , is obtained by the product of the integral of over the whole wavelength and the whole solid angle :
| (7) |
This represents the total energy fraction of the scattered Ly line to the intrinsic one and therefore the value of is always lower than (or perhaps equal to) unity. Recall that this is not an observational quantity for that with . and are selected to be ( where ) and , respectively; this wavelength range covers almost all photons escaped from the H I halo. The results of are listed at the 7th column in table 1 for some . One can see that is always lower than unity and slightly decreases as decreases.
3.2 Characteristic line profiles and apparent line luminosities
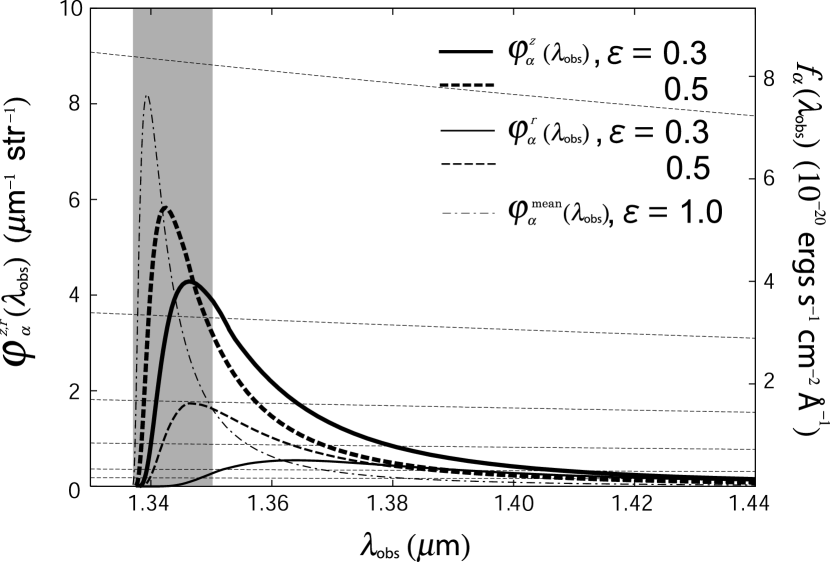
Here we present the numerical results of observed Ly line profiles and apparent Ly line luminosities of the first galaxies in order to investigate the dependence of them on viewing angles. First, we consider the observed line profiles of two characteristic cases; one can be seen from -direction and the other from -direction denoted by and , respectively. These are obtained by integrating over the representative solid angle of , and then, by multiplying the integrated value by a factor of . We note here that, for , and completely correspond with each other and with . The results are depicted in figure 3 for (thick and thin solid lines) and (thick and thin dashed lines); the thick and thin lines are and , respectively. for is also shown (dash-dotted line) for reference. One can see that, at the whole range of the observed wavelength, with a certain has always larger value than that of with the same . In addition, rapidly fades down as decreases, while doesn’t.
The characteristic quantities of the observed Ly line profiles (i.e., and the FWHM) are summarized in table 1. At the 2nd and 3rd columns, of and with various parameters of are compiled, respectively. It is shown that of is redshifted to longer wavelength than that of with the same . The 4th and 5th columns present the FWHMs of and , respectively, and the 6th column shows the ratio of the FWHMs of to . These indicate that is always wider than with the same and that the difference among them grows further as decreases. For convenience, we also give the measure of the observed flux per unit wavelength, , on the right-hand side of the vertical axis in figure 3 (in ), which is defined by
| (8) |
Here, is luminosity distance from the observer to the source redshift . For which we adopt in this paper as the redshift of the Ly emission source, is cm ( Gpc). We apply a typical Ly line luminosity of high-redshift LAEs of (e.g., Taniguchi et al., 2003; Hu et al., 2004; Malhotra & Rhoads, 2004; Santos et al., 2004) as a reference luminosity of the Ly source at ; this is based on the fact that the luminosity function of LAEs in the redshift from 3 to 6 does not significantly change (Malhotra & Rhoads, 2004; van Breukelen et al., 2005). The expected JWST limiting flux for a point source of 1 nJy to the source at redshift 10 with intrinsic Ly line luminosities of is also presented by contours in figure 3 (from top to bottom).
The apparent Ly line luminosities can be obtained by integrating the observed line profile in a certain range of wavelength and by multiplying the integrated value by a factor of like in equation (7). This multiplication of the whole solid angle reflects that, when a Ly source at is observed, the Ly line luminosity is estimated under the assumption that the Ly emission from the source is isotropic with the observed flux density. Thus, this apparent Ly line luminosity coincides with the scattered Ly line luminosity only in the case that the Ly photons isotropically escape from the H I halo. In this paper, we adopt the integral interval from to , assuming the source is observed with a tentative narrow-band filter centered at with a bandwidth of . Then, we can obtain the apparent Ly line luminosities of and for and , respectively. and are listed at the 8th and 9th column in table 1, respectively, and their ratio is given at the last column. Compared with at the same , is always brighter. As decreases, rapidly decreases while remains high value; therefore, the ratio of to increases and results in the factor of for .
3.3 Surface brightness distributions
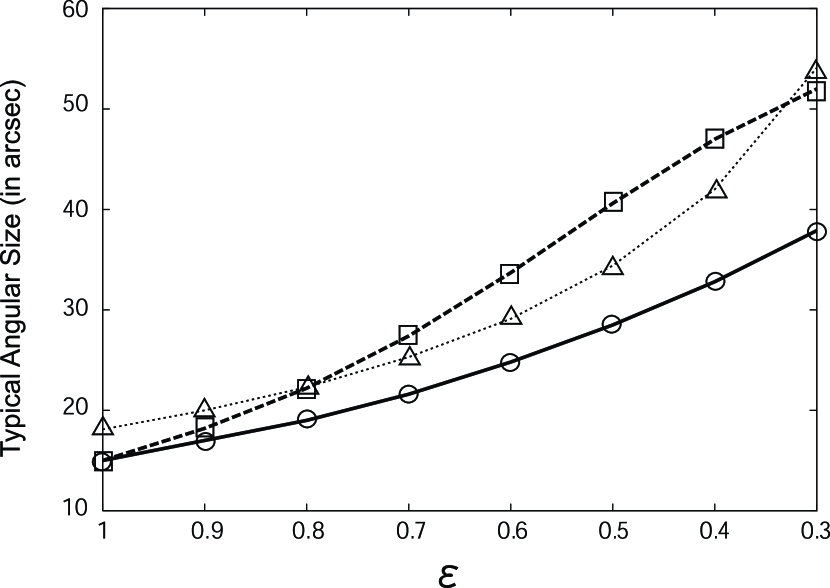
Our results also indicate that Ly emissions from the first galaxies are no longer point sources but diffuse on the sky; this agrees with the result of the previous work by Loeb & Rybicki (1999). This means that the surface brightnesses of the first galaxies at the Ly line become low. As well known, it is more difficult to detect more diffuse sources on the sky with same total luminosity (Yoshii, 1993). In order to examine whether the predicted Ly source can be detected by the JWST, here we present the typical angular radius of the source at Ly line, in which the number fraction of incoming Ly photons becomes 0.90, in figure 4 for various . The open circles with the thick solid line and open squares with the thick dashed line represent the typical angular radii of the source observed from the - and -directions, respectively. We also present the angular radius corresponding to the physical radius of as the open triangles with the thin dotted line for reference. Numerical results are the open circles, open squares, and open triangles, while the various lines are the linear interpolators of them. Regardless of the observed direction, the typical angular size grows monotonically as decreases; it ranges from to . The typical angular size of the source increases most rapidly in the case that the source is observed from -direction.
4 DISCUSSION
According to the results described in the previous section, we discuss the effects of the anisotropic expansion of a H I halo to the observed Ly line profile and the apparent Ly line luminosity of a redshift 10 galaxy, and then, examine the detectability of the Ly emission by the JWST.
4.1 Detectability of Ly emission: general comments
As shown in figure 2 and summarized at the 7th column in table 1, the mean observed Ly line profile becomes more diffuse in wavelength and the scattered Ly line luminosity becomes dimmer as decreases. This result implies that, on average, the detectability of the first galaxies by their Ly emissions gets worse as the expansion law of the H I halos becomes more anisotropic. Moreover, as decreases, the discrepancy between the peak wavelength of the scattered Ly line and the resonant wavelength of Ly in the observer frame becomes more significant. That is, of the Ly line of the first galaxies does not correspond to . This discrepancy causes a blunder of the Ly source redshift. In order to estimate the source redshift correctly, other lines of the same source such as H need to be detected.
However, once the object with a very broad emission line which is very diffuse on the sky is detected, the effect of scattering in a H I halo can be easily recognized. This is because the FWHM of the Ly line is anomalously broad and corresponds to a Doppler width at the temperature of ; this is not easily attainable by any other physical processes. Although the features of the Ly emissions from the first galaxies have not been fully understood yet, our results will present useful information because any intrinsic profiles can be concealed by this modified line profile.
4.2 Dependence of detectability of Ly emission on observed direction
Turning now to the dependence of detectability of Ly emissions from the first galaxies at redshift 10 on viewing angles, we find the following anisotropic effects of the H I halos. First, similar to the mean Ly line, the observed Ly line profile in each viewing angle becomes more diffuse in wavelength as decreases; this makes the apparent Ly line luminosity less luminous as decreases. Second, however, the dimming and diffusing rates of the Ly line depend on observed direction; the apparent Ly line luminosity falls most sharply in -direction, while it hardly decreases in the -direction as decreases.
The differences of the Ly line profile and of the apparent Ly line luminosity among viewing angles are understood by the dependence of the optical depth for Ly photon on propagative direction due to the anisotropic expansion of the H I halo. That is, because of the anisotropy in the expansion law of the H I halo, the optical depth is the largest for photons which propagate into the -direction, while it is the smallest for those which travel to the -direction. This means that escaping into -direction is the most difficult; it needs to experience more scattering events and to get larger cumulative wavelength redshift by scattering compared to that into -direction. Therefore, we conclude that the direction along the axis of the underlying CDM filament is the most profitable to detect the Ly emission lines of the first galaxies.
In any case, the observed Ly line profiles and the apparent Ly line luminosities of the first galaxies can be quite different from their intrinsic profiles and luminosities. This modified Ly line profile also needs to be fully understood in order to derive some physical quantities of the first galaxies, e.g., star formation rates (SFRs) and/or the escape fractions of the ionizing photons from their observed Ly line profiles (e.g., Miralda-Escudé, 1998; Cen & Haiman, 2000; Madau & Rees, 2000; Mesigner et al., 2004).
The flux density represented by equation (8) gives a characteristic value as following:
| (9) |
This typical value of , which corresponds to and the AB magnitude of 27.0 mag at , is about one order of magnitude brighter than the limiting flux of JWST for a point source at the North Ecliptic Pole111For more details, see http://www.stsci.edu/jwst/. However, as shown in figure 4, our results indicate that Ly emissions from the first galaxies are diffuse on the sky; their typical angular sizes are a function of and viewing angle, and range from to .
Evaluating S/N for the predicted Ly emission with an intrinsic Ly line luminosity of the source of by utilizing the JWST Mission Simulator (JMS)222JMS can be used at http://www.stsci.edu/jwst/science/jms/index.html, we find that the S/N for the source with is always smaller than 10 over a second exposure. Thus, it might be an observational challenge to detect the Ly emission against the very bright zodiacal light, even though it is at the North Ecliptic Pole and observed from the direction along the filament axis at the source. Furthermore, in the direction along the filament axis, there are expected to be clusters of galaxies. The presence of them at the foreground of the first galaxies might make the detection of the Ly emissions more difficult because it is very difficult to discriminate an object with low surface brightness against the one with higher surface brightness at the foreground of it.
However, these clusters of galaxies can boost the detectability of the background Ly emission by gravitational lensing. According to the recent successful observations of the high-redshift LAEs by gravitational lensing (Kneib et al., 1996; Ellis et al., 2001; Kneib et al., 2004; Pelló et al., 2004; Egami et al., 2005), high magnifications ( times) can be occurred. This high magnification is occurred only if the background source is in the so-called “critical regions”. Location of the region is precisely known for well-understood clusters and depends on a redshift range of the source (Kneib et al., 1996; Ellis et al., 2001). By using the singular isothermal sphere (SIS) lens model (e.g., Turner et al., 1984) with the Einstein ring radius of and Gaussian profiles as the surface brightness of the source, it is shown that the predicted Ly emission source can be magnified by a factor of . In this case, the resultant S/N reaches over a second exposure. Thus, we conclude that detection of the predicted Ly source at the redshift is feasible over this decade with the JWST.
4.3 Implications of detecting Ly emission from the first galaxies
We insist that the Ly line profiles of the sources at redshift are analogous with those of a source at redshift 10 presented in this paper. They almost coincide with each other in dimensionless frequency redshift space as shown in figure 6 of KK04. Therefore, in order to evaluate the Ly line luminosities of the source at redshift and the typical angular radius of it at the Ly line, it is sufficient to know the characteristic frequency redshift and the characteristic proper distance at each redshift given in KK04.
Furthermore, our results indicate that there is a correlation between the apparent Ly line luminosity of the first galaxies and the underlying CDM structures at the initial contraction stage. It is also shown that this correlation is further enhanced if the Ly source is observed by using a narrow-band filter targeting to a specific redshift as the recent observations do. If one of the first galaxies at redshift is detected, this correlation can give us useful information that the underlying CDM filament at the extremely early Universe (cosmological age is younger than Gyr) almost faces us, although degeneracy with the intrinsic Ly line luminosity of the galaxy remains.
Possibly, however, Ly sources at are too faint to be detected as single Ly emission sources, but rather the assembly of them can be detected as a diffuse background source at near-infrared wavelength. This may have already been detected as the cosmic near-infrared background (CNIB), reported by independent groups (Wright & Reese, 2000; Cambrésy et al., 2001; Matsumoto et al., 2004) and cannot be explained by normal galaxy populations (Totani et al., 2001). Thus, considered with our results, the CNIB may be useful to map the large scale structures at the formation epoch of the galaxies in the early Universe.
5 SUMMARY
We investigated a Ly line transfer problem in the anisotropically expanding H I halos surrounding the first galaxies which are the sources of Ly photons. Using the improved numerical code, we solved the problem with 10 times larger number of test photons than that of KK04, and examined how much the detectability of the first galaxies at Ly lines depends on viewing angles to them. We found that the observed profiles and the apparent luminosities of the Ly emission lines, and the typical angular sizes of the first galaxies at Ly line strongly depend on the inclination angle to the axis of the underlying CDM filament. These physical quantities of the predicted Ly emission lines of the first galaxies are compiled for various . The direction along the filament axis is found to be more profitable to detect the Ly emission than a direction perpendicular to the axis as the H I halo is more strongly decelerated against the cosmological Hubble expansion. In the perpendicular direction to the axis, because of the very broadened line profiles and the very diffuse surface brightness distributions, there seems to be little hope to detect the Ly emissions from the first galaxies with a typical Ly line luminosity of LAEs at redshift of . On the other hand, along the filament axis, there is expected to be clusters of galaxies as the sources of gravitational lensing. Based on our estimations by using a simple lens model and a simple surface brightness profile for the source, the high magnification with a factor of is expected to the predicted Ly emissions. We conclude that this high-magnification will allow us to detect the Ly emissions from the first galaxies in this decade with the S/N by JWST. Moreover, in order to know their physical quantities like the SFRs and the escape fractions of the ionizing radiation, it is essential to understand the relation between the predicted Ly emission line profile and the ratio of the apparent to the intrinsic Ly line luminosity.
References
- Abel et al. (1998) Abel, T., Annonis, P., Norman, M. L., & Zhang, Y. 1998, ApJ, 508, 518
- Ajiki et al. (2003) Ajiki, M. et al. 2003, AJ, 126, 2091
- Barkana & Loeb (2001) Barkana, R., & Loeb, A. 2001, Phys. Rep., 349, 125
- Becker et al. (2001) Becker, R. H. et al. 2001, AJ, 122, 2850
- Bertschinger (1998) Bertschinger, E. 1998, ARA&A, 36, 599
- Bond et al. (1996) Bond, J. R., Kofman, L., & Pogosyan, D. 1996, Nature, 380, 603
- Bremer et al. (2004) Bremer, M. N., Jensen, J. B., Lehnert, M. D., Schreiber, N. M. F., & Douglas, L. 2004, ApJ, 615, L1
- Bromm et al. (1999) Bromm, V., Coppi, P. S., & Larson, R. B. 1999, ApJ, 527, L5
- Cambrésy et al. (2001) Cambrésy, L., Reach, W. T., Beichman, C. A., & Jarrett, T. H. 2001, ApJ, 555, 563
- Cen & Haiman (2000) Cen, R., & Haiman, Z. 2000, ApJ, 542, L75
- Colberg et al. (2004) Colberg, J. M., Krughoff, K. S., & Connolly, A. J. 2005, MNRAS, 359, 272
- Cuby et al. (2003) Cuby, J.-G., Le Fèvre, O., McCracken, H., Cuillandre, J.-C., Magnier, E., & Meneux, B. 2003, A&A, 405, L19
- Egami et al. (2005) Egami, E. et al. 2005, ApJ, 618, L5
- Ellis et al. (2001) Ellis, R., Santos, M. R., Kneib, J.-P., & Kuijken, K. 2001, ApJ, 560, L119
- Fan et al. (2001) Fan, X. et al. 2001, AJ, 122, 2833
- Haiman (2002) Haiman, Z. 2002, ApJ, 576, L1
- Hayashino et al. (2004) Hayashino, T. et al. 2004, AJ, 128, 2073
- Hu et al. (2002) Hu, E. M. et al. 2002, ApJ, 568, L75
- Hu et al. (2004) Hu, E. M., Cowie, L. L., Capak, P., McMahon, R. G., Hayashino, T., & Komiyama, Y. 2004, AJ, 127, 563
- Kneib et al. (1996) Kneib, J.-P., Ellis, R. S., Smail, I., Couch, W. J., & Sharples, R. M. 1996, ApJ, 471, 643
- Kneib et al. (2004) Kneib, J.-P., Ellis, R. S., Santos, M. R., & Richard, J. 2004, ApJ, 607, 697
- Kobayashi & Kamaya (2004) Kobayashi, A.R., M., & Kamaya, H. 2004, ApJ, 600, 564 (KK04)
- Kodaira et al. (2003) Kodaira, K. et al. 2003, PASJ, 55, L17
- Kogut et al. (2003) Kogut, A. et al. 2003, ApJS, 148, 161
- Kurk et al. (2004) Kurk, J. D., Cimatti, A., di Serego Alighieri, S., Vernet, J., Daddi, E., Ferrara, A., & Ciardi, B. 2004, A&A, 422, L13
- Loeb & Rybicki (1999) Loeb, A., & Rybicki, G. B. 1999, ApJ, 524, 527
- Madau & Rees (2000) Madau, P., & Rees, M. J. 2000, ApJ, 542, L69
- Malhotra & Rhoads (2004) Malhotra, S., & Rhoads, J. E. 2004, ApJ, 617, L5
- Matsuda et al. (2004) Matsuda, Y. et al. 2004, AJ, 128, 569
- Matsumoto et al. (2004) Matsumoto, T. et al. 2005, ApJ, 626, 31
- Mesigner et al. (2004) Mesigner, A., Haiman, Z., & Cen, R. 2004, ApJ, 613, 23
- Miralda-Escudé (1998) Miralda-Escudé, J. 1998, ApJ, 501, 15
- Nagao et al. (2004) Nagao, T. et al. 2004, ApJ, 613, L9
- Partridge & Peebles (1967) Partridge, R. B., & Peebles, P. J. E. 1967, ApJ, 147, 868
- Pelló et al. (2004) Pelló, R., Schaerer, D., Richard, J., Le Borgne, J.-F., & Kneib, J.-P. 2004, A&A, 416, L35
- Rhoads et al. (2000) Rhoads, J. E., Malhotra, S., Dey, A., Stern, D., Spinrad, H., & Jannuzi, B. T. 2000, ApJ, 545, L85
- Rhoads et al. (2004) Rhoads, J. E. et al. 2004, ApJ, 611, 59
- Santos (2004) Santos, M. R. 2004, MNRAS, 349, 1137
- Santos et al. (2004) Santos, M. R., Ellis, R. S., Kneib, J.-P., Richard, J., & Kuijken, K. 2004, ApJ, 606, 683
- Shapley et al. (2003) Shapley, A. E., Steidel, C. C., Pettini, M., & Adelberger, K. L. 2003, ApJ, 588, 65
- Shioya et al. (2005) Shioya, Y. et al. 2005, PASJ, 57, 2726
- Spergel et al. (2003) Spergel, D. N. et al. 2003, ApJS, 148, 175
- Steidel et al. (2000) Steidel, C. C., Adelberger, K. L., Shapley, A. E., Pettini, M., Dickinson, M., & Giavalisco, M. 2000, ApJ, 532, 170
- Taniguchi et al. (2003) Taniguchi, Y. et al. 2003, JKAS, 36, 123
- Taniguchi et al. (2005) Taniguchi, Y. et al. 2005, PASJ, 57, 2649
- Totani et al. (2001) Totani, T., Yoshii, Y., Iwamuro, F., Maihara, T., & Motohara, K. 2001, ApJ, 550, L137
- Tran et al. (2004) Tran, K.-V. H., Lilly, S. J., Crampton, D., & Brodwin, M. 2004, ApJ, 612, L89
- Turner et al. (1984) Turner, E. L., Ostriker, J. P., & Gott, J. R. 1984, ApJ, 284, 1
- van Breukelen et al. (2005) van Breukelen, C., Jarvis, M. J., & Venemans, B. P. 2005, MNRAS, 359, 895
- Wang et al. (2005) Wang, J. X., Malhotra, S., & Rhoads, J. E. 2005, ApJ, 622, L77
- Weatherley et al. (2004) Weatherley, S. J., Warren, S. J., & Babbedge, T. S. R. 2004, A&A, 428, L29
- Wright & Reese (2000) Wright, E. L., & Reese, E. D. 2000, ApJ, 545, 43
- Yoshida et al. (2003) Yoshida, N., Abel, T., Hernquist, L., & Sugiyama, N. 2003, ApJ, 592, 645
- Yoshii (1993) Yoshii, Y. 1993, ApJ, 403, 552
| (µm)aa The wavelength at which predicted Ly line profiles have their peak values. | FWHM (Å) | Apparent Line Luminositiesbb The apparent Ly line luminosities obtained by integrating the observed Ly line profiles with wavelength in certain ranges and by multiplying the integrated value by a factor of . See the text for the integral intervals adopted in this paper. | |||||||
|---|---|---|---|---|---|---|---|---|---|
| cc The ratio of the FWHM of to that of . | |||||||||
| 1.0………………………………. | 1.339 | 1.339 | 52.7 | 52.7 | 1.0 | 0.98 | 0.70 | 0.70 | 1.0 |
| 0.9………………………………. | 1.339 | 1.340 | 68.3 | 72.0 | 1.1 | 0.97 | 0.71 | 0.62 | 1.1 |
| 0.7………………………………. | 1.340 | 1.342 | 84.8 | 115 | 1.4 | 0.96 | 0.71 | 0.42 | 1.7 |
| 0.5………………………………. | 1.342 | 1.347 | 118 | 213 | 1.8 | 0.95 | 0.66 | 0.18 | 3.7 |
| 0.3………………………………. | 1.346 | 1.363 | 190 | 506 | 2.7 | 0.92 | 0.46 | 0.01 | 43.6 |