A Survey of Analogs to Weak Mgii Absorbers in the Present 11affiliation: Based in part on observations obtained with the NASA/ESA Hubble Space Telescope, which is operated by the STScI for the Association of Universities for Research in Astronomy, Inc., under NASA contract NAS 5-26555.
Abstract
We present the results of a survey of the analogs of weak Mgii absorbers (rest–frame equivalent width Å) at . Our sample consisted of HST/STIS echelle quasar spectra () which covered Siii 1260 and Cii 1335 over this redshift range. Using those similar transitions as tracers of Mgii facilitates a much larger survey, covering a redshift pathlength of for an equivalent width limit of Mgii corresponding to Å, with completeness for the weakest lines. Correcting for incompleteness, we find the number of weak Mgii absorber analogs with Å to be for . This compares to a value of found by Churchill et al. (1999) for the higher redshift range, , and is consistent with cosmological evolution of the population. We consider the expected effect on observability of weak Mgii absorbers of the decreasing intensity of the extragalactic background radiation field from to . Assuming that all the objects that produce absorption at are stable on a cosmological timescale, and that no new objects are created, we would expect – at . About –% of this population would be decendants of the parsec–scale structures that produce single–cloud, weak Mgii absorbers at . The other –% would be lower density, kiloparsec–scale structures that produce Civ absorption, but not detectable low ionization absorption, at . We conclude that at least one, and perhaps some fraction of both, of these populations has evolved away since , in order to match the measured in our survey. This would follow naturally for a population of transient structures whose generation is related to star–forming processes, whose rate has decreased since .
1 INTRODUCTION
Quasar absorption line systems have been observed at redshifts . They provide detailed information about the chemical content, kinematics, and ionization state of a variety of gaseous structures ranging from galaxies to the diffuse interstellar medium. The population of weak Mgii absorbers [those with rest frame equivalent width Å] provides an opportunity to probe an otherwise elusive part of the network of structures. Rigby et al. (2002) suggested that they may be produced by an early population of star clusters or by supernovae ejecta (on large or small scales) relating to an abundant population of otherwise invisible galaxies. Regardless of their mechanism/s of origin, weak Mgii absorbers are likely to be important in a global picture of star formation, galaxy formation, and/or the interplay between galaxies and their surroundings.
Because of the practical consideration of simplicity of optical observations, most of our information about weak Mgii absorbers is for redshifts in the range . Churchill et al. (1999) conducted a comprehensive survey over this range, using high resolution spectrograph (HIRES; (Vogt, 1994)) on the Keck I telescope. They found a redshift path density of for weak Mgii absorbers with Å. Two thirds of these absorbers have single clouds, unresolved at a resolution of km s-1, while the others have multiple clouds spread over tens to hundreds of km s-1. Both statistically (Churchill et al., 1999; Rigby et al., 2002) and in individual cases (Churchill et al., 2000), it is found that weak Mgii systems arise in sub-Lyman limit systems [ (cm-2)]. In fact, they comprise a significant fraction, at least 25%, of Ly forest clouds in that column density range (Rigby et al., 2002).
The most surprising property of the single–cloud, weak Mgii absorbers is their high metallicities. The metallicity of the gas producing the Mgii absorption is usually constrained to be at least % solar when constraints are available (Rigby et al., 2002), but in several of the cases with the best constraints the values are solar or even supersolar (Charlton et al., 2003). This is surprising in view of the fact that luminous galaxies are rarely found within a kpc impact parameter of the quasar (Churchill et al., 1999). In some cases the ratio of Feii to Mgii precludes the possibility of –enhancement from Type II supernovae, and therefore metals seem to generated “in situ” rather than ejected from distant giant galaxies (Rigby et al., 2002). The observed redshift path density () of weak Mgii absorbers is twice that of the strong Mgii absorbers which are known to be associated with luminous galaxies [within kpc; (Steidel, 1995)] and which fully account for almost all of the cross–section such galaxies are expected to provide. We are thus drawn to the conclusion that as much of the sky is covered by significantly metal–enriched regions, that are not related to giant galaxies, as is covered by such galaxies.
Several other properties of the single–cloud, weak Mgii absorbers are relevant to an interpretation of their origins. From photoionization models, the thickness of the Mgii absorbing region is on the order of – pcs (Rigby et al., 2002; Charlton et al., 2003). Centered at the same velocity as the Mgii absorption is Civ absorption which is constrained to arise in a separate higher–ionization region. This constraint generally comes from a consideration of whether the ionization parameters consistent with the low ionization absorption can produce the observed Civ absorption. The two phase structure consists of a thin/small Mgii absorbing region (with density cm-3) and a larger (hundreds of pcs to a couple kpcs), lower density region that produces Civ absorption. The geometries of, and relationship between, these regions is uncertain, but flattened geometries are generally more consistent with number statistics and kinematics of the absorbers (Milutinović et al., 2005).
There are a number of such indirect clues as to the nature of weak Mgii absorbers, but not yet any definite answers. Obviously, the situation would be simplified if a direct connection was found between the absorber and a nearby, luminous structure. Such structures might be dwarf galaxies, star–forming regions in intergalactic cold dark matter filaments, or intergalactic star clusters of some sort. If such objects are to be detected, they must be at low redshift. Several absorbers have been detected at that, although Mgii is not covered in existing spectra, are almost certainly analogs to the weak Mgii absorber population at . In the case of the absorber toward C , there is a post–starbursting dwarf galaxy within kpc of the line–of–sight, which leads Stocke et al. (2004) to the conclusion that winds from that dwarf are responsible for the absorption. A similar situation has been suggested to apply in the case of the absorber toward PKS (Chen et al., 2000). It is difficult, however, to be sure that a nearby galaxy is, in fact, itself responsible for such absorption, rather than a less luminous object in the same group or cluster. Also, it may be important to make a distinction between single and multiple–cloud weak Mgii absorbers which may have different origins (Zonak et al., 2004; Ding et al., 2003b). Finding a larger sample of weak Mgii absorber analogs was one of the motivations for this work. We report on our systematic survey of the archive of Space Telescope Imaging Spectrograph (STIS)/ Hubble Space Telescope (HST) observations of quasars.
Our survey facilitates a formal calculation of the redshift path density of weak Mgii absorber analogs at . This number can be compared with the value at to consider the evolution of the population of objects that produce weak Mgii absorption. Based upon their properties, it is not clear that these objects should be stable. Their two phases of gas are not in pressure balance (Rigby et al., 2002; Charlton et al., 2003) and a large amount of invisible matter (baryonic or dark) would be needed to attain gravitational stability (Schaye, 2001). If we are studying the evolution of a transient population, we are learning about the evolution of the processes that created the absorbing structures. On the other hand, for a population of star clusters formed at very high redshift, we would expect a stable population of weak Mgii absorbers that followed cosmological evolution governed by a changing extragalactic background radiation.
This paper begins with a description of the HST/STIS echelle data that were used for our survey. We describe how we are able to survey a significant pathlength by using the similar Siii 1260 and Cii 1335 transitions as tracers of Mgii . In § 3.1 we first discuss the individual systems found in our survey, describing their properties and the results of previous studies of them by other investigators. We then present in § 3.2 a formal calculation of the redshift number density, , correcting for our survey completeness. The expected evolution of the population of weak Mgii absorbers, taking into account the changing extragalactic background radiation is estimated in § 4, and compared to the observed value. In § 5 the consequences of this for stability of the structures that give rise to weak Mgii absorption and for the nature of the processes that produce these structures are considered. The final section (§ LABEL:sec:6) contains a brief summary and conclusions.
2 SURVEY AND DATA ANALYSIS
In order to detect weak, metal–line features and to cover most of the key transitions including the Lyman series lines from potential absorbers at , high resolution spectra in the UV are required. The archived echelle spectra from HST/STIS were used for our survey.
2.1 STIS Echelle Spectra
A direct search for Mgii at would rely on spectra obtained with the E230M grating. As of July 2004, there were about spectra available that covered Å to Å, the reddest coverage with this grating. Unfortunately, each spectrum would only offer a limited redshift coverage of . Therefore, the maximum cumulative path length for the interval is then approximately , and this assumes the whole path length exceeds the required equivalent width limit. We would expect a maximum of three weak Mgii absorbers in this pathlength if as at . Furthermore, the E230M spectra are quite noisy in the redward regions that would be relevant to our survey. This led us to consider and adopt an indirect approach, using Siii 1260 and Cii 1335 as tracers of weak Mgii absorbers in the E140M spectra.
The E140M echelle grating of STIS has a resolving power of (corresponding to km s-1) and simultaneous wavelength coverage from to Å. For our survey we searched spectra of quasars from the STIS archive that were available before July 2004. To allow detection of weak metal lines, our search was limited to spectra which have per pixel over a large fraction of the wavelength coverage. Table 1 lists the quasar lines of sight that we searched, with quasar redshifts and some specifics of the HST/STIS observations. The Mgii doublet is not covered for in the many high–quality E140M echelle spectra available in the archive. To circumvent this limitation we instead used two other ions, Siii and Cii, to trace low ionization absorption. The 1260 Å transition of Siii and the 1335 Å transition of Cii are moderately strong in absorption and they conveniently fall within the wavelength regime of the available E140M data set for redshift . The maximum possible cumulative path length for our survey would then be , a factor of times larger than a direct Mgii survey using E230M spectra.
The E140M spectra used for our survey were obtained for a variety of reasons, and some of these reasons could introduce a bias in our survey. For example, a line of sight observed in order to study particular strong Ly forest absorbers (which were already known to be metal line systems) could easily be biased toward having a weak Mgii absorber analog. A line of sight observed for a high velocity cloud study, however, would have no bias for presence or absence of weak Mgii absorber analogs. We list in Table 1 the PI of the program to observe each quasar and the program ID to aid in consideration of this issue, which we discuss again in § 3.2.
The reduction and calibration of the E140M spectra were performed using the standard STIS pipeline (Brown et al., 2002). Combination of separate exposures employed weighting by exposure time. Similarly, overlapping orders were combined with equal weight. Weighting by inverse variance (as employed, e.g., by Tripp et al. (2001)) was considered, but was found to bias the flux downward due to the lower variance of pixels with smaller counts. Even smoothing over several pixels would not eliminate this effect in cases where individual exposures have .
For some quasars that were observed at times separated by months or years, there was often a small shift in the echelle angle, and thus a change in the wavelength corresponding to a given pixel. In this case we selected one scale and combined the others by choosing the nearest pixel, rather than interpolation which would lead to smoothing. The drawback to the procedure we employed is a small, effective decrease in resolution. The continuum fit was performed interactively using the IRAF SFIT task, and employing standard methods as described in Sembach & Savage (1992)
2.2 Survey Method
To facilitate comparison to the intermediate redshift survey of Churchill et al. (1999), we estimate the rest–frame equivalent width that a weak Siii 1260 and Cii 1335 absorption feature would have, corresponding to the equivalent width threshold value of 0.3 Å for Mgii 2796. Given the fact that the ionization potentials of Mg, Si and C are similar, the relative equivalent widths of Siii, Cii and Mgii in any system would be largely governed by abundance pattern and by the oscillator strength of individual electronic transitions for each atom or ion. The lack of broad spectral coverage at high resolving power limits the number of weak systems for which the equivalent widths of Siii 1260, Cii 1335, and Mgii 2796 are measured. However, the three single–cloud weak Mgii absorbers found in the spectra of PG have all three absorption transitions covered and detected (Charlton et al., 2003). The Siii 1260 is a blended feature in one of the three absorption systems () and hence only an upper limit could be established for that particular line. The ratio is for the system and for the system. Similarly the ratios of are 1.450.32 (), (), and (). Based on these known values, we used the average values of for the Siii/Mgii ratio and for Cii/Mgii. These values are also representative of those for isolated components of strong Mgii absorbers (Ding et al., 2003, 2003b, 2005). In summary, a metal–line absorber in our survey is classified as if the rest–frame equivalent width Å and Å. Similarly, a detection limit of Å in Mgii 2796 (as used by Churchill et al. (1999)) corresponds to Å in Siii 1260 and Å in Cii 1335.
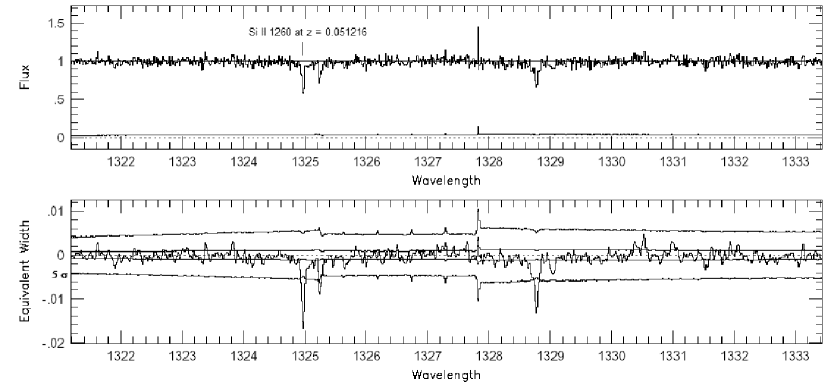
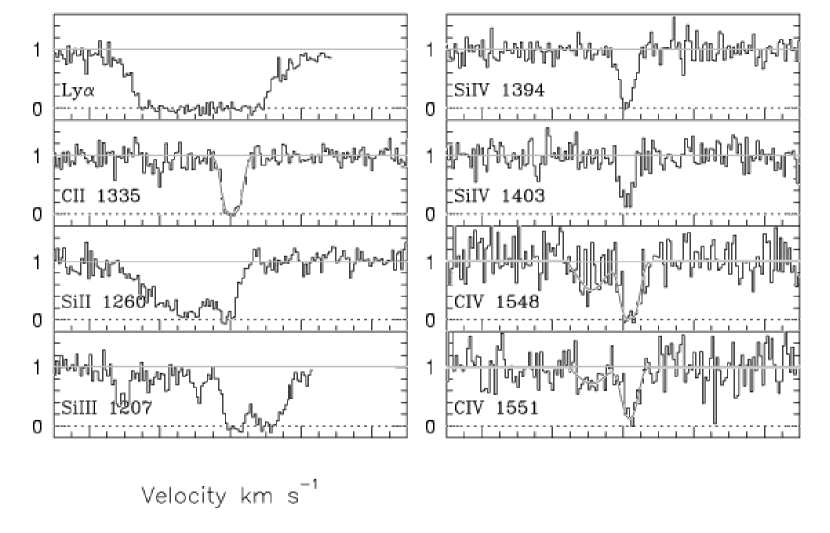
To detect weak, low ionization systems we first identified all absorption features detected at greater than significance, as illustrated in Figure 1. Assuming each identified feature as a redshifted Siii 1260 transition, we searched for a 5 detection at the expected location of Cii 1335. The equivalent width limits for an unresolved line centered at each pixel were measured, taking into account the instrumental spread function, following the formalism of Steidel & Sargent (1992). In the event that both Siii 1260 and Cii 1335 were detected at a significance level of 5, we then searched for absorption in neutral hydrogen, through Ly and Ly transitions at the derived redshift, in order to confirm the detection. In the absence of spectral coverage of both these Lyman series features, we visually inspected the alignment and profile shapes of the low ionization features of Siii and Cii.
3 RESULTS FROM SURVEY
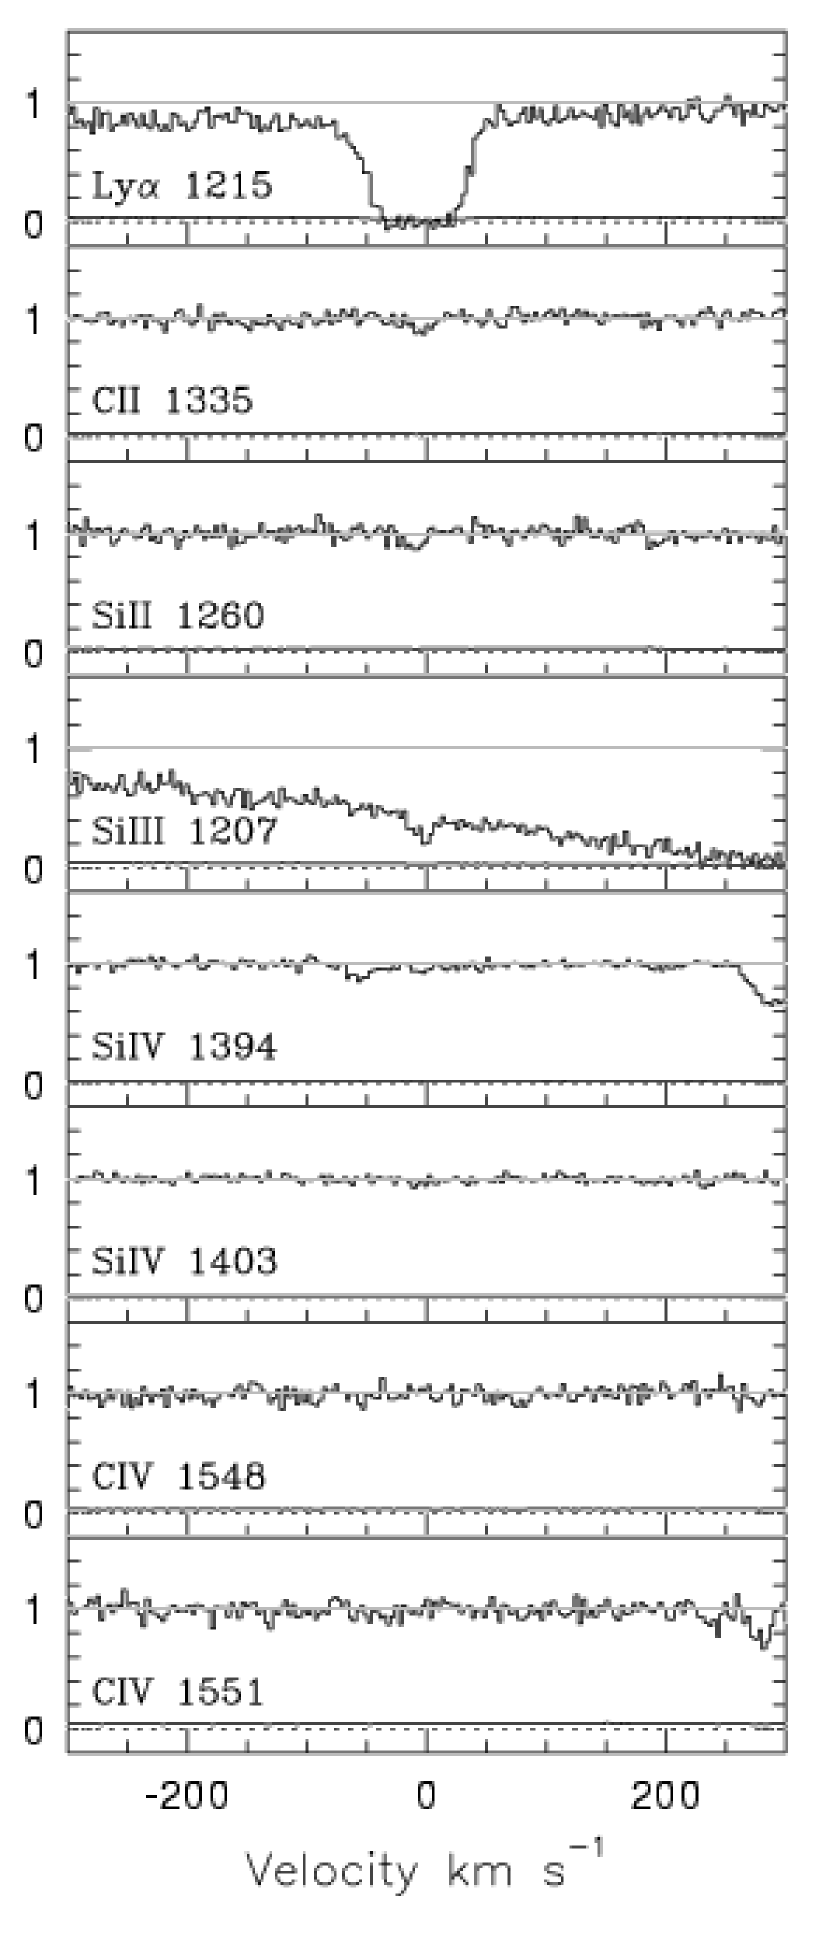
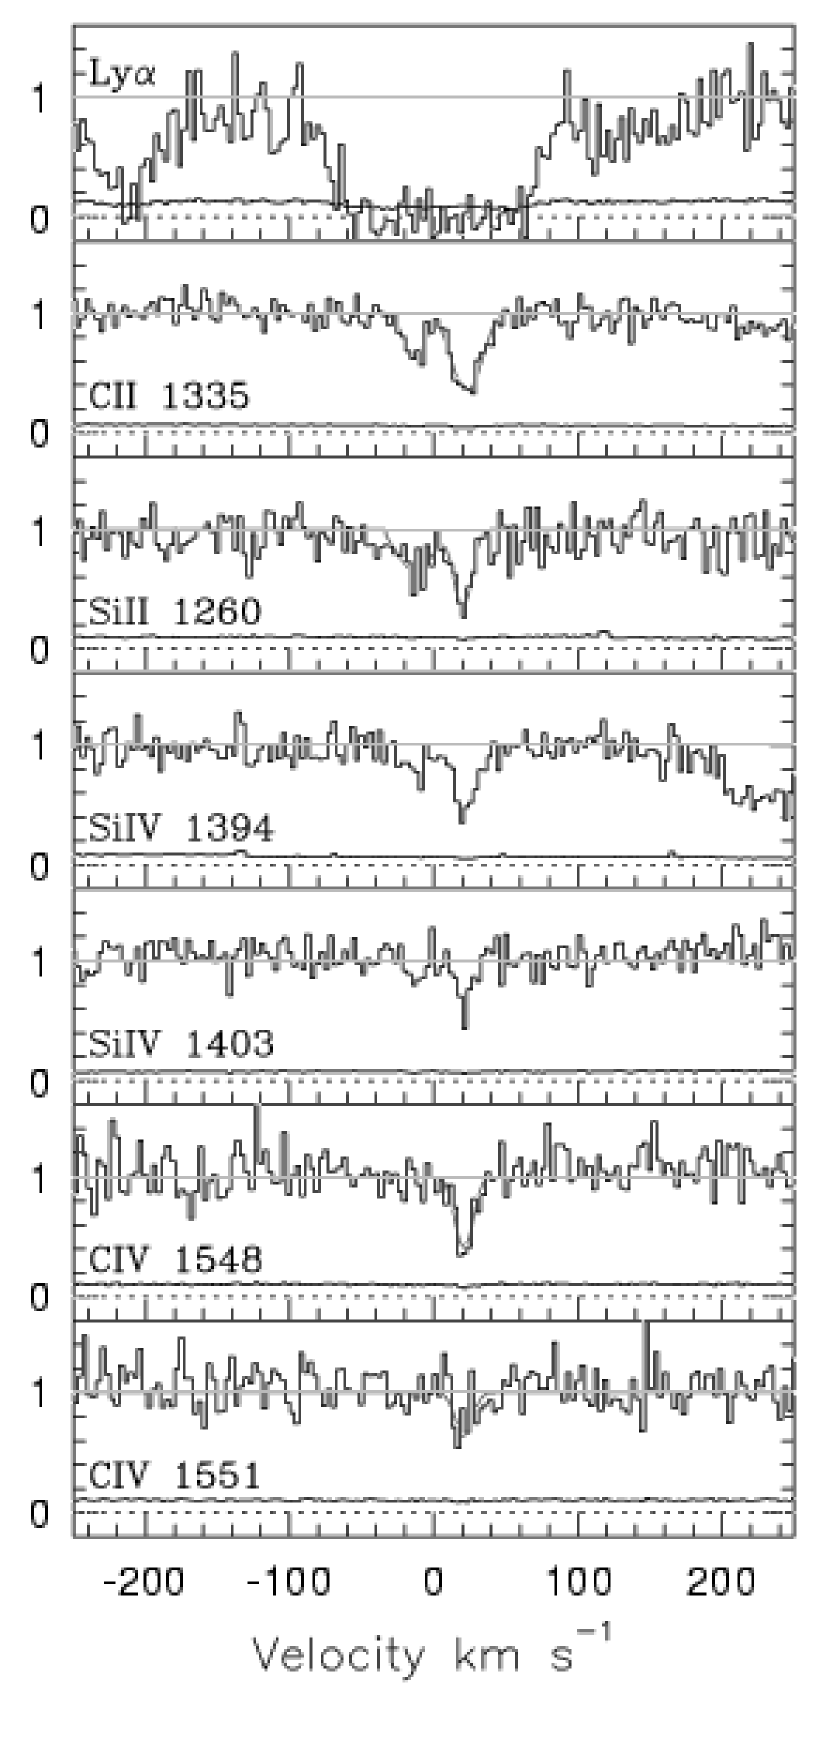
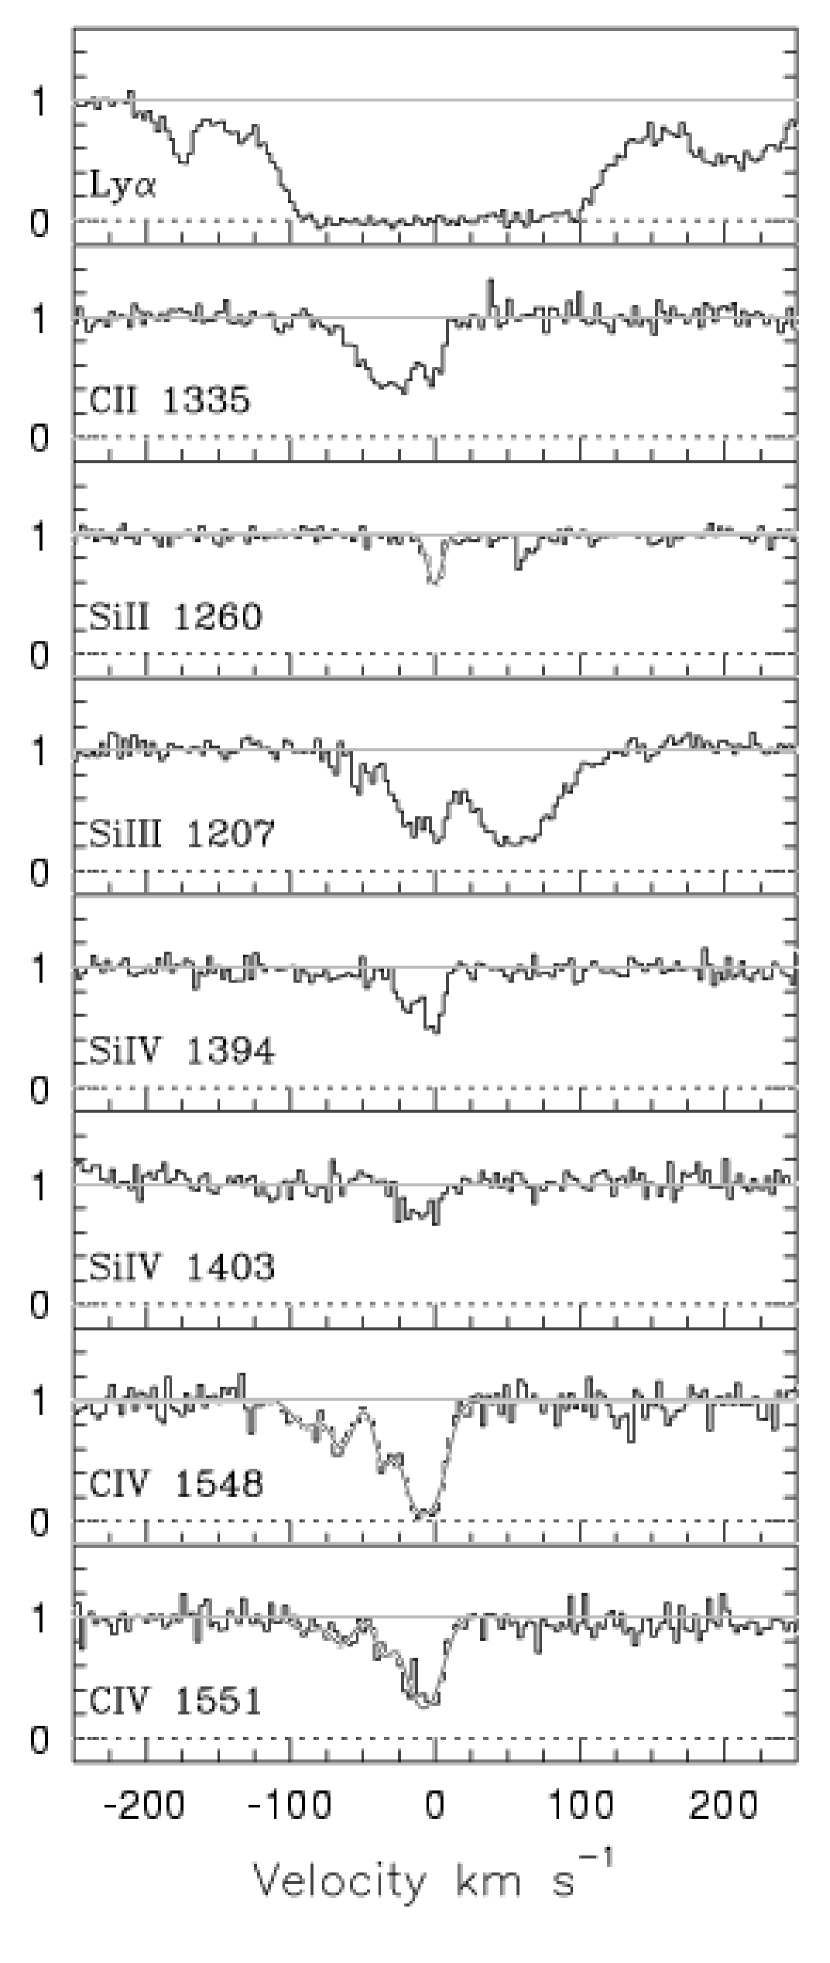
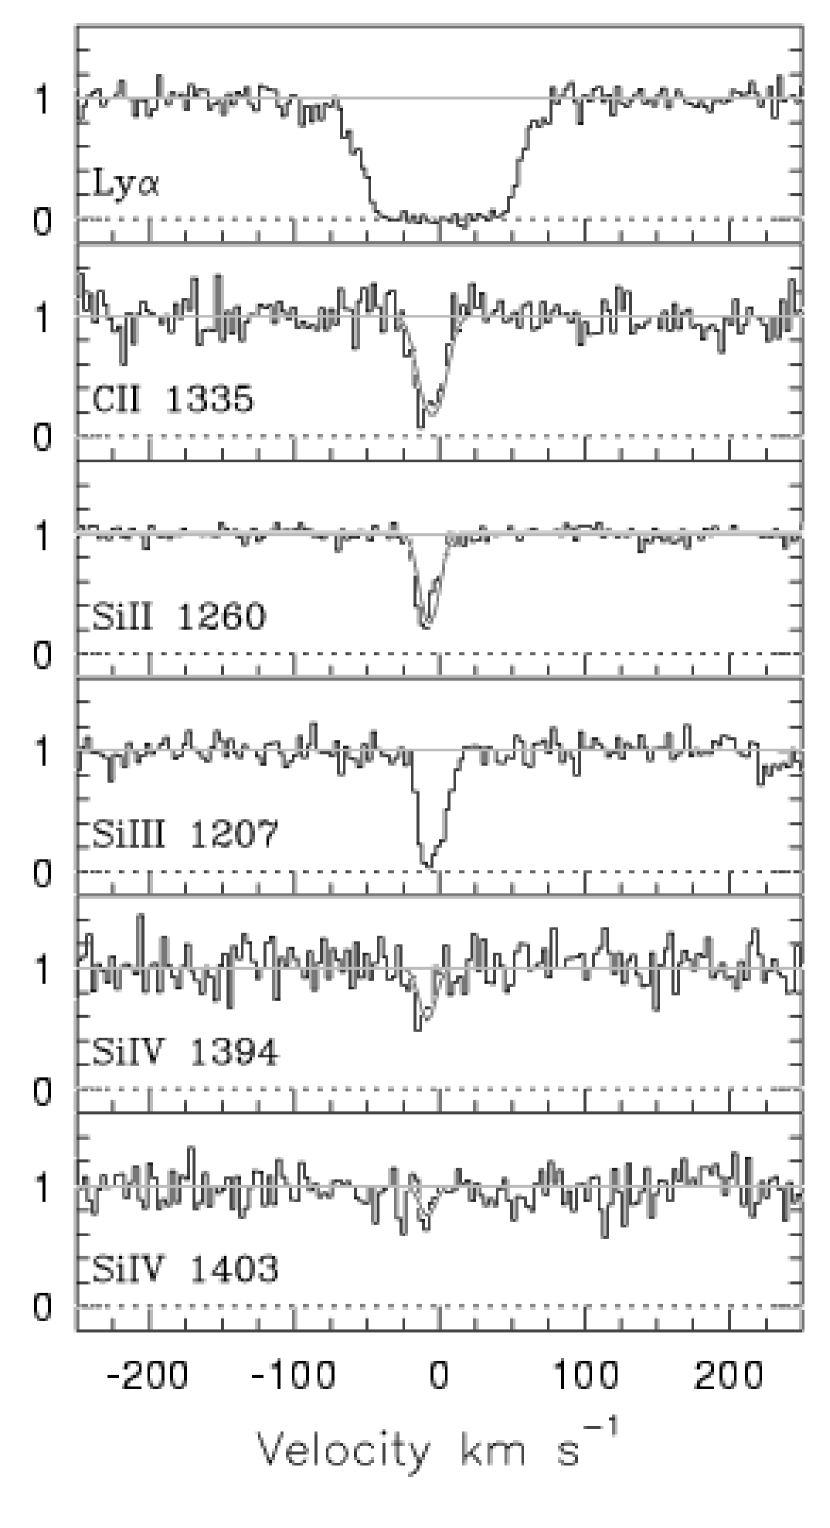
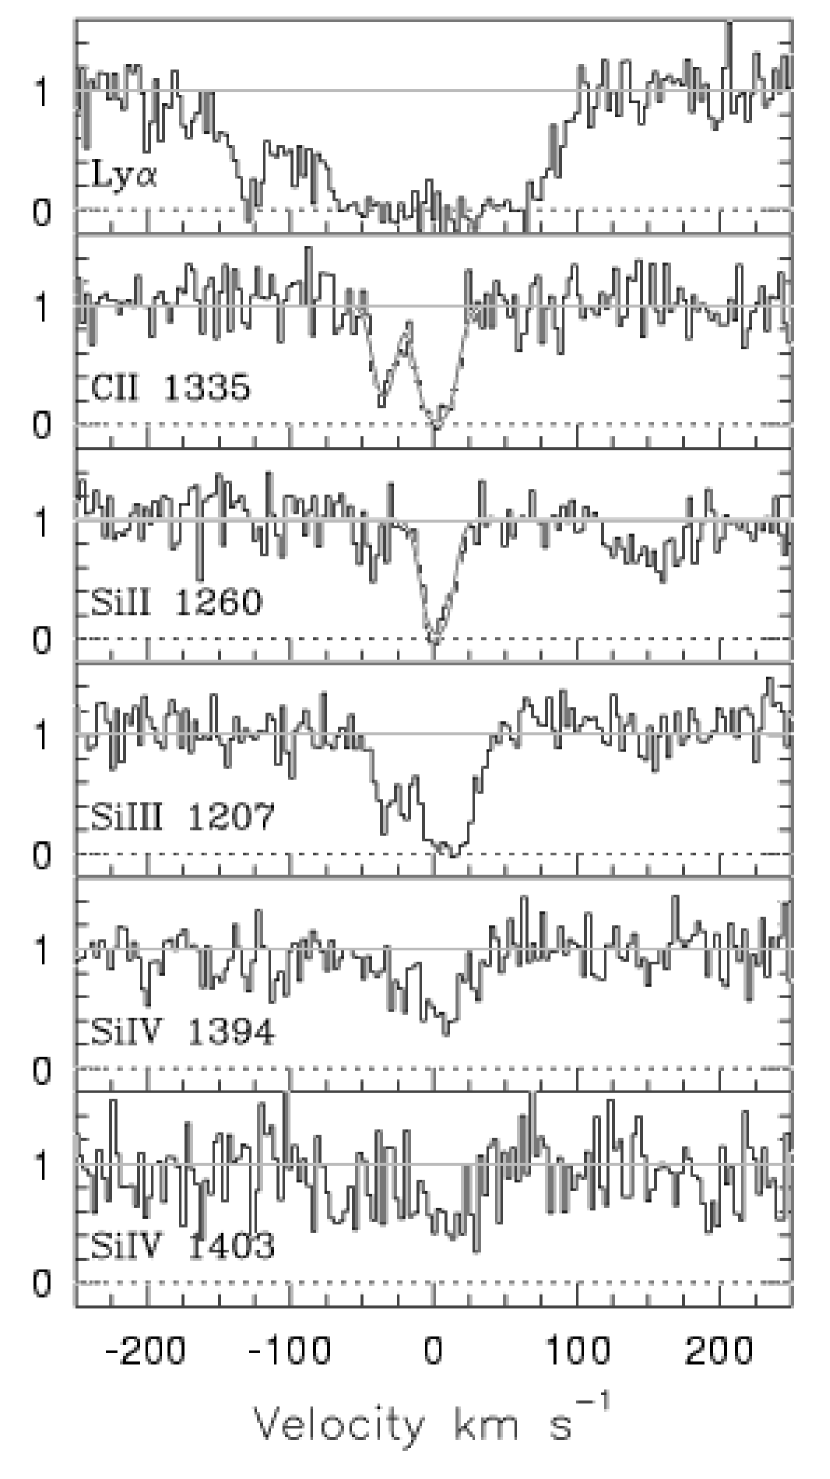
For the quasar lines of sight, we found six weak Mgii analog absorbers in a redshift pathlength of 5.3 within the redshift interval of 0 0.3. Of these, two have multiple clouds (resolved low ionization spectral features offset in velocity space) and the other four can be fit as single–cloud, low ionization absorbers. The key transitions covered in the STIS spectra are illustrated for the six systems in Figures 2–7, and the equivalent widths and equivalent width limits for these transitions are listed in Table 2. For selected transitions, the column densities and Doppler parameters derived by performing Voigt profile fitting are listed in Table 3.
3.1 Discussion of Individual Systems
3.1.1 3C 273,
This system is the weakest, low ionization system that we detected in the STIS E140M archive. It is also the nearest extragalactic metal line system known so far. With Å, it falls below the completeness limit of our survey (see § 3.2). This system is unusual for a weak Mgii absorber analog, in that Civ 1548 is not detected to a limit of Å. In a FUSE spectrum, Sembach et al. (2001) detect Ly and six other Lyman series lines and use these to derive , and possibly detect Ovi at a level. Tripp et al. (2002) combine that information from the FUSE spectrum with the STIS E140M spectrum, and derive physical conditions of the absorber. The low ionization gas is found to arise in a surprisingly thin cloud ( pc), consistent with sizes derived for some intermediate redshift single–cloud, weak Mgii absorbers (Charlton et al., 2003). The derived metallicity of is, however, somewhat lower than that derived for many intermediate redshift counterparts (Charlton et al., 2003; Rigby et al., 2002). The absorber is thought to be in the outskirts of the nearby Virgo cluster. Specifically, Stocke et al. (2004) find a dwarf, post–starburst galaxy, which is part of the Virgo cluster, at coincident velocity at an impact parameter of kpc from the line of sight, and use this to support the idea that winds from that galaxy are responsible for the absorption.
3.1.2 RX J,
This system is clearly a multiple–cloud, weak Mgii absorber analog, with two components resolved in Siii 1260 and Cii 1335. The Civ absorption follows the same kinematics, and is relatively weak compared to the low ionization absorption. The Siiv doublet is also detected. Using the ratios of these absorption features, Rosenberg et al. (2003) determined that a single phase, photoionized medium is consistent with the data, providing a simultaneous fit to transitions of various ionization. It should be noted, however, that an additional higher density phase is not excluded by the data. This quasar offers a different line–of–sight through the outskirts of the Virgo cluster as it only kpc (less than 1o in the sky) from the 3C 273 line of sight. This absorber is also part of the cluster environment at a coincident velocity with the absorber discussed previously, at along that line of sight. The large line–of–sight thickness of kpc that resulted from this relatively highly ionized cloud () is in contrast to the small size of pc derived for the 3C 273 absorber (Tripp et al., 2002). This led Rosenberg et al. (2003) to suggest that a large filamentary structure, perhaps related to a wind, connects the two lines of sight. This line of sight was selected for observation because of its proximity to toward the Virgo cluster. Because of its special location there could be a bias introduced to our survey (most likely a positive one), but no specific absorption system was known to exist in advance of the observation.
3.1.3 PG ,
The absorber is a single–cloud, weak Mgii system analog. The Cii 1335 absorption profile is blended with Galactic Siiv 1403. The blend is confirmed by the detection of Siiv 1394 at . The Civ and Siiv resonant doublets for the absorber are covered and detected in the spectrum and are likely to be produced by a separate high ionization phase of the absorber. Multiple components are clearly detected in Civ, extending blueward of the strongest component. Stocke et al. (2004) have previously reported the presence of this metal line absorber. Although current imaging surveys are below the sensitivity limit to detect a dwarf galaxy () at the redshift of the absorber, a more luminous galaxy was found at a projected distance of kpc from the line of sight at a comparable recession velocity (Stocke et al. (2004), Tumlinson et al. (2005)). Since the PG line of sight was observed in order to study two strong Ly forest absorbers that were known to have Siiii absorption, it was quite likely to have a weak Mgii absorber analog.
3.1.4 PHL ,
We classify this system as a single–cloud, weak Mgii absorber analog, and the strength is directly confirmed by detection of Mgii with Å in a low resolution, G230 spectrum from STIS (Jenkins et al., 2003). In the E140M spectrum, the Siii 1260 and Cii 1335 transitions are saturated, but can be consistently fit with a single component. Both Siii 1260 and Siiii 1206 are blended, possibly with Ly absorption from metal–poor regions at redshifts and , respectively. There is Civ centered at the same velocity of the low ionization component, and an offset component at km s-1 is also possibly detected in a noisy region of spectrum. The Ly is also asymmetric relative to the low ionization gas, with additional absorption to the blue. This system has been studied by Jenkins et al. (2003), using a FUSE spectrum and G140L and G230L spectra from STIS. In the FUSE spectrum, Ovi is detected, and the Lyman series lines and Lyman limit break indicates that this is a Lyman limit system, with (Jenkins et al., 2003). This is noteworthy, since most weak Mgii systems at do not produce Lyman limit breaks. There is an galaxy consistent with the redshift of the absorber at an impact parameter of kpc (Jenkins et al., 2003). Thus it appears this may be an absorber similar to a strong Mgii absorber, which might tend to produce weak low ionization absorption because of a relatively high impact parameter. Since this line of sight was observed in order to study the same particular system that we have found in our survey, it clearly was biased.
3.1.5 PG ,
By our fitting procedure, this system is a single–cloud, weak Mgii analog absorber. A possible second component did not significantly improve (by an “F-test”) a simultaneous fit to the Siii 1260 and Siii 1193 lines or a fit to the Cii 1335 line. However, Sembach et al. (2004) do claim a second component is needed to fit the low ionization lines, and this is certainly a possibility especially in view of the similarity of their line profiles. In this case, the system is a multiple–cloud, weak Mgii absorber with a very weak offset component close in velocity to the primary.
The Civ doublet is not covered in the STIS E140 spectrum. However Civ 1548 is just detected, with Å in a low resolution FOS/HST spectrum. This system is discussed in depth by Sembach et al. (2004), who combine information from this STIS spectrum with that from a high–quality FUSE spectrum. The Lyman series lines, a weak partial Lyman limit break, various low and intermediate ionization lines, Nv 1239, and Ovi 1032 were detected in the FUSE spectrum. Sembach et al. (2004) noted that this absorber had a particularly high ratio of Hi to Ovi, which they took as evidence for its multiphase/multi–temperature nature. No specific galaxy has been identified with this absorber, but there is an excess of galaxies at this redshift indicating a possible galaxy group (Sembach et al., 2004; Tripp et al., 1998). This line of sight was proposed for observation in order to study a Milky Way high velocity cloud, so it is not biased for the purpose of our survey.
3.1.6 PKS ,
This system is a multiple cloud weak Mgii analog with two distinct clouds separated by km s-1. The E140M spectrum does not provide coverage of Civ . It is however detected in a FOS/HST spectrum, with Å (Jannuzi et al., 1998). Higher ionization transitions, Ovi and Nv, are also detected in the STIS spectrum, clearly indicating multiphase conditions (Chen et al., 2000). The Hi for this system is detected in the STIS spectrum through Ly and Ly features. Based on the derived column density of neutral hydrogen ( cm-2), the system is classified as a partial Lyman limit system (Chen et al., 2000). Spinrad et al. (1993) report the presence of a spiral (LK = 0.02 L) and a luminous elliptical galaxy (LK = 1.12 L) at the absorber’s redshift, at impact parameters of 63 and 75 kpc. The elliptical galaxy has spectroscopic signature of a recent star burst event (Spinrad et al. 1993). Chen et al. (2000) infer a metallicity greater than % solar, with at least a solar value being most likely. Based on these facts, they suggest weak Mgii analog absorber is created by heavier elements transported from the elliptical galaxy by the star burst activity. This line of sight is only weakly biased for the purpose of our survey due to its proximity to Virgo. The original observation was for the purpose of Ly forest studies, but no specific metal-line systems were targetted.
3.2 Survey Completeness & Redshift Number Density
The completeness of the survey as a function of redshift was calculated by using the formalism given by Steidel & Sargent (1992) and Lanzetta et al. (1987). The cumulative redshift path length covered by the survey of quasars over the redshift range, is given by
| (1) |
where (Wr,,) is the function that gives the number of sight lines along which Siii 1260 and Cii 1335, at redshift and with rest–frame equivalent width greater than or equal to Wr in Siii 1260, could have been detected at a 5 level. We define as the expected ratio of the equivalent–widths of Cii 1335 and Siii 1260. As discussed in section § 2.2, we adopt based on empirical results. Table 2 lists the values of cumulative redshift path length over which the individual systems that we found in our survey could have been detected, and Figure 8 presents the completeness as a function of . Our survey is complete for an equivalent width threshold of Å (), corresponding to Å. For comparison, the Churchill et al. (1999) survey at was complete at Å. Although, our survey is less complete than Churchill et al. (1999) at small equivalent widths, we note that it is quite complete for an equivalent width threshold of Å, and that we are nevertheless correcting for incompleteness. Below we consider the effects of eliminating quasars with low spectra from the sample.
The number of absorbers per unit redshift () was calculated as the sum of the reciprocal of the cumulative redshift path lengths, using the formalism given in Lanzetta et al. (1987):
| (2) |
and the variance in is given by
| (3) |
To facilitate comparison with the Churchill et al. (1999) estimation of at , the rest–frame equivalent width upper and lower limits for Siii 1260 were chosen to be Å and Å, respectively. Over the redshift range of five systems were detected for the equivalent–width ranges of Å and Å, and the redshift number density was found to be .
The system at along the line of sight towards 3C 273 was excluded while computing the redshift path length , since the Siii 1260 was only detected at a level, and the rest–frame equivalent width of its Siii 1260 was only Å, less than the equivalent width lower limit of Å.
Figure 9 is a plot of versus redshift for the equivalent width threshold range corresponding to Å, with our point included along with higher redshift values from Churchill et al. (1999). The curves represent the no-evolution expectations for a CDM universe (=0.3 and =0.7; solid curve), a critical universe with deceleration parameter (dashed curve), and an open universe with (dotted curve), all normalized to at . The redshift dependence of the number density of absorbers is consistent with no evolution.
3.3 Possible Systematics and Biases of
Two potentially important parameters that could affect our observed value are the ratios and . As we described in § 2.2, we estimate the typical values of these ratios based upon the several weak Mgii absorbers for which all three transitions were covered in a spectrum. There is a spread of values, and even the mean is not well determined. However, our method for determining and the particulars of our dataset imply that the value we would obtain for is not sensitive to the choice of the equivalent ratios, within their possible range.
More specifically, only if the ratio was taken to be greater than would the system toward PG (see Table 2) be excluded from our survey. In this unlikely case, there would only be four terms included in our calculation using the reciprocals of cumulative path lengths and the result would be , not very different from our actual value.
Similarly, only if both and were less than , would the system toward 3C 273 be included in the summation. Based on experience with both strong and weak Mgii systems, it seems unlikely that Siii would be so weak compared to Mgii. Nonetheless, if we compute including the 3C 273 system, we obtain . The large error value is due to the large incompleteness (%) of the survey for systems as weak as that one.
We adopted the lower limit of Å for our survey to facilitate comparison to Churchill et al. (1999). However, we noted above that the survey is only complete at that limit. We don’t expect any biases due to this incompleteness, and the formal error in our calculated appropriately includes the uncertainty. Also, for the weakest system actually included in our survey (as opposed to the weakest that could have been found), the completeness was 73% so that the correction calculated by equation (2) was relatively small. Nonetheless, we have done the experiment of eliminating the noisiest spectra and recomputing for the remaining 10 quasars. With these spectra our completeness at Å is %. For this reduced sample, we estimate . This is not different than our value from the full sample of quasars, thus we adopt that value, with its smaller error, for further discussion.
As discussed for each of the individual weak Mgii absorber analogs in our sample in § 3.1, this survey is biased because some lines of sight were observed because of known absorbers that were likely to fall in this category. To first order, the bias is likely to yield a larger value than an unbiased survey. Indeed, all of the weak Mgii absorber analogs that we detected in this survey had already been studied by other authors. Because of this, we can consider the number an upper limit. The correct value could be somewhat lower. However, we should note that there are quasars in the sample that would appear to have a similar level of positive bias that do not have detected weak Mgii absorber analogs. We do not think this systematic bias is large, and, as it turns out, even a factor of reduction in the value would not affect our basic conclusions.
After considering these possible systematics and biases, we expect that our observed value of for Å at is an accurate representation of the true value. Systematics due to assumptions about the relationship between the Siii, Cii, and Mgii are unlikely to be large. The largest inaccuracy is judged to be a possible bias in quasars selected for STIS observations toward the detection of weak Mgii absorbers.
4 EXPECTED EVOLUTION OF ABSORBERS DUE TO CHANGING EXTRAGALACTIC BACKGROUND RADIATION
The population of structures that produce weak Mgii absorption could be different at different redshifts due to a variety of factors. The process of hierarchical structure growth and merging will lead to a change in the distribution of the total hydrogen column density in the universe. The metallicity of the universe will gradually increase and supernovae and their cumulative effects, superbubbles and superwinds, will redistribute gas. Finally, the ionization state of the absorbers will change due to the evolution of the ionizing extragalactic background radiation (EBR). Due to the latter effect, even a stable object with an unchanging total density distribution will be observed to have different absorption properties at different redshifts.
The EBR is known to change with redshift, because of declining space density of bright quasars and star forming galaxies from 2 0 (Haardt & Madau, 1996, 2001). Therefore a population of weak Mgii absorber structures in the present epoch is expected to have different ionization properties and phase structures compared to the absorber population detected at higher redshifts. We consider, through examples, and statistically, the expected changes to the populations of structures that exist at as they evolve to the current epoch. This lends insight into the nature of the population of weak Mgii absorbers that is observed in the present.
4.1 Changes to Phase Structure of Weak Mgii Absorbers
The Haardt & Madau (2001) spectrum defines the mean specific intensity of the radiation field as a function of energy and redshift. It is generated based on measurements of the QSO luminosity function and the observed Ly cloud population which absorbs the EBR. The Haardt and Madau formalism also offers provision for adding photons from star forming galaxies using stellar spectral energy distributions from Bruzual & Charlot (1993). We adopt a QSO plus star forming galaxy model with a % escape fraction for our calculations, but also consider a “QSO–only” model as the opposite extreme. For both models, we include the effect of absorption by the inter–galactic medium (using observed parameters as described in Haardt & Madau (1996) and Haardt & Madau (2001)). The predictable nature of the EBR allows us to hypothesize specifically how the phase structure of the weak Mgii absorber population at would change under the influence of a less intense metagalactic flux in the present epoch. Qualitatively, the decreasing intensity of the EBR should lead to an increase in the ratio of low to high ionization states of an atom (e.g., Siii/Siiv and Cii/Civ) for a gaseous metal–line absorber. A larger contribution to the EBR by star forming galaxies will, in general, lead to a lower ionization state due to the relative absence of high energy photons. However, none of our conclusions below are significantly altered by varying assumptions about escape fraction from star forming galaxies or about absorption by the Ly forest, as we will mention when relevant.
4.2 Analysis of Evolution using Sample Weak Mgii Systems
Photoionization calculations using Cloudy (Ferland, 2001) have yielded estimates of densities, metallicities and temperatures in the low and high ionization phases of weak Mgii gas clouds at (Rigby et al., 2002; Charlton et al., 2003; Ding et al., 2005). Almost all of the weak Mgii absorbers for which information is available have been demonstrated to have a multi–phase structure. The low ionization phase has a higher density and a smaller thickness/size than the high ionization phase. To guide our thinking on the evolution of weak Mgii absorbers we considered the expected evolution of three specific single cloud weak Mgii absorbers at redshifts of , , and along the line of sight to the quasar PG 1634+704 (Charlton et al., 2003). These three absorbers appear to have phase structures that are typical of other weak Mgii systems that were found at intermediate redshifts (Rigby et al., 2002), and can hence be treated as representatives of the absorber population. For detailed photoionization models for the three systems, see Charlton et al. (2003).
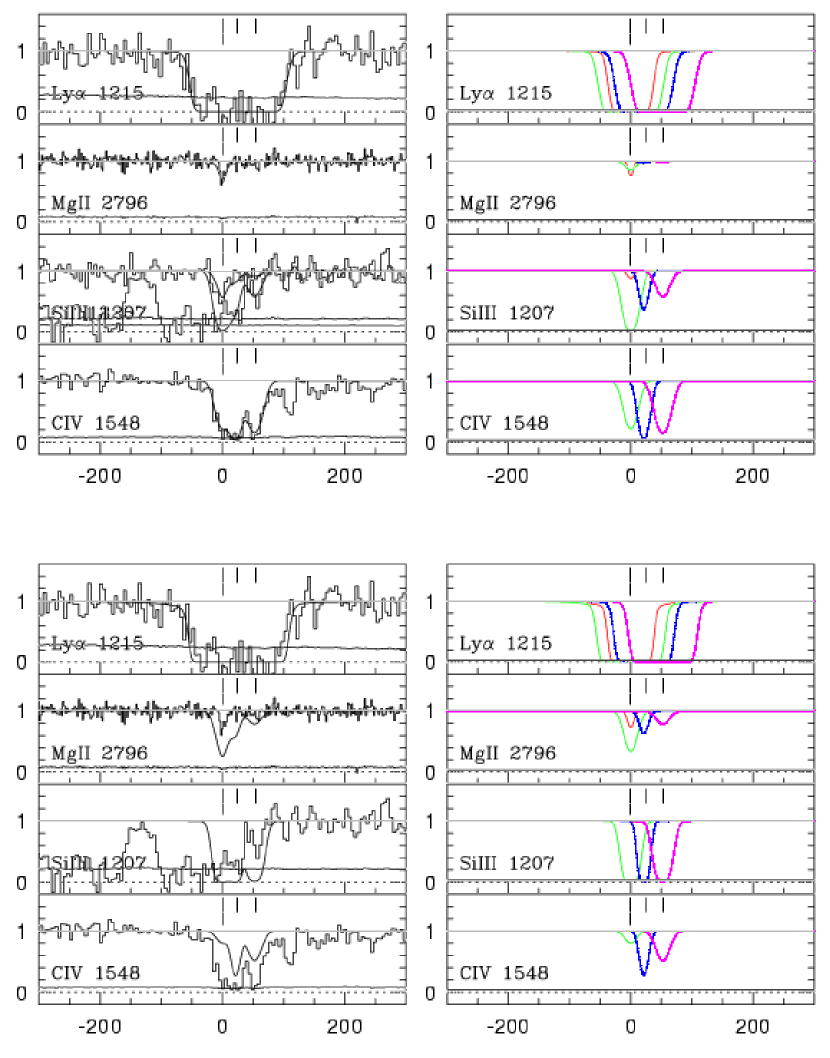
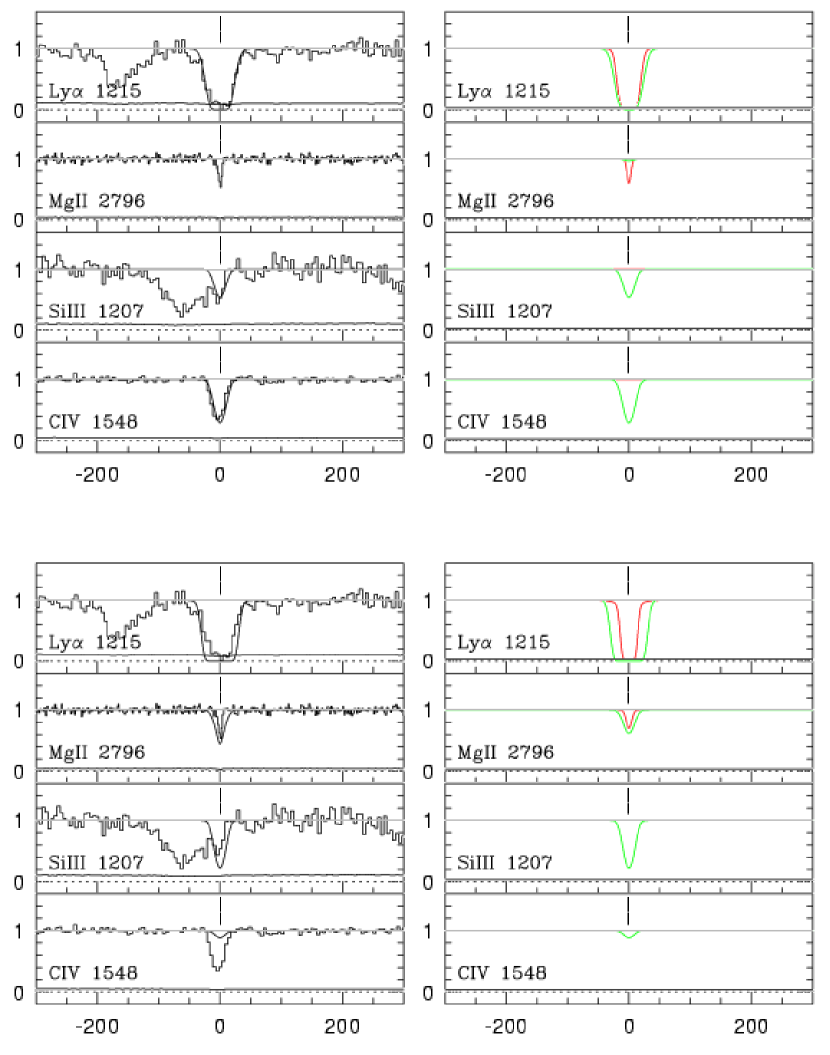
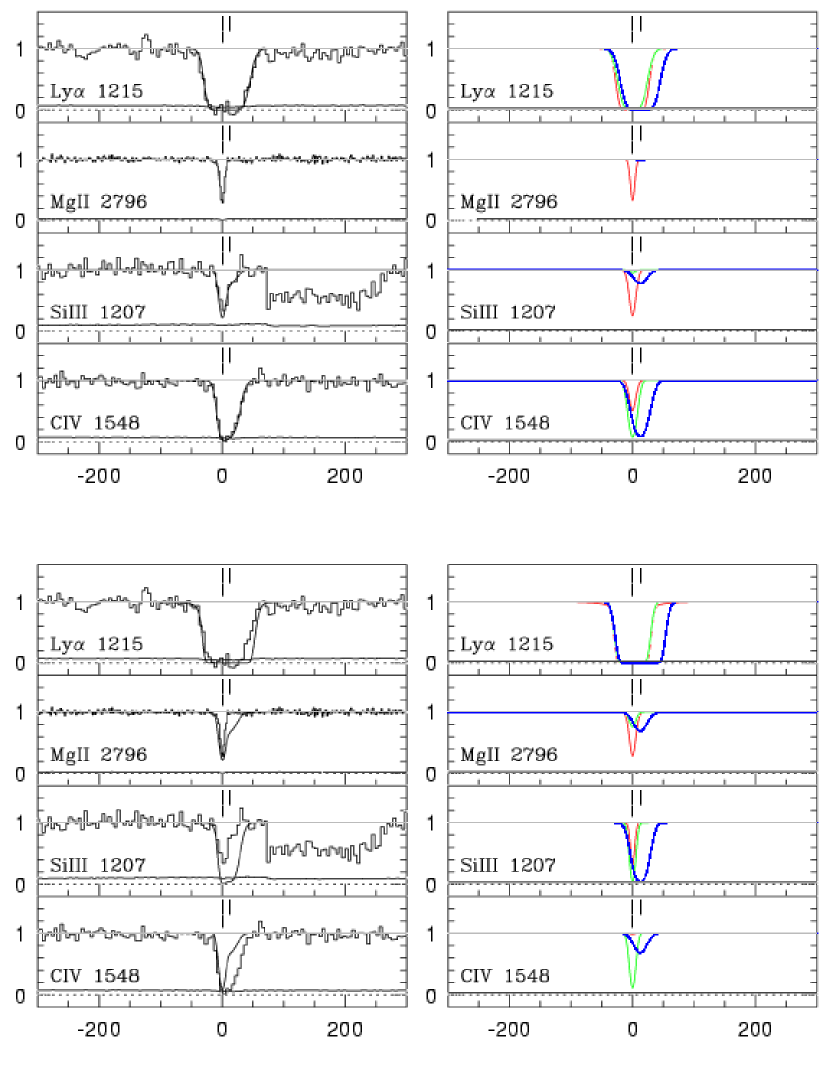
For the purpose of this thought experiment, we assume that an absorber exists at for which the total hydrogen column densities, , electron number densities, , and metallicities, (in solar units), of each of the two phases have the same values as they have for the absorber observed at intermediate redshift. These values, listed in Table 4, are taken from Charlton et al. (2003). In other words, we are considering the effect of the EBR change on an otherwise static structure. The changing photon number density from the EBR leads to a change in the ionization parameter, , which directly affects the ionization state of the absorber. The Cloudy code (Ferland, 2001) was used to solve for the ionization state of each phase of the absorber. The changes in the column densities of the various key transitions from the observed redshift to are listed in Tables 5, 6, and 7. We then synthesized model spectra, noise–free, for the evolved model systems at as they would appear if observed at a resolution of . In order to synthesize these spectra, we used the column densities and temperature output by Cloudy. The latter was used along with the turbulent parameter from the intermediate redshift model cloud in order to determine the observed and the corresponding values for all elements. Figures 10, 11, and 12 present the results of this evolution experiment. The individual model components are shown separately at the observed redshift and at , as well as the result of combining these components.
The system, summarized in Table 5 and Figure 10, is the simplest system, with only a single–component required to fit the high ionization phase absorption. In this case, at the contribution from the high–ionization phase has increased by an order of magnitude, while its has decreased by about the same factor. This leads to a substantially stronger weak, low–ionization absorber at , which has Civ absorption that may not even be detected in some spectra.
Table 6 and Figure 11 present results for evolution of the system, which has two high–ionization phase clouds, one aligned with the low–ionization absorption, and one offset by km s-1. As we expect, the Mgii absorption strength increases and the Civ absorption strength decreases at . However, the most noteworthy change is that the Mgii absorption from the offset high–ionization component becomes detectable at low redshift. This system may at be classified as a multiple cloud, weak Mgii absorber.
The system, presented in Table 7 and Figure 12, would also evolve into a multiple–cloud, weak Mgii absorber at . For this system, although the Civ 1548 absorption is substantially weaker at than at , it is still comparable to the Mgii 2796.
In general, the decreasing EBR will lead to an increase in the Mgii equivalent width for a given system. For these representative systems, this does not occur as a result of an increased equivalent width for the small, – pc, structure that produces the Mgii absorption at . Instead, it is the result of a large increase in the Mgii absorption contributed by the larger (hundreds of pcs to a few kpcs) structure that produced the Civ absorption at . Often the Civ profiles for weak Mgii absorbers at have multiple components (Charlton et al., 2003). There could be detectable Mgii absorption at from each of the structures that produces such a Civ component at . Therefore, we expect a larger number of multiple–cloud, weak low ionization absorbers at low redshift. Also, there will be an increase in centered on the original weak Mgii absorber, both from the small, higher density structure and from the large, lower density structure. These effects will lead to detection of a larger number of weak, low–ionization systems at than at . An excellent example of this is the system toward PG (see Figure 12). In fact, this system was just below the detection threshold of the Churchill et al. (1999) survey and was not detected in that survey. It would very easily be detectable if the same structure existed at , primary due to the Mgii contributed by the larger, lower density phase clouds.
4.3 Expected at Due to Evolving EBR
Assuming the observed equivalent width distribution for , we can estimate the expected for that same population, evolved to (the median for our survey) subject to the changing EBR. Our survey was limited to weak systems corresponding to the equivalent width interval Å. We demonstrated in § 4.2 that at these can result from the evolved Mgii phase or the evolved Civ phase of an absorber. They can also result from Civ clouds that are not related to detected Mgii absorbers at that time. For both of these possible predecessors of the weak Mgii absorber population, we estimate the expected result. We calculate what interval of equivalent width of the Mgii or Civ cloud predecessors would give rise to Å at . Then we integrate the appropriate observed equivalent width distribution for Mgii or Civ absorbers at (Churchill et al., 1999; Sargent et al., 1988; Tripp et al., 1996) using those new corresponding values as limits. This is an estimate of how many absorbers should be in the observed interval at present.
First, we consider the weak Mgii absorbers that evolve from Mgii clouds with Å at . On the linear part of the Mgii curve of growth, Å corresponds to cm-2 for the full range of plausible Doppler parameters. For a metallicity and density that is typical for weak Mgii absorbers ( in solar units and cm-3 (Churchill et al., 1999; Charlton et al., 2003)), a Mgii absorber with Å at can arise from a single cloud absorption system with total neutral hydrogen column density cm-2. Under the influence of the stronger EBR at = 0.9, a cloud structure with the same , and with the same metallicity, density, and size would produce an absorption feature with cm-2. This corresponds to Å. We obtain the same number for a “QSO–only” EBR.
Next we consider how the strongest cloud in our survey [ Å at ] would relate to the equivalent width distribution at . A single, low ionization cloud with cm-2 will have Å for a typical Doppler parameter of km s-1. Assuming again the typical parameters, and cm-3, we find that the structure have cm-2. From that same structure, at , the Mgii absorption lines would be only slightly weaker, with Å. In reality, it is more likely that a Å absorber is produced by multiple clouds. If these are blended and saturated, the change in would be even smaller.
We therefore expect that the physical structures that would produce weak Mgii absorption at = 0.15 with Å, would correspond to the equivalent width interval Å at . From this result and the assumption that weak Mgii absorbers have similar total hydrogen column densities, densities, and metallicities at and , a value for that we would expect to observe at can be calculated as follows.
The equivalent width distribution function, gives the number of Mgii absorption systems with rest frame equivalent width per unit equivalent width per unit redshift path. The function is represented by the power law expression
| (4) |
with and (Churchill et al., 1999). The ratio
| (5) |
shows the factor by which the number of absorbers in the equivalent width interval of Å exceeds the number of absorbers in the interval Å. Therefore, the expected value for of weak Mgii systems at the present epoch, leading from the evolution of the Mgii phase of the absorber population at is estimated to be a factor of higher than the statistical redshift number density computed from the survey by Churchill et al. (1999). Taking into account the expected cosmological evolution, for a cosmology (a factor of decrease from to ), we predict a contribution of to the expected numbers of weak Mgii absorbers.
We consider how this estimate varies for different parameters describing the population. Based on previous studies (Rigby et al., 2002; Charlton et al., 2003), we consider and cm-3, and values from to km s-1. In the optically thin regime, metallicity has little effect. However, density has a strong effect on the change of with redshift. This is due to the relatively strong dependence of on the ionization parameter, particularly in the range . The photon number density changes from to over the range . is at for a density of [cm-3]. Low densities produce the largest changes in . Since the Mgii phases of the weak Mgii absorbers at have higher densities, they are not very strongly affected by the EBR. However, we have found in § 4.2 that the Civ phases of these absorbers do have a drastic change in their Mgii column densities. That is because their densities are in the range cm-3 (Charlton et al., 2003).
Next, we give a rough estimate of the of the population of weak Mgii absorbers at that should result from the evolved population of Civ absorbers from . This is quite uncertain because of sensitivity to uncertain physical parameters of Civ absorbers, and because of uncertainties in the observed equivalent width distribution of that population at . The equivalent width distribution for Civ absorbers is best measured for for which Civ is in the optical. We therefore estimate the equivalent width of the Civ absorber, , at that would evolve to have Å at . For cloud densities or cm-3, an absorber with cm-2 or cm-2 would have cm-2 [corresponding to Å]. A structure with these same values would have or Å, respectively, for the two densities, at . Assuming a QSO–only EBR would decrease these values somewhat [e.g. to Å for cm-3], but this change is not substantial compared to other uncertainties in our estimate.
The next step is to determine the of Civ absorbers with Å or Å at . One option is to integrate the observed equivalent width distribution for Civ systems at , extrapolated to lower :
| (6) |
with and Å down to Å (sample A4 of Sargent et al. (1988)). We obtain , integrating from Å to , corresponding to cm-3, and , integrating from Å to , corresponding to cm-3. Even though the largest change in is for cm-3, we find the larger for cm-3 since the fraction of magnesium in the form of Mgii is larger at any redshift for such a cloud. However, Tripp et al. (1996) produced a more sensitive and direct survey for Civ absorbers, particularly in the latter equivalent width range, Å at . They found a somewhat larger number, , though it is consistent within . We estimate that for Civ absorbers that would evolve to have Å at .
Some of these absorbers would, however, already give rise to weak or strong Mgii absorption at . All but a small fraction of Mgii absorbers, denoted as “Civ–deficient” (Churchill et al., 2000), do have Civ detected at the same or similar velocity, though it is likely to be in a different phase. We estimate at for Å, using the redshift parameterization given in Nestor, Turnshek, & Rao (2005). Similarly, Churchill et al. (1999) measured at . Adding these two numbers, and subtracting from the of the relevant Civ population listed above yields the range for Civ absorbers that would evolve into “new” weak Mgii absorbers at . We must also again consider cosmological evolution of that population to determine the expected of its low redshift counterparts. For an cosmology, changes by a factor of from to . Therefore, is our final estimate for the the expected number of Mgii absorbers with Å at due to the evolution of the Civ absorber population subject to the changing EBR. We consider the upper part of this range more probable since it was derived from the more direct Tripp et al. (1996) measurement of the Civ absorber population.
4.4 Discussion of Comparison of Observed and Expected and the Nature of Weak Mgii Absorbers
We have found that the observed at is . Considering sample bias, this is likely to be an upper limit to the true number. However, taking two types of absorption systems that exist at and evolving these populations to , we would expect a larger number, . This expectation includes the evolution of the Mgii phases of the small, parsec–scale absorbers that produce weak Mgii absorption at (; hereafter parsec–scale structures111Sizes of this phase ranges from pc to pc (Rigby et al., 2002; Charlton et al., 2003)) and the evolution of the Civ absorbers at that would contribute to the weak Mgii absorber population at lower redshift (; hereafter kiloparsec–scale structures). Our expectations for at resulting from absorber populations at is valid only if the absorbers are physically stable over large time scales or if their rate of formation per co–moving volume is constant. Our results suggest that one, or more likely both, of the types of structures that evolve into low redshift weak Mgii absorbers are evolving away.
It is important to note that, in fact, the expected increase in the of weak MgII absorbers from or to lower redshifts should already be apparent in the lowest redshift bin of the Churchill et al. (1999) survey, . If we repeat the estimate in § 4.3 for , we find that the expected increase in the number of parsec–scale structures producing weak Mgii absorption from is balanced almost exactly by cosmological evolution, yielding an expected . The expected contribution to weak Mgii absorption from kiloparsec–scale structures at is similarly estimated to be . The combination is already twice the observed value in this redshift bin of the Churchill et al. (1999) survey. Thus the indicated evolution is occuring substantially from to , not just at the lower redshift range we have surveyed here.
In principle, the question of the predecessors of the population of weak Mgii absorbers is a simple one. We should simply examine the physical nature (e.g. density and size) of the systems that produce the absorption at and see which category they fall in (e.g. are they produced just by a kiloparsec–scale structure or by a line of sight passing though both a parsec–scale and a kiloparsec–scale structure). However, in practice this is difficult to determine because of the possibility of “hidden phases”. Specifically, there can be narrow (a couple km s-1), low ionization profiles superimposed on a broader profile from a higher ionization phases. As discussed in § 4.3, this is expected to be more common at that at because of the contribution to the low ionization absorption from the clouds that produce Civ absorption. Figures 10 – 12 show that at , the three example systems toward PG have evolved so that, although present at the same level as before, the parsec–scale, high density phase is not likely to be distinguishable through profile fitting and photoionization modeling.
We can begin to consider what type of weak Mgii absorbers exist in the present by analyzing the six systems present in our survey. Several of the systems discussed in § 3.1 have evidence for multiphase structure (the system toward PG , the system toward PG , the system toward PKS , and the system toward PHL ), but in several cases the multiphase conditions are required by the presence of Ovi and not specifically by Civ. The absorber toward RX J and the absorber toward 3C 273 could both be single–phase (Rosenberg et al., 2003; Tripp et al., 2002), but the former could be produced by a kiloparsec–scale structure while the latter has a size of only pc (Tripp et al., 2002). It is also important to note that at least two of the systems (the system toward RXJ 1230.8-115, the system toward PKS 0405-123, and possibly the system toward PG ) are multiple–cloud weak Mgii absorbers. These could either arise from evolved multiple kiloparsec–scale cloud systems or from several parsec–scale clouds in a larger structure. It seems that the population of weak Mgii absorbers is an inhomogeneous group with multiple origins. However, fundamentally, we cannot demonstrate that any one of the systems definitely does not have a parsec–scale structure along the line of sight.
Since individual cases cannot be classified, we turn to a statistical comparison of the numbers of weak Mgii absorbers at and at . Roughly is observed at both epochs, but we would expect – at based upon the evolving EBR. This expectation was divided into from parsec–scale structures and – from kiloparsec–scale structures. Based on these numbers, three possibilities exist: (1) virtually all kiloparsec–scale structures evolve away from to ; (2) most kiloparsec–scale structures evolve away and most parsec–scale structures evolve away over this interval; (3) most kiloparsec–scale and some fraction of parsec–scale structures evolve away. Note, that the fate of the parsec–scale structures is uncertain, but that in all three possibilities either most or all of the kiloparsec–scale structures evolve away. With this in mind, we consider the expected for different possible origins of each of these types of structures.
The parsec–scale size and small velocity dispersions (few km s-1) for the structures responsible for the low ionization phase of weak Mgii absorbers at suggests they might be unstable over astronomical time scales. The clouds are not in simple pressure equilibrium, since the temperatures for the high and low ionization phases are approximately the same, with high density contrast. The criterion for these gaseous regions to be confined by gravity can be estimated from the method given in Schaye (2001). For an optically thin absorber to be gravitationally bound, the radial size of the cloud is given by the expression
| (7) |
where is the column density of neutral hydrogen for the absorbing region, the temperature in units of Kelvin, is the hydrogen photoionization rate normalized to 10, and is the fraction of mass in the form of gas given by the ratio /. At low redshifts the estimated rate of photoionization is s-1 (Davé et al., 2001). The typical value of baryon mass gas fraction is (Schaye (2001) and references therein). Hence, the size of low ionization clouds which produce weak Mgii absorption must exceed – kpc in order to be gravitationally stable, much larger than the parsec–scale sizes inferred from photoionization models.
These structures would not be gravitationally stable unless was much larger. However, a larger is feasible, either due to dark matter or due to additional baryons. Rigby et al. (2002) suggested that the weak Mgii absorbers could be remnant gas between the stars in a population of intergalactic star cluster, where the star to gas ratio could be . This is comparable to present limits on the amount of gas that could be present in globular clusters. In an intergalactic star cluster model, the Civ absorption seen in weak Mgii absorbers would be produced by gas ejected by supernovae from the cluster, which is housed in the dark matter halo that surrounds it (Rigby et al., 2002). Both the parsec–scale and the kiloparsec–scale components in such a star cluster/dark matter halo model should be relatively stable.
Alternatively, the structures could be transient, but could be regenerated at a rate consistent with the observed . One possibility of this type, also discussed by Rigby et al. (2002), is that weak Mgii absorption arises in structures related to supernova remnants, or to superbubbles or superwinds as favored by Stocke et al. (2004). In this scenario, Civ absorption would arise in an interface layer between the low ionization shell or sheet and a hotter interior. These structures would not be stable on cosmological timescales, but similar structures would be continuously forming at a rate approximately proportional to the star formation rate. Since the intensity of the EBR is found to decrease since (Haardt & Madau, 1996, 2001), a scenario of this type would predict a decline in the overall number of weak Mgii absorbers from to .
A third possibility for the origin of weak Mgii absorbers is that they arise in high velocity clouds (HVCs), such as those observed around the Milky Way. The observations of Ovi HVCs are consistent with coherent motions of extended sheets of gas which cover more than % of the sky (Sembach et al., 2003). The Ovi has been hypothesized to arise in turbulent boundaries between warm/cold clouds and the hot intragroup medium through which they are travelling (Sembach et al., 2003; Fox et al., 2004). These large structures are likely to have multiphase layers, giving rise to Civ as well as coincident lower ionization absorption from the warm/cold clouds, which has been observed in most sightlines (Wakker, 2001). Most schemes for the origin of HVCs (e.g. material falling into the Local Group, material ejected from the Galaxy, or tidal debris related to satellites) would lead to the prediction of a decreasing from to .
We must also consider the possible origins of the kiloparsec–scale structures that could evolve to produce weak Mgii absorption at . These structures are similar to the high–ionization phases of weak Mgii absorbers at , and should be closely related to the Civ absorber population. The Civ systems observed at low redshift have been found to be closely related to galaxies. Absorption in Civ is detected over most of a kpc radius region surrounding all galaxies, with the radius scaling at (Chen, Lanzetta, & Webb, 2001). Those authors favor accreting satellites as the main mechanism for metal production at these large distances, though they also consider galactic fountains. Either of these models would predict a transient population which would evolve away due to decreasing numbers of satellites or star formation activity.
5 CONCLUSIONS
We have presented the results of a survey of HST/STIS E140M spectra in order to determine the redshift path density of weak Mgii absorbers [ Å] at . The redshift path covered by our survey was at a completeness limit of %. We found , which is consistent with no evolution from , where Churchill et al. (1999) found . Our survey may be slightly biased toward lines of sight with weak Mgii absorbers, thus the actual number may be somewhat smaller.
The apparent lack of evolution is deceptive because it suggests no change in the population of objects producing the absorption. However, the extragalactic background radiation intensity is known to decrease by a factor of from to (Haardt & Madau, 1996, 2001). Therefore the ionization state of absorbers will change. We considered how the three single–cloud, weak Mgii absorbers observed toward PG at , , and would change if the same structures existed in the present. In general, the low ionization absorption grows stronger as the high ionization absorption becomes weaker. We found that the large, low density clouds that produced Civ absorption at will produce observable, but weak, Mgii at . Thus what was a single–cloud weak Mgii absorber at can become a multiple–cloud weak Mgii absorber at .
Because of the decreasing ionization state of absorbers from to , there would be Mgii absorbers that fell below a Å threshold at , but became detectable at . Considering the expected evolution, and integrating the observed equivalent width distribution, we found that in fact this does not lead to a significant increase in the weak Mgii absorber population at . The Mgii column density is not very sensitive to ionization parameter in the relevant range. We predict a for the population of parsec–scale, weak Mgii absorbers. On the other hand, there are also many kilparsec–scale Civ absorption systems that did not have detectable Mgii absorption at , but would become detectable in Mgii at . Again, considering the population of Civ absorbers and their properties, and assuming they are stable and change only due to the changing EBR, we expect – at .
We conclude that the evolved population of structures observed to exist at should give rise to roughly two to three times more weak Mgii absorbers than are observed at . This expected population would likely be dominated by kiloparsec–scale, low density structures that only gave rise to Civ absorption at . However, it would also have a –% contribution from the evolved population of parsec–scale, higher density absorbers that produced weak Mgii absorption at . The numbers indicate that most kiloparsec–scale structures are evolving away from until the present. If all of them are evolving away, then it is possible that none of the parsec–scale structures are evolving away. This could mean that they are stable or that they are regenerated at a roughly constant rate. On the other hand, it seems somewhat more likely that some of the kiloparsec–scale structures will remain at . They could be related to satellites and their interactions or to superwind activity, effects that would decrease with time, but would not disappear. If so, then the parsec–scale structures would have to be transient, and their rate of generation would have to decrease with time. This would be consistent with models that explain weak Mgii absorption as supernova remnants, supershells, superwinds, or high velocity clouds, but not necessarily with intergalactic star clusters.
Although we have shown that weak Mgii absorbers exist at , we only now have hints about the relationship between the structures that produce this population and those that produce similar Mgii absorption at . If the low ionization absorption profiles could be observed at much higher resolution (), it should be possible to dissect the population into parsec–scale and kiloparsec–scale components. Clearly, studies that identify luminous objects that are related to the population are of great value. For both of those types of studies of weak Mgii absorbers, a larger sample would be quite useful (larger than the six mentioned in this paper). For this, future UV spectroscopy missions are essential. Finally, charting the evolution of the weak Mgii absorber population to redshifts of and will also provide constraints on its origins.
This research was funded by NASA under grants NAG – and NNGGEG and by NSF under grant AST––. JRM and RSL were partially funded by the NSF REU program.
References
- Brown et al. (2002) Brown, T., et al. 2002, HST STIS Data Handbook, version 4.0, ed. B. Mobasher (Baltimore; STScI)
- Bruzual & Charlot (1993) Bruzual, A. G., & Charlot, S. 1993, ApJ, 405, 538
- Charlton et al. (2003) Charlton, J. C., Ding, J., Zonak, S. G., Churchill, C. W., Bond, N. A., & Rigby, J. R. 2003, ApJ, 589, 111
- Chen, Lanzetta, & Webb (2001) Chen, H.-W., Lanzetta, K. M., & Webb, J. K. 2001, ApJ, 556, 158
- Chen et al. (2000) Chen, H.-W., & Prochaska, J. X. 2000, ApJ, 543, L9
- Churchill et al. (2000) Churchill, C. W., Mellon, R. R., Charlton, J. C., Jannuzi, B. T., Kirhakos, S., Steidel, C. C., & Schneider, D. 2000, ApJ, 543, 577
- Churchill et al. (1999) Churchill, C. W., Rigby, J. R., Charlton, J. C., & Vogt, S. S. 1999, ApJS, 120, 51
- Davé et al. (2001) Davé, R., & Tripp, T. M. 2001, ApJ, 553, 528
- Ding et al. (2005) Ding, J., Charlton, J. C., & Churchill, C. W. 2005, ApJ, 621, 651
- Ding et al. (2003) Ding, J., Charlton, J. C., Bond, N. A., Zonak, S. G., & Churchill, C. W. 2003, ApJ, 587, 551
- Ding et al. (2003b) Ding, J., Charlton, J. C., Churchill, C. W., & Palma, C. 2003, ApJ, 590, 746
- Ferland (2001) Ferland, G. 2001, Hazy, A Brief Introduction to Cloudy 96.00
- Fox et al. (2004) Fox, A. J., Savage, B. D., Wakker, B. P., Richter, P., Sembach, K. R., & Tripp, T. M. 2004, ApJ, 602, 738
- Haardt & Madau (1996) Haardt, F., & Madau, P. 1996, ApJ, 461, 20
- Haardt & Madau (2001) Haardt, F., & Madau, P. 2001, in Clusters of Galaxies and the High Redshift Universe Observed in X-Rays, ed. D. M. Neumann & J. T. T. Van (Paris: Recontres de Moriond XXVI), in press (astro-ph/0106018)
- Jannuzi et al. (1998) Jannuzi, B. T., et al. 1998, ApJS, 118, 1
- Jenkins et al. (2003) Jenkins, E. B., Bowen, D. V., Tripp, T. M., Sembach, K. R., Leighly, K. M., Halpern, J. P., & Lauroesch, J. T. 2003, ApJ, 125, 2824
- Lanzetta et al. (1987) Lanzetta, K. M., Turnshek, D. A., & Wolfe, A. M. 1987, ApJ, 322, 739
- Milutinović et al. (2005) Milutinović, N., Rigby, J. R., Ding, J., Masiero, J. R., Palma, C., & Charlton, J. C. 2005, in preparation
- Nestor, Turnshek, & Rao (2005) Nestor, D. B., Turnshek, D. A., & Rao, S. M. 2005, ApJ, 628, 637
- Rigby et al. (2002) Rigby, J. R., Charlton, J. C. & Churchill, C. W. 2002, ApJ, 565, 743
- Rosenberg et al. (2003) Rosenberg, J. L., Ganguly, R., Giroux, M. L., & Stocke, J. T. 2003, ApJ, 591, 677
- Sargent et al. (1988) Sargent, W. L., Steidel, C. C., & Boksenberg, A. 1988, ApJS, 68, 539
- Schaye (2001) Schaye, J. 2001, ApJ, 559, 507
- Sembach & Savage (1992) Sembach, K. R., & Savage, B. D. 1992, ApJS, 83, 147
- Sembach et al. (2001) Sembach, K. R., Howk, J. C., Savage, B. D., Shull, J. M., & Oegerle, W. R. 2001, ApJ, 561, 573
- Sembach et al. (2003) Sembach, K. R., Wakker, B. P., Savage, B. D., Richter, P., Meade, M., Shull, J. M., Jenkins, E. B., Sonneborn, G., & Moos, H. W. 2003, ApJS, 146, 165
- Sembach et al. (2004) Sembach, K. R., Tripp, T. M., Savage, B. D., & Richter, P. 2004, ApJS, 155, 351
- Spinrad et al. (1993) Spinrad, H., et. al. 1993, AJ, 106, 1
- Steidel & Sargent (1992) Steidel, C. C., & Sargent, W. L. W. 1992, ApJS, 80, 1
- Steidel (1995) Steidel, C.C. 1995, in QSO Absorption Lines, ed. G. Meylan (Berlin : Springer), 139
- Stocke et al. (2004) Stocke, J. T., Keeney, B. A., McLin, K. M., Rosenberg, J. L., Weymann, R. J., & Giroux, M. L. 2004, ApJ, 609, 94
- Tripp et al. (2001) Tripp, T. M., Giroux, M. L., Stocke, J. T., Tumlinson, J., & Oegerle, W. R. 2001, ApJ, 563, 724
- Tripp et al. (1998) Tripp, T. M., Lu, L., & Savage, B. D. 1998, ApJ, 508, 200
- Tripp et al. (1996) Tripp, T. M., Lu, L., & Savage, B. D. 1996, ApJS, 102, 239
- Tripp et al. (2002) Tripp, T. M., et al. 2002, ApJ, 575, 697
- Tumlinson et al. (2005) Tumlinson, J., Shull, J. M., Giroux, M. L., & Stocke, J. T. 2005, ApJ, 620, 95
- Vogt (1994) Vogt, S. S., et al. 1994, Proc. SPIE, 2198, 362
- Wakker (2001) Wakker, B. P. 2001, ApJS, 136, 463
- Zonak et al. (2004) Zonak, S. G., Charlton, J. C., Ding, J., & Churchill, C. W. 2004, ApJ, 606, 196


| QSO ID | ratio† | PI | Proposal ID | ||||
|---|---|---|---|---|---|---|---|
| 1216Å | 1335Å | 1548Å | kilosec | ||||
| PKS 0405-123 | Heap | ||||||
| PG 0953+415 | Savage | ||||||
| PG 1116+215 | Sembach/Jenkins | ||||||
| 3C273 | Heap | ||||||
| RX J1230.8+0115 | Rauch | ||||||
| PG 1259+593 | Tripp | ||||||
| PKS 1302-102 | Lemoine | ||||||
| 3C351.0 | Jenkins | ||||||
| H 1821+643 | Jenkins | ||||||
| PKS 2155-304 | Shull | ||||||
| PG 1211+143 | Shull | ||||||
| HS 0624+6907 | Tripp | ||||||
| 3C249.1 | Tripp | ||||||
| PG 1444+407 | Tripp | ||||||
| HE 0226-4110 | Tripp | ||||||
| PHL 1811 | Jenkins | ||||||
| PKS 0312-77 | Kobulnicky | ||||||
| TON S210 | Sembach | ||||||
| PG 1216+069 | Tripp | ||||||
| TON 28 | Tripp |
Note. — is per pixel
| zabsorber | QSO | Wr(1260) Å | Wr(1335) Å | Z(Wr,R) |
|---|---|---|---|---|
| 0.005260 | C | |||
| 0.005671 | RX J | |||
| 0.051216 | PG | |||
| 0.080917 | PHL | |||
| 0.138489 | PG | |||
| 0.167121 | PKS |
Note. — Obtained by fitting a Gaussian to data.
| Transition | [km s-1] | atoms cm-2 | [km s-1] |
|---|---|---|---|
| 3C273, system | |||
| Siii | |||
| Cii | |||
| RX J, system | |||
| Siii | |||
| Siii | |||
| Cii | |||
| Cii | |||
| Civ | |||
| PG 1211 + 143, system | |||
| Siii | |||
| Ciia | |||
| Civ | |||
| Civ | |||
| Civ | |||
| Civ | |||
| PHL 1811, system | |||
| Siiib | |||
| Cii | |||
| Civ | |||
| Civ | |||
| PG 1116 + 215, system | |||
| Siii | |||
| Cii | |||
| Siiv | |||
| PKS 0405 - 123, system | |||
| Siii | |||
| Cii | |||
| Cii | |||
Note. — Velocities are offsets from strongest Siii 1260Å component. (a) The Cii 1335Å feature is blended with Galactic Siiv 1403Å. (b) Siii 1260Å absorption feature is blended, probably with Ly at (refer to Fig 5).
| size | ||||||||||||||
|---|---|---|---|---|---|---|---|---|---|---|---|---|---|---|
| [km s-1] | [] | [cm-3] | [pc] | [K] | [cm-2] | [cm-2] | [cm-2] | [cm-2] | [cm-2] | [km s-1] | [km s-1] | [km s-1] | ||
| System | ||||||||||||||
| Mgii1 | ||||||||||||||
| Civ1 | ||||||||||||||
| System | ||||||||||||||
| Mgii1 | ||||||||||||||
| Civ1 | ||||||||||||||
| Civ2 | ||||||||||||||
| System | ||||||||||||||
| Mgii1 | ||||||||||||||
| Civ1 | ||||||||||||||
| Civ2 | ||||||||||||||
| Civ3 | ||||||||||||||
Note. — Column densities
are listed in logarithmic units.
This table of values is taken from Charlton et al. 2003. The three absorbers were studied using a combination of STIS/HST and KECK/HIRES spectra.
to
| Species | Mgii phase | Civ phase |
|---|---|---|
| = 0 km/s | ||
Note. — Number density of Lyman limit photons from the Haardt–Madau spectrum with normalization log(nγ) = -5.51 at and log(nγ) = -6.48 at
to
| Species | Mgii phase | Civ phase | Civ phase |
|---|---|---|---|
| = 0 km/s | = 15 km/s | ||
Note. — Number density of Lyman limit photons from the Haardt–Madau spectrum with normalization log(nγ) = -5.43 at and log(nγ) = -6.48 at
to
| Species | Mgii phase | Civ phase | Civ phase | Civ phase |
|---|---|---|---|---|
| = 0 km/s | = 24 km/s | = 54 km/s | ||
Note. — Number density of Lyman limit photons from the Haardt–Madau spectrum with normalization log(nγ) = -5.67 at and log(nγ) = -6.48 at