The unusual silicate dust around HV 2310, an evolved star in the LMC
Abstract
The spectrum of HV 2310, an evolved star in the Large Magellanic Cloud, taken with the Infrared Spectrograph (IRS) on the Spitzer Space Telescope reveals the presence of an optically thin shell of silicate dust with unusual spectral structure in the 10 m feature, with an emission peak at 9.7 m, a saddle at 10.4 m, and an extended shoulder to 11.2 m. This structure is similar to spectra from crystalline silicate grains, and of the available optical constants, forsterite provides the best fit. The spectrum also shows structure at 14 m which may arise from an unidentified dust feature.
Subject headings:
circumstellar matter — infrared: stars — stars: individual (HV 2310)1. Introduction
The advances in sensitivity made by the Infrared Spectrograph111The IRS was a collaborative venture between Cornell University and Ball Aerospace Corporation funded by NASA through the Jet Propulsion Laboratory and the Ames Research Center. (Houck et al., 2004) on the Spitzer Space Telescope (Werner et al., 2004) expands the field of infrared spectroscopy to distant, faint, metal-poor galaxies. The absorption and emission of radiation by dust in these galaxies dominates the astrophysics in the infrared, and if we are to understand the nature of this dust, we must determine if global dust properties depend on metallicity, and if so, how.
The Magellanic Clouds provide the ideal laboratory for this investigation, as the global metallicity of the Large Magellanic Cloud (LMC) is approximately 0.5 times solar, and in the Small Magellanic Cloud, the metallicity is 0.25 times solar (e.g. Hill et al., 1997; Luck et al., 1998). In the Milky Way, stars on the Asymptotic Giant Branch (AGB) account for the majority of the dust injected into the interstellar medium (ISM; Gehrz, 1989), so it is reasonable to assume a similar case in the Magellanic Clouds. The dust in shells around evolved stars has not yet been mixed into the interstellar medium, so the study of spectra from circumstellar dust shells enables the different chemical components of the future ISM to be identified and studied separately.
Here we report on one of the more interesting sources in our study of the Magellanic Clouds, HV 2310, a Mira variable in the LMC with a 598-day period. We show that the silicate emission from HV 2310 is quite unusual, and that it the presence of crystalline silicates, particularly forsterite, can explain this structure.
2. Observations and Reductions
Spitzer observed HV 2310 on 2004 April 18 (IRS Campaign 5) with the Short-Low (SL) and Long-Low (LL) modules. The total integration times were 112 seconds for SL and 480 seconds for LL. The analysis begins with the flatfielded images generated by the standard online data-reduction pipeline at the Spitzer Science Center (S11.0) and follows the procedure described by Sloan et al. (2004). The K giant HR 6348 served as the standard for SL, while it and the K giants HD 166780 and HD 173511 calibrated LL. The wavelengths from the S11.0 pipeline have been shifted slightly to account for the slight offsets described by Sloan et al. (2005a). In SL order 1, the offset is 0.042 m.
3. Analysis
Figure 1 presents the spectrum of HV 2310, which includes contributions from the star and the silicate dust in its circumstellar shell. Egan & Sloan (2001) found that dust shells which produce similar spectra in the galactic sample are optically thin. We assume the optically thin case for HV 2310, which means the contribution from the star and dust can be separated using the method developed by Sloan & Price (1995, 1998; hereafter SP) to spectra from the Low-Resolution Spectrometer on IRAS. They fit a stellar continuum to the spectrum in the 7.64–8.70 m range and subtract it from the entire spectrum. The difference is the dust spectrum.
For the galactic sample of AGB stars examined by SP, NU Pav served as a proxy for the stellar component in the spectrum from each source. NU Pav is an M6 giant, and its spectrum can be approximated with a 3240 K Engelke function (Engelke, 1992) and a SiO fundamental band with an absorption depth of 15% (measured at low resolution). The spectrum of NU Pav used here was observed by the Short-Wavelength Spectrometer (SWS) on ISO (TDT 12103028). We used the spectrum from the SWS Atlas (Sloan et al., 2003a), binned to the IRS resolution. We modified the wavelength range for fitting the stellar continuum by SP to 5.5–7.0 m.

The only apparent features in the stellar-subtracted spectrum are solid-state in nature, so when plotting the continuum-subtracted spectrum in Figure 1, we smoothed the LL data using a seven-pixel boxcar. Subsequent figures plot the spectra at all wavelengths with no smoothing.
A silicate emission feature at 10 m dominates the dust spectrum of HV 2310, and it has a double-peaked structure, with an emission peak at 9.7 m, a minimum at 10.4 m, and an extended shoulder to 11.2 m. This basic structure appears in both nod positions. Similar spectral shapes appear in dust spectra from comets and young stars and are attributed to emission from crystalline silicates (e.g. Bregman et al., 1987; Knacke et al., 1993; Honda et al., 2003), but such a shape is rarely seen in spectra from dust shells around evolved stars.
3.1. Comparison to the galactic sample
SP classify optically thin silicate emission (SE) features by using the ratios of the dust emission at 10, 11, and 12 m (after removing the stellar contribution). Roughly, the SE classification . The classifications run from SE1, which arises from amorphous alumina grains, to SE8, the classic silicate feature at 10 m produced by amorphous silicates.
Following the same method, we classify the dust spectrum of HV 2310 as SE6, although the spectrum is close to the boundary with SE5. SE6 is at the transition to structured silicate emission spectra (SE4–6), which show broader silicate features, often with a shoulder at 11 m and in some cases, with a strong 13 m feature (suffix “t”). Subtracting an Engelke function without SiO absorption moves the classification over the boundary to SE5. This would be the extreme metal-poor case, and it has little other effect on our analysis.
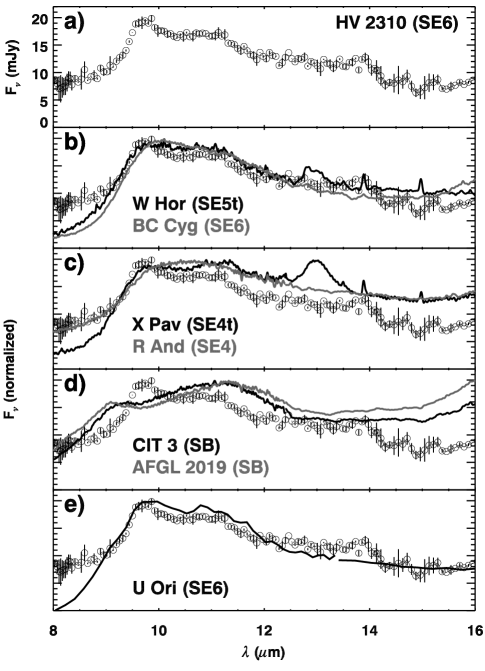
Figure 2 compares the dust spectrum of HV 2310 with similarly extracted dust spectra from evolved stars in the Galaxy. Panel b compares HV 2310 with two sources with similar flux ratios at the boundary between SE5 and SE6, both with and without a 13 m feature. The spectrum of W Hor (the 13 m source) resembles HV 2310 more closely, with a clearer shoulder at 11.2 m than BC Cyg. Panel c compares HV 2310 with two SE4 sources, which show a larger contribution to the dust emission at 11 m. The 13 m source, X Pav, shows a clear minimum at 10.5 m and an extended shoulder out to 11.4 m, while R And differs more from HV 2310. The two 13 m sources in Figure 2 show some similarities with HV 2310, but neither has the narrow 9.7 m feature or as strong of a dip from 9.7 to 10.4 m. Among these SWS spectra, which were chosen because of their general similarities to HV 2310, HV 2310 is unique.
There are competing explanations of how the structured silicate spectra in the SE4–6 range are produced. Many authors have proposed crystalline silicate grains (e.g. Tielens, 1990; Little-Marein & Little, 1990; Nuth & Hecht, 1990), but other explanations are also possible. Lorenz-Martins & Pompeia (2000) fit models mixing amorphous alumina and amorphous silicate grains to the structured silicate spectra. While such a combination might reproduce the spectrum of R And in Figure 2, it could not produce the structure in the spectrum of X Pav. Egan & Sloan (2001) showed that self-absorption of the 10 m silicate feature would also work. The dust shells producing structured silicate spectra would have to be optically thick to self absorb, but then would have to be geometrically thin to match the observed [12][25] colors.
Panel d in Figure 2 compares the spectra of two self-absorbed amorphous silicate features (classification SB) to HV 2310. Egan & Sloan (2001) show that as the silicate feature goes into self-absorption, the silicate feature broadens, and then the 10 m emission drops while the 11 m emission remains strong. As the optical depth increases, the spectrum develops a secondary peak in the vicinity of 9 m. In self-absorbed silicate spectra, the short-wavelength wing of the 10 m feature is always weaker than the long-wavelength wing, but in HV 2310, it is the other way around.
The flux ratios used to classify HV 2310 as an SE6 do not measure the dip in emission between 10 and 11 m. Shifting the wavelength regions used to determine the flux ratio so that they are centered at 9.7, 10.3, and 10.7 m allows us to compare HV 2310 to the larger sample of LRS spectra from evolved stars in the galaxy examined by SP. We limited our comparison to the 200 sources with [12] and a dust contrast of 8% or more with respect to the continuum from 7.67 to 14.03 m. U Ori is the one source in the LRS database with similar flux ratios in these modified wavelength regions and a similar SP classification. The comparison in Panel e shows that the spectra have much in common, but in U Ori, the peak at 9.7 m and shoulder at 11.2 m are not as well pronounced.
3.2. Possible amorphous dust components
Ossenkopf et al. (1992, hereafter OHM) generated optical constants for amorphous silicate grains which reproduce the spectra observed in typical shells around evolved stars. Two other amorphous grains commonly identified in oxygen-rich circumstellar environments are amorphous alumina (Vardya et al., 1986; Onaka et al., 1989) and glassy pyroxenes (Gürtler & Henning, 1986; Jäger et al., 1994), although the latter have only been noted around young stars, not evolved stars. Adding these optical constants to the OHM constants will extend the peak of the 10 m feature to the blue and add a shoulder to the red, which should force the shape of the 10 m silicate feature to more closely resemble the observed feature in HV 2310.
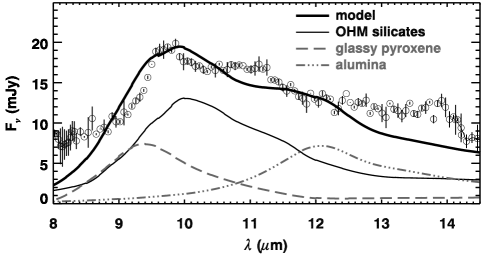
Figure 3 shows a model of the spectrum of HV 2310 using 70% OHM silicates, 20% glassy pyroxene, and 10% amorphous alumina. To model the dust emission, we generate optical efficiencies () from the complex indices of refraction following the technique described by Draine & Lee (1984). For amorphous silicates, we use OHM Set 1. The ISAS sample of amorphous alumina measured by Koike et al. (1995) match the broad features (SE1–3) observed in the galactic sample well (Egan & Sloan, 2001). For glassy pyroxenes, we adopt the 95% Mg sample measured by Jäger et al. (2003). Shifting to lower percentages of Mg broadens the emission feautre at 9.4 m, but it does not shift its position significantly. We assume a grain size of 0.1 m and a grain temperature of 450 K.
The pyroxene adds more flux to the blue of the OHM peak at 10.0 m, but the pyroxene peaks at 9.4 m and has a full width at half maximum (FWHM) of 1.6 m, compared to the actual feature in HV 2310, which peaks at 9.7 m, and is narrower than the model pyroxene. By fitting a linear continuum under the feature in HV 2310 from 9.0 to 11.3 m, we measure the FWHM to be 0.7 m.222Fitting two gaussians to the total profile centered at 9.6 and 11.0 m gives a FWHM for the 9.6 m component of 1.1 m, but this is still narrow compared to the glassy pyroxene, and it is too simplistic, as it ignores the presence of the 10 m silicate feature. Adding more pyroxene would only increase the mismatch between the model and the dust spectrum from HV 2310 between 9.0 and 9.4 m.
The alumina peaks at 12.0 m, too far to the red to reproduce the observed shoulder extending to 11.2 m. Thus, we conclude that glassy pyroxenes and amorphous alumina cannot reproduce the observed spectral structure produced by the dust around HV 2310 between 9.4 and 11.2 m. However, as shown below, these dust species may still be present in the circumstellar shell of HV 2310.
3.3. Crystalline silicates
The spectral structure in the dust emission from HV 2310 cannot result from a combination of amorphous alumina and amorphous silicates, and it cannot arise from self-absorbed emission from amorphous silicate grains. The dust must contain some other component, and given the narrowness of the emission feature at 9.7 m, this component is most likely crystalline. To test this possibility, we will construct a simple model which is a sum of optically thin emission from amorphous dust grains and crystalline silicate grains.
Crystalline silicate grains show a wide variety of spectral structure depending on the olivine-to-pyroxene ratio, the Mg/Fe ratio, and the shape of the grains (among other variables such as size and fluffiness). Two laboratories (in Jena and Kyoto) have produced particularly useful sets of data on silicates in the olivine and pyroxene series.
The Kyoto group have published a series of opacity measurements for the olivine series, covering several Mg/Fe ratios from forsterite (the Mg-rich endmember, Mg2SiO4) to fayalite (the Fe-rich endmember, Fe2SiO4) (Koike et al., 2003). They have also published a similar series of measurements for pyroxenes from enstatite (MgSiO3) to ferrosilite (FeSiO3) (Chihara et al., 2002).
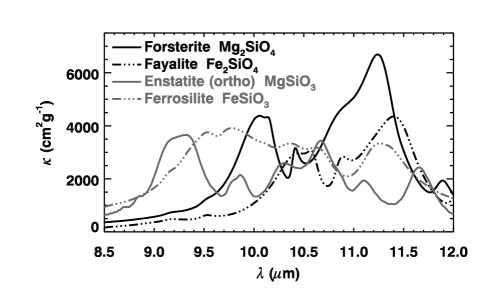
Figure 4 presents the opacities from the Kyoto group for the endmembers of both series. Forsterite, with its peaks at 10.0 and 11.2 m, fits the dust spectrum from HV 2310 better than the other dust species. Fayalite produces features at 10.5 and 11.4 m, while ferrosilite has a very broad feature centered at 9.7 m and a secondary peak at 11.3 m. Both these dust spectra would fill in the 10.4 m saddle in HV 2310 and can thus be ruled out. Enstatite produces features at 9.2, 10.7, and 11.7 m. The strongest feature is at 9.2 m and is not observed in HV 2310.
Forsterite is not an ideal match to HV 2310, as the 10.0 m feature is to the red of the observed 9.7 m feature, and the 11.2 m peak can account for only the red portion of the observed shoulder from 10.4 to 11.2 m. However, the wavelengths of the spectral features from crystalline dust species depend strongly on grain shape. While the opacity measurements from the Kyoto group provide good sampling over several Mg percentages from 100% to 0% for both olivines and pyroxenes, they do not measure the complex indices of refraction or dielectric constants. As a consequence, we cannot use them to analyze the effect of grain shape on the dust spectra.
Fortunately, the Jena group provides indices of refraction for forsterite and fayalite (Fabian et al., 2001), as well as enstatite (Jäger et al., 1998). They also provided opacities (mass absorption coefficients) for spherical grains, a continuous distribution of ellipsoids (CDE1), and a modified CDE using quadratic weighting to emphasize spherical grains (CDE2). Generally, CDEs are unsatisfactory because they include grains which are infinitely cylindrical or flat. On the other hand, deviations from spherical symmetry are essential to reproduce observed interstellar polarizations (e.g. Kim & Martin, 1995). To generate optical efficiencies for a variety of grain shapes, we apply the methodology presented by Fabian et al. (2001).
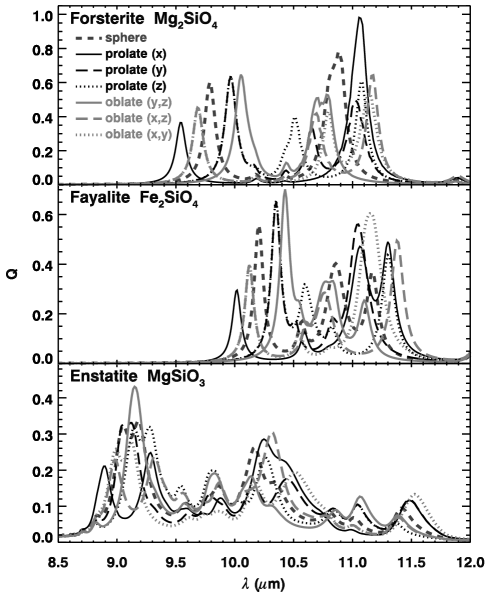
Figure 5 explores the effect of changing the grain shape among all possible spheroids having 3:1 axial ratios. The lengths along the axes are normalized such that the volume equals that for a sphere of radius 0.1 m. Panel (a) shows that varying the grain shape can move the feature seen at 9.8 m in spherical grains from 9.5 to 10.1 m. Similarly, the 10.9 m feature can shift from 10.5 to 11.2 m. Thus, with the right choice of shape distribution, it should be possible to fit a model including forsterite to the observed dust spectrum of HV 2310. Panels (b) and (c) effectively rule out fayalite and enstatite, as neither can produce a featur at 9.7 m as observed in HV 2310. Increasing the axial ratios to 10:1 does not improve matters.
3.4. Fitting crystalline silicates to HV 2310
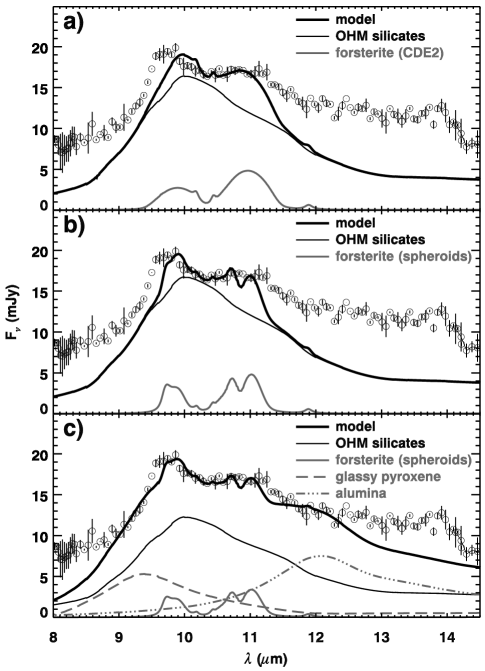
The top panel in Figure 6 compares a model combining OHM silicates (92%) with a CDE2 distribution of forsterite (8%) to the dust spectrum of HV 2310. Qualitatively, the model reproduces both the narrow short-wavelength peak and the broader long-wavelength shoulder, but the fit is far from perfect quantitatively. The model produces a peak which is to the red of the observed 9.7 m peak, and it does not produce a shoulder which continues to 11.2 m.
The top panel in Figure 5 shows that extending grains along the x axis shifts the 9.8 m feature to the blue, while shortening the x axis shifts the feature to the red. The y and z axes behave similarly, but in the opposite direction. By simply varying the size of the grains along any one axis with respect to the other two, we can broaden the 9.8 m feature without shifting it to better match the observed profile. The behavior of the 10.9 m feature is more complicated. Deviations from spherical symmetry split this feature into two components, which should reproduce the observed plateau from 10.5 to 11.2 m. Only oblate grains extended along the x and z axes are able to push the red component to 11.2 m. Similarly, only prolate grains extended along the z axis can push the blue component to 10.5 m.
Thus, a distribution of spheroids including prolate (z) grains and oblate (x,z) grains should improve the fit provided by the CDE2 model by building a better plateau and broadening the 9.8 m feature without shifting it to longer wavelengths. To test this possibility, we construct a spheroidal distribution running from prolate (z) through spherical to oblate (x,z), using gaussian weighting such that 90% of the grains have axial ratios less than 3:1.
The purpose of this exercise is not to determine the actual shape distribution of the grains around HV 2310, but simply to demonstrate that changing the shape distribution can improve how well forsterite fits the observed spectral structure. As Panel (b) of Figure 6 shows, the chosen spheroidal distribution improves the model in the vicinity of the 9.7 m feature (although there is still room for further improvement) and it fits the plateau to 11.2 m about as well as the CDE2 model. In this model, 7% of the grains are crystalline.
In Panels (a) and (b) of Figure 6, the models underestimate the observed flux in the wings to either side of the structure from 9.5 to 11.2 m. Panel (c) shows that adding the glassy pyroxene and amorphous alumina samples first considered in §3.2 improves the model substanitally, suggesting that these dust species may be present in the shell around HV 2310.
It is important to emphasize the limitations of the modelling illustrated in Figure 6. The relative spectral positions of the dust features depend on the shape of the grains, but they also depend on the relative amounts of Mg and Fe. As Figure 5 shows, fayalite produces similar spectra to forsterite, but each feature is shifted to the red, with the 9.8 m feature shifting more than the 10.9 m feature. While Koike et al. (2003) measured samples intermediate between forsterite and fayalite (at 20% intervals), they only provide opacities. Fabian et al. (2001) provide indices of refraction, but only for the endmembers of the olivine series. Thus, we are not in a position to fit both the Mg/Fe ratio and the shape distribution simultaneously. It is unlikely that the dust in HV 2310 has no Fe content, making it desirable to have optical constants for Mg-dominated but not Mg-pure crystalline olivine species. Without these constants, it is unreasonable to further contrain the shape distribution of the grains. To repeat, the objective here is to demonstrate the feasibility of fitting dust species near the forsterite end of the olivine series to the dust spectrum of HV 2310.
3.5. Other spectral features
The spectrum of HV 2310 shows other spectral features as well. It has a silicate feature at 18–20 m which peaks at 19 m. The precise center is difficult to pin down due to the noise apparent in the unsmoothed spectrum. The spectrum of HV 2310 shows sharp inflections at 13.9 m and 14.3 m, which can be interpreted either as a dust emission feature at 13.9 m or an absorption band with its blue wing starting at 13.9 m. CO2 gas should absorb in this spectral region. Models by Cami (2002, Appendix A) show that if the temperature of the gas is low (500 K), the band begins at 13.5 m, but the models do not show a sharp inflection as seen in our spectrum, and the models show a strong contribution from the bending mode at 14.98 m which does not appear in our spectrum.
In Panel (e) of Figure 2 and Panel (c) of Figure 6, the spectral structure at 14 m appears to be above any possible dust continuum, leading us to suspect that we have observed a new dust feature from an unknown carrier. Our confidence is limited by the coincidence of this feature with the boundary between SL and LL. One inflection in the slope appears in each module, and where they overlap, the slope is in good agreement, but we await confirmation of this feature in other sources and with the Short-High module of the IRS.
The spectrum of HV 2310 does not show a 13 m emission feature, nor does it show the dust emission features at 20 and 28 m or the CO2 bands in the 13–16 m range, which Sloan et al. (2003b) found to correlate with the 13 m feature in their study of optically thin dust shells around evolved stars in the Galaxy. The dust spectrum does show gentle inflections at 23, 28, and 33 m, and while these are at wavelengths where crystalline silicate emission would be expected, the spectrum also shows an inflection at 30 m, where nothing would be expected. None of these features are clear in the unsmoothed spectrum, making us cautious about their significance.
The absence of the 13 m feature in the spectrum of HV 2310 is interesting. Sloan et al. (2003b) have suggested that the leading candidate for the carrier of this feature is crystalline alumina. We see crystalline silicate features in the 10–11 m region, and amorphous alumina could well be present in the 12 m region, so why is crystalline alumina absent at 13 m? The answer to this question is not clear, but it may lie in the possible dust feature at 14 m.
4. Discussion
The dust emission in the spectrum of HV 2310, with its narrow 9.7 m component and 11.2 m shoulder superimposed on the amorphous silicate emission feature at 10 m, is very unusual when compared to evolved Galactic sources. Among the possible explanations available to us, the most plausible is the presence of crystalline silicates, particularly forsterite. As Figures 5 and 6 show, forsterite can fit the observed spectral emission well.
Crystalline silicates are well known in the vicinity of young stars and in the optically thick shells around OH/IR stars, but their presence in optically thin shells around evolved stars has yet to be demonstrated convincingly. Sloan et al. (2003b) investigated optically thin dust shells around evolved stars in the Galaxy, and they found that semi-regular variables, which have lower mass-loss rates than similar Mira variables, show stronger emission in the 13 m feature and the correlated dust features at 20 and 28 m. They suggested that these dust features may arise from a mixture of crystalline alumina (at 13 m) and crystalline silicates (20 and 28 m).
Gail & Sedlmayr (1998) argue that the degree of crystallinity in a forming grain is a balance between the timescale for atoms to jump into a low-energy location in the lattice structure and the rate at which a grain accumulates more atoms. If the grains are forming quickly, then they are accumulating material faster than it can settle into the crystalline lattice, resulting in an amorphous structure. However, if the grains are forming slowly, then each atom has sufficient time to find its way into the lattice structure before more atoms pile on top of it and lock it into position. Kouchi et al. (1994) proposed a similar mechanism for the condensation of crystalline ice onto grain mantles. Sloan et al. (2003b) suggested that this mechanism could explain the unusual spectral structure they observed in semi-regular variables in the Galactic sample.
If low mass-loss rates can lead to the direct formation of crystalline silicate grains, then the generally lower metallicities in the Magellanic Clouds should lead to a higher degree of crystallinity in the outflows from evolved stars. Given two stars with the same mass-loss rate but different metallicities, the star with lower metallicity has fewer heavy atoms from which dust can form in its outflows, and as far as dust production is concerned, has a lower effective mass-loss rate. The possibility that stars with lower metallicities might produce crystalline dust is what makes the spectrum of HV 2310 so fascinating.
The spectral structure in the 10 m range shows similarities to both the laboratory measurements of forsterite and the spectra from galactic spectra which show the 13 m feature (although HV 2310 does not show this feature). The similarity with some galactic spectra suggests that at least some of the spectra classified as structured silicate emission sources (SE4–6) have enhanced amounts of crystalline silicates contributing to the spectral structure in the 10–11 m range. HV 2310 simply has a higher degree of crystallinity than its galactic counterparts.
Because crystalline silicates produce more distinct and sharper features than amorphous silicates, their presence in an observed spectrum makes it easier to analyze the properties of the grains. The spectrum of HV 2310 is certainly intriguing, but the relatively high temperature of the grains limits our ability to detect crystalline features beyond the 10 m complex, and this in turn limits our study of the astromineralogy. The spectrum does point to the potential for interesting discoveries as Spitzer continues to obtain more spectra from dust shells around evolved stars in the Magellanic Clouds.
References
- Bregman et al. (1987) Bregman, J. D., Witteborn, F. C., Allamandola, L. J., Campins, H., Wooden, D. H., Rank, D. M., Cohen, M., & Tielens, A. G. G. M. 1987, A&A, 187, 616
- Cami (2002) Cami, J., Ph.D. Dissertation (Amsterdam: Univ. of Amsterdam)
- Chihara et al. (2002) Chihara, H., Koike, C., Tsuchiyama, A., Tachibana, S., & Sakamoto, D. 2002, A&A, 391, 267
- Draine & Lee (1984) Draine, B. T. & Lee, H. M. 1984, ApJ, 285, 89
- Egan & Sloan (2001) Egan, M. P. & Sloan, G. C. 2001, ApJ, 558, 165
- Engelke (1992) Engelke, C. W. 1992, AJ, 104, 1248
- Fabian et al. (2001) Fabian, D., Henning, T., Jäger, C., Mutschke, H., Dorschner, J., & Wehrhan, O. 2001, A&A, 378, 228
- Gail & Sedlmayr (1998) Gail., H.-P., & Sedlmayr, E. 1998, in The Molecular Astrophysics of Stars and Galaxies, ed. T. W. Hartquist & D. A. Williams (Oxford: Clarendon Press), 285
- Gehrz (1989) Gehrz, R. D., in Interstellar Dust, Proc. IAU Symp. 135, ed. L. J. Allamandola & A. G. G. M. Tielens (Dordrecht: Kluwer), 445
- Gürtler & Henning (1986) Gürtler, J. & Henning, Th. 1986, Ap&SS, 128, 163
- Hill et al. (1997) Hill, V., Barbuy, B., & Spite, M. 1997, A&A, 323, 461
- Honda et al. (2003) Honda, M., Kataza, H., Okamoto, Y. K., Miyata, T., Yamashita, T., Sako, S., Takubo, S., & Onaka, T. 2003 ApJ, 585, L59
- Houck et al. (2004) Houck, J. R., et al. 2004, ApJS, 154, 18
- Jäger et al. (1994) Jäger, C., Mutschke, H., Begemann, B., Dorschner, J., & Henning, Th. 1994, A&A, 292, 641
- Jäger et al. (1998) Jäger, C., Molster, F. J., Dorschner, J., Henning, Th., Mutschke, H., Waters, L. B. F. M. 1998, A&A, 339, 904
- Jäger et al. (2003) Jäger, C., Dorschner, J., Mutschke, H., Posch, Th., & Henning, Th. 2003, A&A, 408, 193
- Kim & Martin (1995) Kim, S.-H. & Martin, P. G. 1995, ApJ, 444, 293
- Knacke et al. (1993) Knacke, R. F., Fajardo-Acosta, S. B., Telesco, C. M., Hackwell, J. A., Lynch, D. K., & Russell, R. W. 1993, ApJ, 418, 440
- Koike et al. (1995) Koike, C., Kaito, C., Yamamoto, T., Shibai, H., Kimura, S., & Suto, H. 1995, Icarus, 114, 203
- Koike et al. (2003) Koike, C., Chihara, H., Tsuchiyama, A., Suto, H., Sogawa, H., & Okuda, H. 2003, A&A, 399, 110
- Kouchi et al. (1994) Kouchi, A., Yamamoto, T., Kozasa, T., & Greenberg, J. M. 1994, A&A, 290, 1009
- Little-Marein & Little (1990) Little-Marenin, I. R., & Little, S. J. 1990, AJ, 99, 1173
- Little-Marenin & Price (1986) Little-Marenin, I. R., & Price, S. D. 1986, in Summer School on Interstellar Processes: Abstracts of Contributed Papers, ed. D. J. Hollenbach & H. A. Thronson (NASA Tech. Mem. 88342; Moffett Field: NASA), 137
- Lorenz-Martins & Pompeia (2000) Lorens-Martins, S., & Pompeia, L. 2000, MNRAS, 315, 856
- Luck et al. (1998) Luck, R. E., Moffett, T. J., Barnes, T. G., III, & Gieren, W. P. 1998, AJ, 115, 605
- Nuth & Hecht (1990) Nuth, J. A., & Hecht, J. H. 1990, Ap&SS, 163, 79
- Onaka et al. (1989) Onaka, T., de Jong, T., & Willems, F. J. 1989, A&A, 218, 169
- Ossenkopf et al. (1992) Ossenkopf, V., Henning, T., & Mathis, J. S. 1992, A&A, 261, 567
- Sloan et al. (2003b) Sloan, G. C., Kraemer, K. E., Goebel, J. H., & Price, S. D. 2003b, ApJ, 594, 483
- Sloan et al. (2003a) Sloan, G. C., Kraemer, K. E., Price, S. D., & Shipman, R. F. 2003a, ApJS, 147, 379
- Sloan & Price (1995) Sloan, G. C. & Price, S. D. 1995, ApJ, 451, 758
- Sloan & Price (1998) Sloan, G. C. & Price, S. D. 1998, ApJS, 119, 141
- Sloan et al. (2004) Sloan, G. C., et al. 2004, ApJ, 614, L77
- Sloan et al. (2005a) Sloan, G. C., Spoon, H. W. W., & Bernard-Salas, J. 2005, IRS Technical Report 05002, Low-resolution wavelength calibration of the IRS (Ithaca, NY: Cornell, available at http://isc.astro.cornell.edu/tech/tr/)
- Tielens (1990) Tielens, A. G. G. M., 1990, in From Miras to Planetary Nebulae: Which Path for Stellar Evolution?, ed. M. O. Mennessier & A. Omont (Gif-sur-Yvette: Editions Frontières), 186
- Vardya et al. (1986) Vardya, M. S., de Jong, T., & Willems, F. J. 1986, ApJ, 304, L29
- Werner et al. (2004) Werner, M. W., et al. 2004, ApJS, 154, 1