WFILAS: WIDE FIELD IMAGER LYMAN ALPHA SEARCH
Abstract
The Wide Field Imager Lyman-Alpha Search (WFILAS) is a search for Ly emitting galaxies at . Deep images from the Wide Field Imager (WFI) on the ESO/MPI 2.2 m telescope have been used to detect 7 bright Ly emitting candidates in three fields covering 0.74 sq. degree on the sky. For this we used three narrowband (FWHM 70 Å), one encompassing intermediate band (FWHM 220Å) and broadband and filters. One has thus far been spectroscopically confirmed as a Ly emitting galaxy at using FORS2 at the VLT. This galaxy shows a bright, well resolved asymmetric line profile, which is characteristic of Ly emitting galaxies.
In one of our three fields, the Chandra Deep Field South (CDFS), we find an overdensity of Ly emitters in agreement with other surveys that have targeted this region. A statistically complete sample of our candidates probes the bright-end of the luminosity function, confirming earlier results from other smaller, deeper surveys.
1Mt. Stromlo Observatory, Research School of Astronomy & Astrophysics, Australia
2European Southern Observatory, Chile
3National Centre for Radio Astrophysics, India
4Max Planck Institute für Astronomie, Germany
5Department of Physics, University of Oxford, United Kingdom
1 Introduction
To be able to derive the star formation history of the Universe, it is necessary to determine the star formation rate at several redshifts. Emission lines are good probes for this, as the star formation rate is proportional to the line luminosity. The hydrogen Balmer series is particularly well suited for this purpose. The Balmer emission line luminosity is directly proportional to the total ionising flux of the young OB stars embedded in H ii regions, which is equatable to the rate at which they form [8]. Other lines, such as [O ii] and [O iii], can be used as well, although the metallicity of the surrounding gas needs to be taken into account. In all cases, the line luminosities need to be corrected for internal extinction due to dust. ([8]; and references therein). It is also possible to use Ly as star formation indicator, though extinction corrections are much higher, because the line is in the rest-frame ultraviolet. By using narrowband filter surveys it is possible to probe several of these emission lines at different redshifts.
2 WFILAS
The Wide Field Imager Lyman Alpha Search (WFILAS) is a narrowband filter survey designed to detect Ly emitting galaxies at . It was undertaken with the 2.2 m ESO/MPI telescope at Cerro La Silla with the Wide Field Imager (WFI). We targeted three fields to be able to assess the influence of cosmic variance. The fields are the Chandra Deep Field South (CDFS), a field near the South Galactic Pole (SGP) and the COMBO-17 S11 field. This yields a total sky coverage of 0.74 sq. degree, which gives a volume of Mpc3 at 111Throughout this paper we assume = 70 km s-1 Mpc-1, = 0.3 and = 0.7. Together with the relatively bright survey limit ( 24.024.5) we expect to find Ly emitting galaxies at the bright end of the luminosity function.
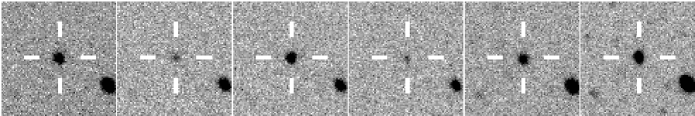
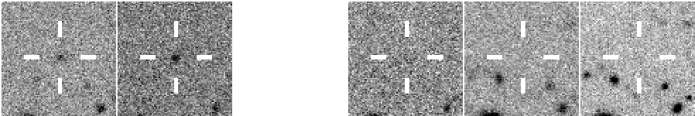
This survey is unique in its filter setup. Instead of the usual single narrowband filters we have used three neighbouring narrowband filters encompassed by one intermediate band filter (FWHM 220 Å). The particular narrow bandpass (FWHM 70 Å) of the narrowband filters provides a high contrast for line emitting galaxies. This is demonstrated in Figure 1. Two examples are given, a low redshift galaxy (spectrally confirmed to be an H emitting galaxy at ) and a candidate high redshift galaxy (still to be confirmed). In both cases the galaxy is visible in the narrowband image in which emission line resides, particulary in the low redshift case.
Using the images that were taken in the broadband and filters222The broadband and and a fraction of the intermediate band data have been taken from the COMBO-17 survey [13], we are able to minimise the contamination of low redshift line emitting galaxies, as Ly galaxies have no continuum bluewards of the Ly line. At the same time, we can use these low redshift candidates to measure the star formation rate at their respective redshifts. We will touch on this aspect of the survey in Section 5 in combination with the Taurus Tuneable Filter Field Galaxy Survey.
3 Confirmed Ly Emitter at
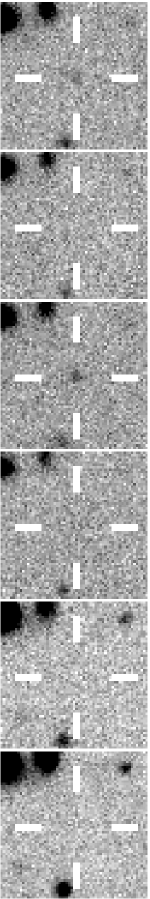
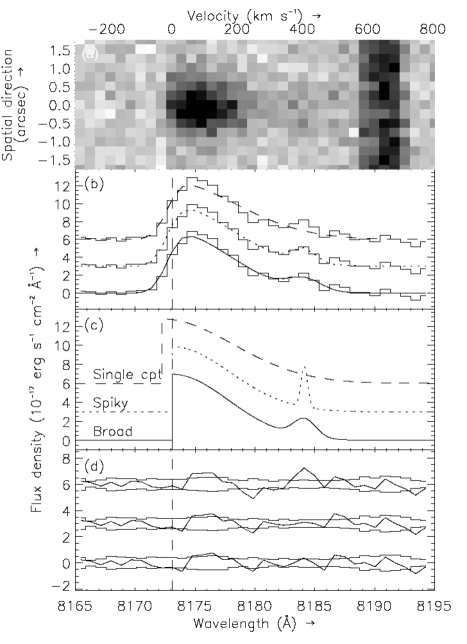
One of the candidate Ly emitting galaxies (see Figure 2 for the thumbnails) has been confirmed with follow-up spectroscopy [12]. The object shows a strong detection in only one of the narrowband images, , and also in the intermediate band image, . In both and there is no detection at the location of the object. In March 2004 the object J114334.98014433.9 was observed with VLT/FORS2 at medium resolution (R 3600). In the spectrum only one emission line is visible (see Figure 2). This line is clearly asymmetric, which is a strong indication for Ly [10]. Additionally, the lack of any other emission lines in our spectrum, such as H, [O ii], or [O iii], support that the line is Ly and not an emission line at lower redshift, e.g. H at . The line is not [O ii] 3726,3728, because the resolution of the spectrum is high enough to resolve the doublet. Based on these arguments, we conclude that the emission line is Ly.
From the spectrum we derived a line flux of 510-17 erg s-1 cm-2, making it one of the brightest Ly emitters at this redshift (cf. [2, 6]). This translates to a line luminosity of 1.81043 erg s-1, which is in accordance with the original survey goals of large volume and bright survey limit.
We fitted the emission line in a similar fashion as [6] with a truncated Gaussian (see Figure 2b,c). If we add a second, narrower and weaker Gaussian to the model, we are able to fit the second peak in the red wing of the line much better. Fitting in this way gave us two solutions, both with the second peak at 400 km s-1 redshifted from the truncated Gaussian profile, but one being broader and less strong than the other. We are unable to distinguish between the two models given their similar . In general, a second peak in the Ly line is a clear signature of an expanding shell of neutral hydrogen [1, 4].
4 Results of WFILAS
WFILAS has yielded 7 candidate Ly emitting galaxies at in the range of 131043 erg s-1, corresponding333To convert between luminosity and star formation rate, we use the conversion rate SFR(Ly) = 9.110-43 L(Ly) M⊙ yr-1, from [2] to 1030 M⊙ yr-1. One of these is the confirmed Ly emitter at (Section 3). The remaining candidates await spectral confirmation.
We have defined two samples: the entire sample and a statistically complete sample. The entire sample contains all the candidates. The statistically complete sample contains the candidates from our four deepest narrowband images. The candidates in the complete sample are also above a flux limit, which is set at = 23.38. Finally, we corrected the sample for completeness. In Figure 3 we have combined our completeness-corrected sample with a completeness-corrected sample from Ajiki [2]. Also shown are two Schechter function fits: one for the Ajiki sample alone, without the lowest two luminosity bins and a fit for the combined sample of WFILAS and Ajiki (without the lowest two luminosity bins). For both fits we assumed a slope of = -1.53, which [2] adopted from the H luminosity function at from [5], since neither sample goes deep enough to constrain this part of the luminosity function. It can be seen that the WFILAS sample complements other surveys, which do not cover a volume as large as that covered by WFILAS.


We note that the number of Ly emitting galaxies in the two faintest bins is considerably less than that predicteed by the fitted luminosity function. If this is not incompleteness, then the reason for the drop in the number density of faint sources needs to be understood. It might be related to the star formation rate. If the rate is too low, the associated H ii region will be too small and most Ly photons might be unable to escape the slowly expanding envelope of neutral hydrogen that surrounds the H ii region.
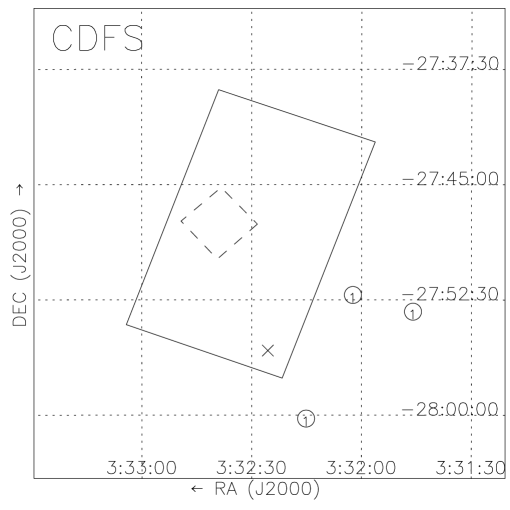
Another result from the WFILAS survey is that in one of the fields we find an overdensity of sources in the south-eastern part of our fields, the CDFS (see Figure 4). To enhance this result, we have added to our candidates the i′-dropout of [3] at , which is located in the same area of the field. This overdensity is entirely in agreement with the results of [11] and the recent discovery of an overdensity at a similar redshift in the Hubble Ultra Deep Field, which is enclosed in our field. This result demonstrates the importance of having a wide field of view not only to find the bright end of the luminosity function, but also to elucidate variations in large scale structures.
5 Taurus Tuneable Filter Field Galaxy Survey
One of the advantages of WFILAS is that it is also suitable to pick up low redshift galaxies (see Section 2 and Figure 1). In addition to this, we will use follow-up spectroscopy to the Taurus Tuneable Filter Field Galaxy Survey (TTFFGS; [7]). The TTFFGS is a survey designed to find low redshift emission line galaxies, such as H, H, [O ii] and [O iii]. For the survey we used the (now decommissioned) Taurus Tuneable Filter at the Anglo-Australian Telescope. The filter is a Fabry-Perot interferometer able to create very narrow filter passbands (FWHM 2030Å) with an Airy profile at a user-specified central wavelength. An order-sorting filter is necessary to remove other passbands due to multiple interference orders. The TTFFGS scanned through three OH-airglow windows at 7070 Å, 8150 Å and 9090 Å, which effectively creates several narrowband filters next to each other in each window. For H these intervals correspond to , 0.24 and 0.4, respectively. A total of 13 fields have been observed, each with a diameter of 9′, giving a total of 825 sq. arcmin. Forty percent of these fields have been targetted for spectroscopic follow-up with FORS2 on the VLT. These data are currently being processed.
Acknowledgements. EW wishes to acknowledge the Astronomical Society of Australia Travel Grant and the Alex Rodgers Travelling Scholarship for financial support.
References
- [1] Ahn S., Lee H., Lee H. M., 2003, MNRAS, 340, 863
- [2] Ajiki M., Taniguchi Y., Fujita S. S., et al., 2003, AJ, 126, 2091
- [3] Bunker A. J., Stanway E. R., Ellis R. S., et al., 2003, MNRAS, 342, L47
- [4] Dawson S., Spinrad H., Stern D., et al., 2002, ApJ570, 92
- [5] Fujita S. S., Ajiki M., Shioya Y., et al., 2003, ApJ, 586, L115
- [6] Hu E. M., Cowie L. L., Capak P, et al., 2004, AJ, 127, 563
- [7] Jones D. H., Bland-Hawthorn J., 2001, ApJ, 550, 593
- [8] Kewley L. J., Geller M. J., Jansen R. A, 2004, AJ, 127, 2002
- [9] Malhotra S., Rhoads J. E., Pirzkal N., 2005, ApJ, 626, 666
- [10] Stern D., Bunker A., Spinrad H., et al., 2000, ApJ, 537, 73
- [11] Wang J. X., Malhotra S., Rhoads J. E, 2005, ApJ, 622, L77
- [12] Westra E., Jones D. H., Lidman C. E., et al., 2005, A&A, 430, L21
- [13] Wolf C., Meisenheimer K., Rix H.-W., 2003, A&A, 401, 73