On the origin of anomalous velocity clouds in the Milky Way.
Abstract
We report that neutral hydrogen (H i) gas clouds, resembling High Velocity Clouds (HVCs) observed in the Milky Way (MW), appear in MW-sized disk galaxies formed in high-resolution Lambda Cold Dark Matter (CDM) cosmological simulations which include gas-dynamics, radiative cooling, star formation, supernova feedback, and metal enrichment. Two such disk galaxies are analyzed, and H i column density and velocity distributions in all-sky Aitoff projections are constructed. The simulations demonstrate that CDM is able to create galaxies with sufficient numbers of anomalous velocity gas clouds consistent with the HVCs observed within the MW, and that they are found within a galactocentric radius of . We also find that one of the galaxies has a polar gas ring, with radius , which appears as a large structure of HVCs in the Aitoff projection. Such large structures may share an origin similar to extended HVCs observed in the MW, such as Complex C.
Subject headings:
methods: N-body simulations – galaxies: formation – galaxies: ISM – Galaxy: evolution – Galaxy: halo – ISM: kinematics and dynamics1. Introduction
High Velocity Clouds (HVCs) are neutral hydrogen (H i) gas clouds with velocities inconsistent with galactic rotation (Wakker & van Woerden, 1997). From our vantage point within the Galaxy, they appear to cover a large portion of the sky relatively isotropically. HVCs do not appear to possess a stellar component (e.g. Simon & Blitz, 2002; Siegel et al., 2005) and their distances (and masses) are generally unknown. Direct distance constraints have only been made for a select number of HVCs (Wakker, 2001; Thom et al., 2006). There are still open questions as to whether HVCs are local to the Milky Way (MW) or distributed throughout the Local Group (LG); whether they are peculiar to the MW or are common in disk galaxies; whether they are gravitationally bound or pressure confined; whether they contain Dark Matter (DM); and their degree of metal-enrichment.
Pisano et al. (2004) report that there are no HVC-like objects with H i mass in excess of in three LG-analogs. They suggest that if HVCs are a generic feature, they must be clustered within of the host galaxy, ruling out the original Blitz et al. (1999) model in which HVCs are gas clouds distributed in filaments on Mpc-scales. Thilker et al. (2004) and Westmeier et al. (2005) find 16 HVCs around M31, with H i masses ranging from to . Most of the HVCs are at a projected distance from the disk of M31. Some clouds appear to be gravitationally dominated by either DM or as yet undetected ionized gas. They also found two populations of clouds, with some of the HVCs appearing to be part of a tidal stream, and others appearing to be primordial DM dominated clouds, left over from the formation of the LG. Finally, it has also been speculated that cooling instabilities in Cold Dark Matter (CDM) halos could lead to clouds within of MW type galaxies, with HVC-like properties (Maller & Bullock, 2004).
In this Letter, we report that these mysterious H i clouds also appear in MW-size disk galaxies formed in CDM cosmological simulations. We demonstrate that the simulated galaxies show HVCs comparable in population to the observed ones. We also find that large HVCs resembling Complex C appear in simulated galaxies. Therefore, we conclude that HVCs appear to be a natural byproduct of galaxy formation in the CDM Universe. The next section describes our methodology, including a brief description of the simulations and how we “observe” the simulated disk galaxies. In Section 3, we show our results and discuss our findings.
2. Methodology
We analyze two disk galaxy models found in cosmological simulations that use the multi-mass technique to self-consistently model the large-scale tidal field, while simulating the galactic disk at high resolution. These simulations include self-consistently many of the the important physical processes in galaxy formation, such as self-gravity, hydrodynamics, radiative cooling, star formation, supernova feedback, and metal enrichment. The disk galaxies we analyze correspond to “KGCD” and “AGCD” in Bailin et al. (2005), and we use these names hereafter. Both simulations are carried out with our galactic chemodynamics package GCD+ (Kawata & Gibson, 2003).
| Name | ||||||||||
|---|---|---|---|---|---|---|---|---|---|---|
| KGCD | 240 | 10 | 0.57 | 1.1 | 0.3 | 0.7 | 0.039 | |||
| AGCD | 270 | 21 | 0.87 | 1.5 | 0.3 | 0.65 | 0.045 |
The details of these simulations are given in Bailin et al. (2005). Table 1 summarizes the simulation parameters and the properties of the galaxies. Column 1 is the galaxy name; Column 2, the virial mass; Column 3, the virial radius; Column 4, the radial extent of the gas disk, defined as the largest radius at which we find gas particles in the disk plane. Columns 5 and 6 contain the mass of each gas and DM particle in the highest resolution region, and Columns 7 and 8 are the softening lengths in that region. The cosmological parameters are presented in Columns 9–11. Note that the spatial resolution for the gas is determined by the smoothing length of the smoothed particle hydrodynamics scheme. The minimum smoothing length is set to be half of the softening length of the gas particles (see Kawata & Gibson, 2003). The smoothing length depends on the density, and the average smoothing length in the simulated HVCs we focus on here is .
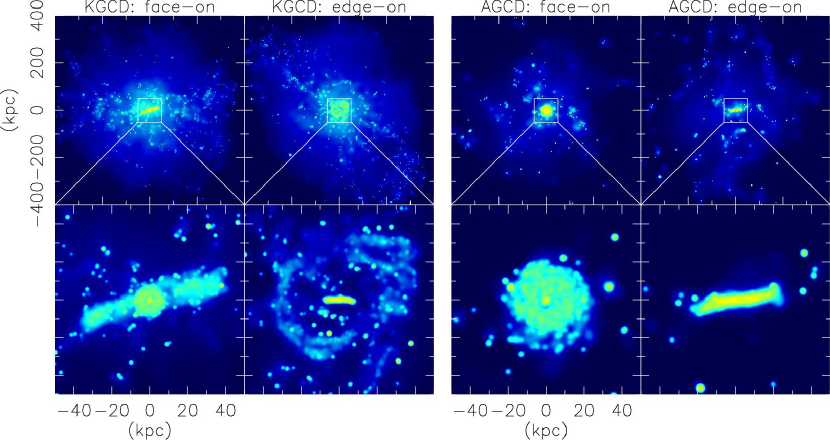
Both galaxies are similar in size and mass to the MW, and have clear gas and stellar disk components. Figure 1 shows edge-on and face-on views of the projected gas density of each galaxy at the final timestep. We use the simulation output at for KGCD, as contamination from low-resolution particles in the simulated galaxy start to become significant at this redshift. We use the output at for AGCD.
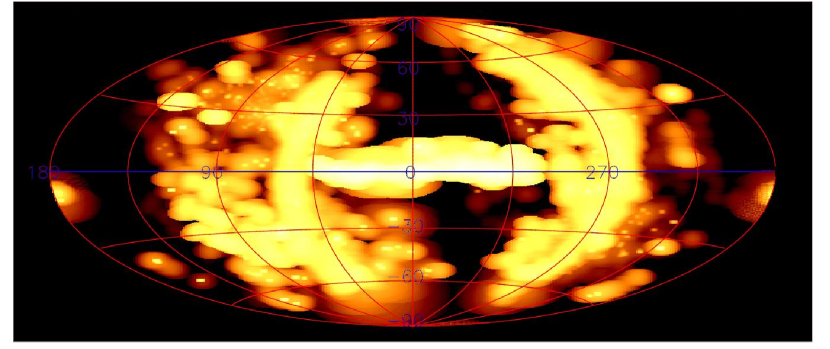
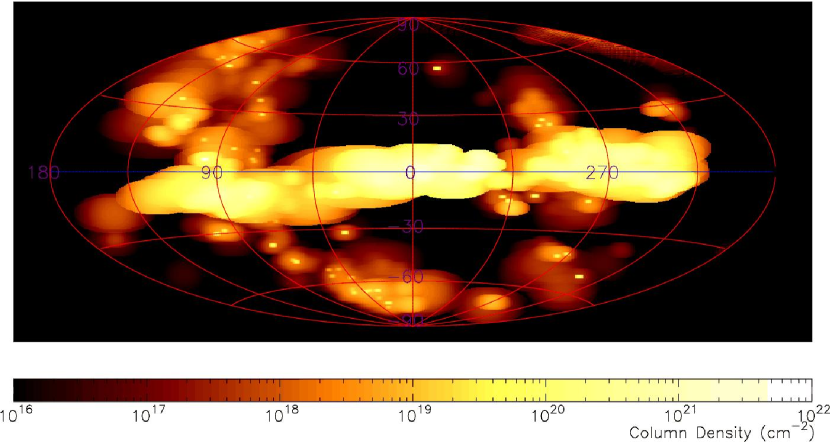
In order to compare the simulations with the HVC observations in the MW, we set the position of the “observer” to an arbitrary position on the disk plane of the simulated galaxies, with galactocentric distance of , and “observe” the H i column density and velocity of the gas particles from that position. Figure 2 demonstrates the H i column density of HVCs using all-sky Aitoff projections. Here, we define HVCs as consisting of gas particles with absolute lines-of-sight velocities, , deviating from the Local Standard of Rest (LSR) by more than —Figure 2 shows the H i column density of these gas particles with . We set the rotation velocity of the LSR to , similar to that of the MW Lockman et al. (2002). We can confirm that both simulated galaxies have gas disks rotating at . In this paper, results are based only on those particles within two virial radii (; see Table 1). We have also confirmed that the results are not sensitive to the cutoff radius chosen for column densities . We only display results for one chosen observer, however we have confirmed the generality of these results, with the sky coverage fraction typically changing by no more than 20% for a given column density, as we change the observer’s position and/or we analyze other outputs of the simulation near the final redshift.
Our chemodynamical simulation follows the hydrogen and other elemental abundances for each gas particle, but does not calculate the ionization fraction of each species. Instead, the H i mass for each gas particle is calculated assuming collisional ionization equilibrium (CIE). The CIE neutral hydrogen fraction is estimated using Cloudy94 (Ferland et al., 1998). We multiply the fraction by the hydrogen abundance, and obtain a H i mass fraction for each particle as a function of its temperature. We ignore any effect from the background radiation field.
3. Results and discussion
Figure 2 demonstrates that both galaxies have a significant number of HVCs, with column densities comparable to those observed by Wakker (1991). KGCD displays several large linear HVCs at galactic longitudes and . These components correspond to the outer ring structure seen at a galactocentric radius of in Figure 1. We name this structure the “polar gas ring”, and discuss it later.
To compare the HVC population of our simulations with the MW HVCs quantitatively, Figure 3 shows the fraction of sky covered by HVCs as a function of limiting column density for both simulations and for the observations in Lockman et al. (2002). In this plot, we exclude the area with low galactic latitude , to avoid contamination by the disk component (the sample of sightlines in Lockman et al., 2002 was limited in a similar fashion). As is obvious from Figure 2, KGCD has more high column density HVCs than AGCD, and almost all of the sky is covered down to . At a fixed column density, the sky coverage in the simulations bracket the observed sky coverage in the MW. Note that we ignore any effects of background radiation. It is expected that such a field would decrease the population of HVCs with Galactocentric distance less than or (Maloney, 1993; Bland-Hawthorn & Maloney, 1997, 1999). Thus, since as mentioned below, the distances of the simulated HVCs are greater than , our estimated coverage fractions should be interpreted as an upper limit for , and a lower limit for , where the highest column density HVCs may not be fully resolved. With these caveats, KGCD appears to have a sufficient population of HVCs to explain the observed population of HVCs within the MW. We conclude that current cosmological simulations can produce MW-size disk galaxies with similar populations of HVCs to those in the MW. The differences between KGCD and AGCD may demonstrate real differences in the populations of HVCs among disk galaxies. However, to understand the causes of such differences, we need a larger sample of high-resolution simulated disk galaxies, the subject of a future study.

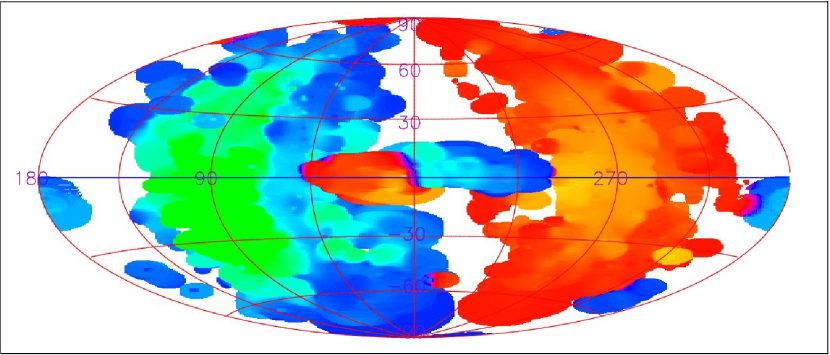
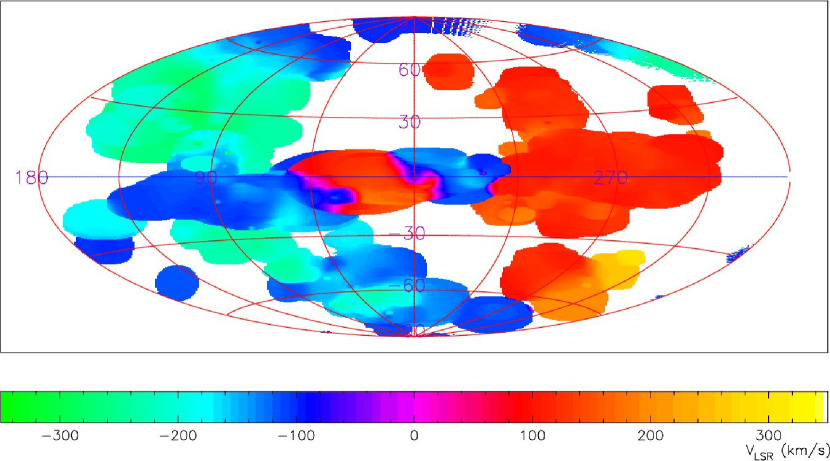
We find that velocities of the simulated HVCs seen in Figure 4, are distributed similarly to those observed by Putman et al. (2002). Overall, the clouds between and have a negative velocity, while the clouds between and have a positive velocity. This is natural, since the LSR is moving towards . In KGCD, we find that there is a relatively large HVC complex whose velocity is very high, . These very high velocity clouds (VHVCs) are located between and , in the top panel of Figure 4. The MW also has such VHVCs in the Anti-Center complex (Hulsbosch, 1978; Hulsbosch & Wakker, 1988). The galactocentric distance to the VHVC in KGCD is –, and we find that the cloud is a gas clump which has recently fallen into the galaxy. We convert the H i mass for each particle into a H i flux using (Wakker & van Woerden, 1991), where the H i mass is in , total H i flux in is , and distance from observer to the particle in is . We find the H i mass of the VHVC complex is , and the total H i flux (for the chosen observer) is . Since it is infalling on a retrograde orbit, its velocity relative to the LSR becomes very large depending on its location relative to the observer. Therefore, the observed VHVCs may be explained by such infalling gas clumps within the Galaxy. It is also worth noting that we do not find any associated stellar or DM components in the simulated VHVCs.
In the simulations, we are able to measure the distance of HVCs—data which are not yet generally available for the real MW. In Figure 5, we show a flux-weighted histogram of the galactocentric distances, , of the high velocity gas particles with . In both simulations, less than 1% of the H i flux visible in Figure 2 originates from HVCs with . This is consistent with the aforementioned limits established by Pisano et al. (2004).

It is also clear that most of the emission in the KGCD simulation results from the polar gas ring, whose radius is . The mass of this ring (including low velocity gas) is , of which is H i. Although there is no prominent polar ring in AGCD, at larger distances, the flux distribution is found to follow that of the KGCD simulation.
Figure 2 demonstrates that the polar gas ring forms a linear high velocity structure found in all quadrants of the sky. Large HVC components, such as Complex C and the Magellanic Stream, are well known in our MW, and several authors (e.g. Haud, 1988) argue that the MW is surrounded by a polar gas ring. Neglecting the Magellanic Stream, which has likely originated from the infalling Magellanic clouds (Gardiner & Noguchi, 1996; Yoshizawa & Noguchi, 2003; Connors et al., 2005), the largest HVC structure is Complex C. We measure the mass of the HVC ring in one quadrant as . If we place Complex C at a galactocentric distance of (only a lower limit has been obtained for its galactocentric distance of ; van Woerden et al., 1999), its mass would be . Nevertheless, this indicates that there is enough H i gas to create such large observed HVCs in the simulated galaxy. In KGCD, the polar gas ring is a relatively recently formed structure that begins forming at redshift , and prior to this time, the associated gas particles are found flowing inward along filamentary structures. Thus, this simulated ring structure demonstrates that current CDM numerical simulations can explain the existence of such large HVCs like Complex C, as recently accreted gas which rotates in a near-polar orbit. On the other hand, AGCD does not show such a prominent large structure. This may indicate that such HVC structures are not common in all disk galaxies. Although this study focuses on only two simulated galaxies due to the limit of our computational resources, more samples of high-resolution simulated galaxies would elucidate how common such large structures are, and what kind of evolution history is required to make such HVCs.
We also analyze the metallicity of the simulated HVCs. In KGCD, we find that the prominent HVCs have H i flux weighted metallicities of with a flux weighted mean of . This is much lower than the metallicities of the observed HVCs in the MW, (Wakker, 2001). The polar gas ring seen in KGCD has a metallicity of with a mean of , which is lower than the observed metallicity of Complex C, (e.g. Gibson et al., 2001; Richter et al., 2001). Thus, our numerical simulations seem to underestimate the metallicity of the later infalling gas clouds. This is likely because we adopt a weak supernova feedback model in our simulations. If we use a model with strong feedback, more enriched gas is blown out from the system at high redshift, which can enrich the inter-galactic medium which then falls into galaxies at a later epoch.
The majority of the simulated HVCs, including the polar gas ring, do not have any obviously associated stellar or DM components, which is consistent with current observations (Simon & Blitz, 2002; Siegel et al., 2005). However, a few compact HVCs are found to be associated with stellar components. It would be interesting to estimate how bright they are, and if they are detectable within the current observational limits. Unfortunately, the resolution of the current simulations are too poor to estimate the luminosity, and it is also likely that our simulations produce too many stars due to our assumed minimal effect of supernova feedback.
The clouds in the simulation may be destroyed by effects that our simulations are not able to reproduce accurately. The resolution and nature of the SPH simulations make it difficult to resolve shocks between the HVCs and the MW halo; however simple analytic estimates show that there will not be strong shocking of the HVCs due to the low density of the halo. Indebetouw & Shull (2004), using more detailed simulations, argue that the Mach number of the HVCs are only –, marginally sufficient to form shocks, and heating the leading of the HVC. Quilis & Moore (2001) show that the lifetime of such HVCs in the presence of shocks is , long enough for our HVCs to survive. Maller & Bullock (2004) discuss various physical processes, including conduction, evaporation, ram-pressure drag, Jeans instabilities, and Kelvin–Helmholtz instabilities that limit the mass ranges of stable clouds. The most massive HVC apparent in our simulations is found to be , and the mass resolution and hence smallest resolvable HVC in our simulations are ; clouds of both extremes are clearly within the stable mass ranges summarized in fig. 6 of Maller & Bullock (2004). Therefore, the simulated clouds are also expected to be stable.
We report that HVCs seem to be a natural occurrence in a CDM Universe. We emphasize that the galaxies that result from our simulations were not created specifically to reproduce the MW exactly—they were selected for resimulation at higher resolution on the basis of being disk-like galaxies. However, we have serendipitously discovered that simulated galaxies that are similar in size to the MW naturally contain H i gas in the vicinity of the disk that are similar to the anomalous velocity features seen in the MW.
References
- Bailin et al. (2005) Bailin, J., et al. 2005, ApJ, 627, L17
- Bland-Hawthorn & Maloney (1997) Bland-Hawthorn, J., & Maloney, P. R. 1997, Publications of the Astronomical Society of Australia, 14, 59
- Bland-Hawthorn & Maloney (1999) —. 1999, ApJ, 510, L33
- Blitz et al. (1999) Blitz, L., Spergel, D. N., Teuben, P. J., Hartmann, D., & Burton, W. B. 1999, ApJ, 514, 818
- Connors et al. (2005) Connors, T. W., Kawata, D., & Gibson, B. K. 2005, arXiv:astro-ph/0508390
- Ferland et al. (1998) Ferland, G. J., Korista, K. T., Verner, D. A., Ferguson, J. W., Kingdon, J. B., & Verner, E. M. 1998, PASP, 110, 761
- Gardiner & Noguchi (1996) Gardiner, L. T., & Noguchi, M. 1996, MNRAS, 278, 191
- Gibson et al. (2001) Gibson, B. K., Giroux, M. L., Penton, S. V., Stocke, J. T., Shull, J. M., & Tumlinson, J. 2001, AJ, 122, 3280
- Haud (1988) Haud, U. 1988, A&A, 198, 125
- Hulsbosch (1978) Hulsbosch, A. N. M. 1978, A&A, 66, L5
- Hulsbosch & Wakker (1988) Hulsbosch, A. N. M., & Wakker, B. P. 1988, A&AS, 75, 191
- Indebetouw & Shull (2004) Indebetouw, R., & Shull, J. M. 2004, ApJ, 605, 205
- Kawata & Gibson (2003) Kawata, D., & Gibson, B. K. 2003, MNRAS, 340, 908
- Lockman et al. (2002) Lockman, F. J., Murphy, E. M., Petty-Powell, S., & Urick, V. J. 2002, ApJS, 140, 331
- Maller & Bullock (2004) Maller, A. H., & Bullock, J. S. 2004, MNRAS, 355, 694
- Maloney (1993) Maloney, P. 1993, ApJ, 414, 41
- Pisano et al. (2004) Pisano, D. J., Barnes, D. G., Gibson, B. K., Staveley-Smith, L., Freeman, K. C., & Kilborn, V. A. 2004, ApJ, 610, L17
- Putman et al. (2002) Putman, M. E., et al. 2002, AJ, 123, 873
- Quilis & Moore (2001) Quilis, V., & Moore, B. 2001, ApJ, 555, L95
- Richter et al. (2001) Richter, P., et al. 2001, ApJ, 559, 318
- Siegel et al. (2005) Siegel, M. H., Majewski, S. R., Gallart, C., Sohn, S. T., Kunkel, W. E., & Braun, R. 2005, ApJ, 623, 181
- Simon & Blitz (2002) Simon, J. D., & Blitz, L. 2002, ApJ, 574, 726
- Thilker et al. (2004) Thilker, D. A., Braun, R., Walterbos, R. A. M., Corbelli, E., Lockman, F. J., Murphy, E., & Maddalena, R. 2004, ApJ, 601, L39
- Thom et al. (2006) Thom, C., Putman, M. E., Gibson, B. K., Christlieb, N., Flynn, C., Beers, T. C., Wilhelm, R., & Lee, Y. S. 2006, ApJ, 638, L97
- van Woerden et al. (1999) van Woerden, H., Peletier, R. F., Schwarz, U. J., Wakker, B. P., & Kalberla, P. M. W. 1999, in ASP Conf. Ser. 165: The Third Stromlo Symposium: The Galactic Halo, 469–+
- Wakker (1991) Wakker, B. P. 1991, A&A, 250, 499
- Wakker (2001) —. 2001, ApJS, 136, 463
- Wakker & van Woerden (1991) Wakker, B. P., & van Woerden, H. 1991, A&A, 250, 509
- Wakker & van Woerden (1997) —. 1997, ARA&A, 35, 217
- Wakker et al. (2003) Wakker, B. P., et al. 2003, ApJS, 146, 1
- Westmeier et al. (2005) Westmeier, T., Braun, R., & Thilker, D. 2005, A&A, 436, 101
- Yoshizawa & Noguchi (2003) Yoshizawa, A. M., & Noguchi, M. 2003, MNRAS, 339, 1135