The Cosmological Mean Density and its Local Variations Probed by Peculiar Velocities
Abstract
Peculiar velocities throughout the region of the Local Supercluster are reconstructed by two different orbit-retracing methods. The requirement of the optimal correlation between the radial components of reconstructed velocities and the observed peculiar velocities derived from our extensive new catalog of distances puts stringent constraints on the values of the cosmological parameters. Our constraints intersect those from studies of microwave background fluctuations and statistical properties of galaxy clustering: the ensemble of constraints are consistent with . While motions throughout the Local Supercluster provide a measure of the mean ratio of mass to light, there can be large local fluctuations. Our reconstruction of the infall velocities in the immediate vicinity of the Virgo Cluster shows that there is a mass-to-light anomaly of a factor of 3 to 6 between groups in the general field environment and the heavily populated Virgo Cluster.
Subject headings:
dark matter — cosmological parameters — methods:analytical and numerical1. Introduction
Cosmological parameters have been significantly constrained by the combined analyses of the data mainly from Cosmic Microwave Background (CMB) radiation, large-scale galaxy distribution, supernova observations and cosmic shear field [see e.g. (Tegmark et al., 2004)]. Here, we demonstrate that analysis of the peculiar velocity field can tighten the constraints on cosmological models because error ellipses are strongly skewed to those of WMAP and SDSS in the parameter space of density and age. Two complementary theoretical methods are used in this paper to generate orbits that give velocities to be compared with observations. Peculiar velocities are defined by a large number of quality distance measures. Good distances are available for 1400 galaxies within 3,000 km s-1.
The two variational methods used here are based on the principle that galaxies as mass-tracers follow orbits which are the stationary points of the Euler-Lagrange action. Our first approach, the Least Action (LA) method (Peebles, 1989), describes orbits in the nonlinear collapse regime, though recovered trajectories are non-unique due to lack of knowledge of the initial positions of galaxies and because of orbit-crossing (i.e. multisteaming). On large scales, a unique reconstruction is possible since the displacement of dark matter fluid derives from a potential and multistreaming is less severe. These properties are at the basis of our second method, MAK (Frisch et al., 2002). The methods are applied at the Local Supercluster scale for the determination of the cosmological mean density and at the cluster scale for the specification of its local variations.
Allowing for statistical and systematic errors and considering all the methods in tandem, we show that the MAK, LA, WMAP and SDSS results give preference to a small region in parameter space favouring a low value of for the density parameter.
On cluster scales, reconstruction of the amplitude of the first-approach infall velocities provides a determination of the mass of the clusters at radii beyond the virialized region; radii greater than those explored by X-ray or lensing studies. We show that the high amplitude observed in the infall region requires an assignment of to the Virgo Cluster (where the luminosities are in the B band).
2. Catalog of Nearby Galaxies and distances
The catalog of galaxies, is a 40% augmentation of the Nearby Galaxies Catalog (Tully, 1987), now including 3300 galaxies within 3,000 km s-1. This depth is more than twice the distance of the dominant component, the Virgo Cluster, and the completion to this depth in the current catalog compares favorably with other all-sky surveys [e.g., 2MASS (Jarrett, 2004)]. The catalog has the following properties. (i) All entries are given a detailed group and filament assignment (or non-assignment if isolated). (ii) The catalog is supplemented by an all-sky complete sample of X-ray selected clusters (Kocevski et al., 2004) in the shell 3,000–8,000 km s-1 to provide a description of potential influences on very large scales. (iii) ‘Fake’ galaxies are added at low Galactic latitudes to avoid an underdensity in the zone of obscuration due to lost information. (iv) Correction is made for the loss of light with distance caused by an apparent magnitude cutoff in the construction of the catalog.
The second observational component is an extended catalog of galaxy distances. Information from four techniques has been integrated: the Cepheid variable (Freedman et al., 2001), Tip of the Red Giant Branch (Karachentsev, 2003; Lee et al., 1993), Surface Brightness Fluctuation (Tonry & Schneider, 1988; Tonry et al., 2001), and Luminosity–Linewidth (Tully & Fisher, 1977; Tully & Pearce, 2000) methods. In all, there are over 1400 galaxies with distance measures within the 3,000 km s-1 volume; over 400 of these are derived by at least one of the first three ‘high quality’ techniques. In the present study, distances are averaged over groups because orbits cannot meaningfully be recovered on sub-group scales. The present catalog is assembled into 1234 groups (including groups of one) of which 633 have measured distances. These observational components will be described in detail in a later publication.
3. Techniques: the LA and MAK methods
Peebles pioneered the Least Action (LA) method (Peebles, 1989, 1994, 1995) that requires orbits to satisfy the stationary point of the Euler-Lagrange action, the integral over time of the Lagrangian. Hence, least action searches for the minimum of
| (1) |
where summation over repeated indices and is implied, denotes the present time, the path of the th particle with mass is , is the mean mass density, and the present value of the expansion parameter is .
Individual orbits are constrained by the mixed boundary conditions that peculiar velocities were initially negligible (they subsequently grew from gravitational perturbations) and the known elements of position and velocity today. The other piece of information known for roughly half the elements is the aforementioned distances. This information is used to discriminate between models. A given model involves a specification of cosmological parameters and the assignment of mass to each of the elements. Orbits are found within the context of a specified model that are consistent with the boundary condition constraints on angular positions and radial velocities. A component of the end point of an orbit is its distance which can be compared with the observed distance. Different models result in different distances. The quality of a model can be evaluated by a statistical measure of the differences between observed and model distance moduli, and respectively. A parameter can be calculated for each element, , with a measured distance, , where is the uncertainty assigned to . A comparison of the relative distribution of values provides a sensitive discriminant between good and bad models (Shaya et al., 1995; Phelps, 2002).
Galaxy flows are not sensitive to any uniform repulsive dark energy (Lahav et al., 1991; Shaya et al., 1995). Measurements of the lowest frequency peak in the microwave background fluctuation spectrum strongly indicate, and we accept, that the Universe has a flat topology, whence where characterizes the mean density of dark energy and characterizes the mean density of matter with respect to the critical density for a flat Universe in matter alone. Specification of and the Hubble Constant, H0, which describes the mean expansion rate of the Universe, in the context of a flat Universe uniquely specifies the age of the Universe, .
The Least Action orbits are a reflection of the interactions of masses over the age of the Universe. As an initial approximation, it is assumed that the relationship between mass and light is constant so the mass assigned to an element in the catalog with luminosity is . Consequently, a cosmological model to be explored is specified by two fundamental parameters: and . For a given choice of and , orbits are constructed, model distances at the end points are determined and compared with observed distances, and the match provides a measure that can be compared with alternative models. Discrimination between results over the domain of ( choices based on the measure gives specification of a best model.
The alternate technique that will be implemented here is the Monge-Ampère-Kantorovich (MAK) reconstruction (Frisch et al., 2002; Mohayaee et al., 2003; Brenier et al., 2003). This method provides a recipe for the orbits that is unique to the degree that orbits can be described as following straight lines under suitable coordinate transformations. Orbits in the MAK reconstruction are minima of the action which assume a Lagrangian mapping that can be described in terms of a potential as . Here, is the current Eulerian position and is the initial Lagrangian position. The potential is assumed to be convex; ie, orbit-crossing is excluded. With these conditions, orbits are reconstructed uniquely by an assignment algorithm that finds the minimum in the ensemble of orbit distances summed in quadrature. Hence, MAK search for the minimum of the discretized action
| (2) |
Initial positions , are assigned to final positions . For each final position , there are possible initial positions and only the one that minimizes the sum in the expression (2) is allowed. A brute-force assignment algorithm would have a complexity of , but can be reduce to a polynomial complexity (specifically, so far to ). It is insightful to note that the least action variation (1) reduces to MAK optimization (2) for inertial trajectories (i.e. where particles move with their initial velocities).
The distances, , permit an extraction of peculiar velocities where is the observed velocity of an object in the galactic standard of rest. The relationship between redshift and real space displacements of the elements is estimated using the approximation that galaxies trace mass on inertial trajectories (Zel’dovich, 1970): where is the peculiar velocity vector and . Consequently, a specific model defines positions that can be tested against observed positions in the same way that is done in the Least Action analysis.
An advantage of Least Action is that it potentially can be used in the highly non-linear regime where orbits are strongly curved. An advantage of MAK is that it recovers orbits uniquely and quickly, hence can be used with the very large catalogs that are becoming available. By using the two methods on the identical catalogs, with the identical distance constraints, it is affirmed that the two methods recover similar results in the regimes where they are both applicable.
Both methods have been tested on N-body simulations and found to result in modest underestimations of the known densities. Underestimates are anticipated because, at one extreme, mass that is not strongly clustered on the scale of the survey has little dynamical consequence and, at the other extreme, complex shell-crossing orbits cannot be modeled. Analysis of MAK reconstructions in 12 cosmological simulations with different initial fluctuation characteristics discussed by Mohayaee et al. (2005) resulted in recovery of () of the known model density. In the case of Least Action, it has been appreciated that mass can be underestimated on small scales (Branchini & Carlberg, 1994; Branchini et al., 2002). A quantitative measure of the effect is found using our Least Action reconstruction algorithms with an N-body simulation with , , evaluated by placing the observer at multiple locations to test for cosmic variance. Recovered densities were of the model density (Phelps, Desjacques, and Nusser; ongoing work). The estimates that we quote for include adjustments for the systematics of 20% and 30% for MAK and Least Action, respectively.
4. Results: I. determination of
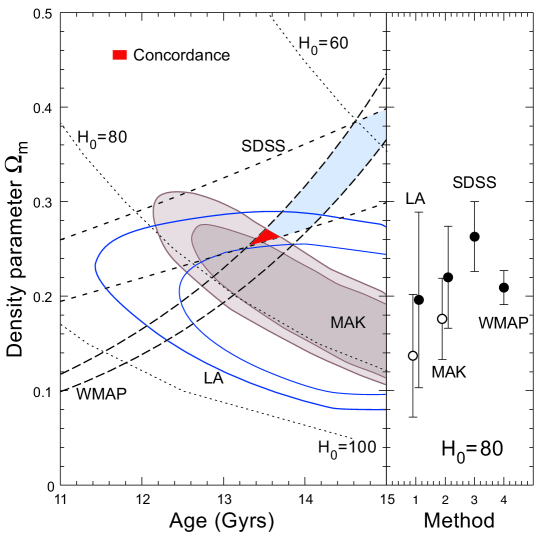
The results of the two methods are summarized in Fig. 1 where contours of the parameter are plotted in the domain {,}. In the case of the Least Action analysis, mass density is derived from values by accepting the mean band luminosity density of the Universe determined from SDSS Blanton et al. (2003) with reddening corrections. We use , a transform with uncertainty.
The error ellipses from the MAK and LA studies are elongated. With a linear analysis the elliptical troughs would open to infinity, but non-linear effects create a specific minimum along each trough. At a fixed age, , there are relatively tight constraints on requirements. If shorter ages are entertained, then higher densities are required to arrive at the observed dynamical state in the specified time. The contrary dependence between density and time are seen in the results from the microwave background WMAP (Spergel, 2003) and galaxy redshift SDSS (Tegmark et al., 2004) experiments that are also superimposed on Fig. 1. Only a small domain around Gyr lies within or near the contours of all the methodologies. With the constraint consistent with the zero point of the distance estimates, there is good agreement between the WMAP, SDSS, MAK, and LA measures of the density parameter: . The low value of obtained here is consistent with that found from divers recent studies (Bahcall et al., 2003; Ostriker, 2003; van den Bosch et al., 2003; Cole et al., 2005).
5. Results: II. the mass of Virgo Cluster
The velocity field analyses discussed above make the simplistic assumption of constant . There has been evidence in the literature, though, for large variations in with environment (Marinoni & Hudson, 2002; van den Bosch et al., 2003; Eke et al., 2004; Tully, 2005; van den Bosch et al., 2005; Parker et al., 2005). Here we note that galaxy flows near the Virgo Cluster contradict the hypothesis of constant . The high velocities of infall suggest a much larger for the cluster than the value consistent with a good fit over the full region within 3,000 km s-1. The critical galaxies for this discussion lie outside the cluster on the plane of the sky so only a modest component of the infall motion is projected into the line of sight but there is no confusion with cluster membership. Galaxies infalling from the foreground of the cluster are redshifted with respect to the cluster and galaxies infalling from the background are blueshifted. If one could imagine many test particles distributed along a line of sight, they would create a wave in velocity as a function of distance with the same velocity arising at three distances (Tonry & Davis, 1981) – two located within the infall region and one located at the cosmic expansion position. The amplitude of the peaks of the ‘triple-value’ waves depend on the mass, , interior to the position associated with the peaks, . The envelope of observed infall velocities with provides a description (Tully & Shaya, 1984) of the run of . The outermost caustic of the Virgo Cluster proper (the radius of second turnaround) is at Mpc from the center of the cluster. Galaxies on first infall acquire very high radial velocities at 2–4 Mpc from the Virgo core.
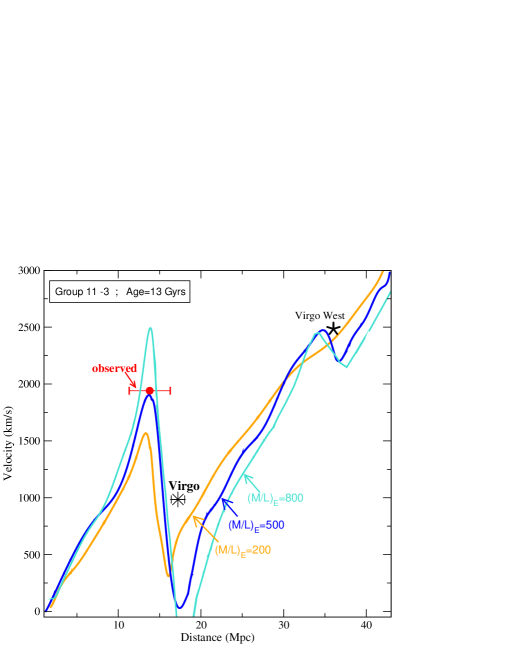
An example is given in Fig. 2. The run of velocities with distance are what is expected along the specific line of sight of the 11–3 group in the Nearby Galaxies Catalog with three different assumptions regarding the mass of the Virgo Cluster. The observed distance and velocity of the 11–3 group is indicated in the figure. It is clear that the 11–3 group is at one of the two infall locations (or the location where the two infall positions become degenerate at the tip of the triple-value curve) rather than at the cosmic expansion position around 30 Mpc.
The total mass within 3,000 km s-1 is the same in all 3 models to ensure that the global is near the minimum of the trough in Fig. 1, however the distribution of mass between the elliptical rich and spiral rich groups is modified between models. Here, Gyr. In the case of the curve with the smallest swing, all components are given the same . The intermediate curve is generated with the elliptical-dominated groups (including the Virgo Cluster) given and the spiral-dominated groups given . The curve with the largest swing reflects and . In the model illustrated by the middle curve in Fig. 2, the cluster is given the necessary and just sufficient mass of .
The 11–3 group and a couple of others provide the greatest demands on the mass of the cluster and are inferred to lie near a tip along a triple-value curve. An adequate description of the amplitude of their infall velocities requires an assignment of to the Virgo Cluster if Gyr. As with the overall Supercluster modeling, less cluster mass is required if given more time (Tully & Shaya, 1984): e.g., suffices if Gyr. In both these 13 and 14 Gyr cases, as the mass assigned to the cluster is augmented, the models require a reduction of mass assigned to the field to remain at the minimum of the trough of Fig. 1. The ratio of cluster, , to field, , mass to light values is with the mass assignments required to explain the infall motions. This factor 3 probably underestimates the difference between Virgo and bound groups in the field because some of the mass contributing to the field ratio lies outside the groups. Studies of the dynamics of nearby groups (Tully, 2005) suggest that bound groups of spiral galaxies in the field have . The mass to light ratio of the Virgo Cluster is 5–6 times larger.
6. Conclusions
Our first result on the mean density of the Universe complements the WMAP and SDSS measurements of the density parameter because the error ellipses in the domain are steeply inclined to each other. A narrow range of parameter space around Gyr, is permitted by the combined experiments.
Our second result concerns the local fluctuations around this mean density. Although most of the blue light in the local Universe is associated with the spiral field, there is close to parity in the partition of mass between the spiral field and the Virgo Cluster. The value associated with the E/S0 dominated Virgo Cluster is significantly higher than that associated with the spiral dominated field. The complex problem of variations with environment shall be discussed in a future more-detailed paper.
We thank Ed. Bertschinger, J. Colin, U. Frisch, M. Hénon, G. Lavaux, P.J.E. Peebles, S. Phelps, E. Shaya and J. Silk for discussions, collaboration and support. RM was supported by a Marie Curie fellowship. RBT acknowledges support from the BQR program of the Observatoire de la Côte d’Azur, the French Hautes Niveau of EGIDE, a JPL Space Interferometry Mission contract, and STScI and NSF awards.
References
- Bahcall et al. (2003) Bahcall, N.A. et al., ApJ, 585, 182–190 (2003).
- Blanton et al. (2003) Blanton, M.R., et al. Astrophys. J. 592, 819–838 (2003).
- Branchini & Carlberg (1994) Branchini, E.& Carlberg, R.G. Astrophys. J. 434, 37–45 (1994).
- Branchini et al. (2002) Branchini, E., Eldar, A. & Nusser, A. MNRAS 335, 53–72 (2002).
- Brenier et al. (2003) Brenier, Y., Frisch, U., Hénon, M., Loeper, S., Matarrese, S., Mohayaee, R., & Sobolevskii, A. Mon. Not. R. Astron. Soc. 346, 501–524 (2003).
- Cole et al. (2005) Cole, S., et al. 2005, MNRAS, (astro-ph/0501174)
- Eke et al. (2004) Eke, V.R., et al. 2004, MNRAS, 355, 769
- Freedman et al. (2001) Freedman, W.L., et al. Astrophys. J. 553, 47–72 (2001).
- Frisch et al. (2002) Frisch, U., Matarrese, S., Mohayaee, R. & Sobolevskii, A. Nature, 417, 260–262 (2002).
- Jarrett (2004) Jarrett, T.H. Publ. Astron. Soc. Australia, 21, 396–403 (2004).
- Karachentsev (2003) Karachentsev, I.D., et al. Astron. Astrophys., 398, 479–491 (2003).
- Kocevski et al. (2004) Kocevski, D.D., Mullis, C.R.& Ebeling, H. Astrophys. J. 608, 721–730 (2004).
- Lahav et al. (1991) Lahav, O., Lilje, P.B., Primack, J.R., & Rees, M.J. Mon. Not. R. Astron. Soc. 251, 128–136 (1991).
- Lee et al. (1993) Lee, M.G., Freedman, W.L.& Madore, B.F. Astrophys. J. 417, 553–559 (1993).
- Marinoni & Hudson (2002) Marinoni, C., & Hudson, M.J. 2002, ApJ, 569, 101
- Mohayaee et al. (2003) Mohayaee, R., Frisch, U., Matarrese, S. & Sobolevskii, A. Astron. Astrophys., 406, 393–401 (2003).
- Mohayaee et al. (2005) Mohayaee, R., Mathis, H., Colombi, S. & Silk, J. astro-ph/0501217, MNRAS in press.
- Ostriker (2003) Ostriker, J.P, Nagamine, K., Cen, R. & Masataka, F., ApJ, 597, 1–8 (2003).
- Parker et al. (2005) Parker, L.C., Hudson, M.J., Carlberg, R.G., & Hoekstra, H., (astro-ph/0508328)
- Peebles (1989) Peebles, P.J.E. Astrophys. J. 344, L53–L56 (1989).
- Peebles (1994) Peebles, P.J.E. Astrophys. J. 429, 43–65 (1994).
- Peebles (1995) Peebles, P.J.E. Astrophys. J. 449, 52–60 (1995).
- Phelps (2002) Phelps, S.D. Astrophys. J. 575, 1–6 (2002).
- Shaya et al. (1995) Shaya, E.J., Peebles, P.J.E., & Tully, R.B. Astrophys. J. 454, 15–31 (1995).
- Spergel (2003) Spergel, D.N., et al. Astrophys. J. Suppl. 148, 175–194 (2003).
- Tegmark et al. (2004) Tegmark, M., et al. Phys. Rev. D, 69, 103501–103527 (2004).
- Tonry & Davis (1981) Tonry, J.L. & Davis, M. Astrophys. J. 246, 680–695 (1981).
- Tonry & Schneider (1988) Tonry, J.L. & Schneider, D.P. Astron. J. 96, 807–815 (1988).
- Tonry et al. (2001) Tonry, J.L., Dressler, A., Blakeslee, J.P., Ajhar, E.A., Fletcher, A.B., Luppino, G.A., Metzger, M.R. & Moore, C.B. Astrophys. J. 546, 681–693 (2001).
- Tully & Fisher (1977) Tully, R.B. & Fisher, J.R. Astron. Astrophys., 54, 661–673 (1977).
- Tully & Pearce (2000) Tully, R.B. & Pierce, M.J. Astrophys. J. 533, 744–780 (2000).
- Tully & Shaya (1984) Tully, R.B. & Shaya, E.J. Astrophys. J. 281, 31–55 (1984).
- Tully (1987) Tully, R.B. Nearby Galaxies Catalog, Camb. Univ. Press (1987).
- Tully (2005) Tully, R.B. Astrophys. J. 618, 214–226 (2005).
- van den Bosch et al. (2003) van den Bosch, F.C., Mo, H.J., & Yang, X. 2003, MNRAS, 345, 923
- van den Bosch et al. (2005) van den Bosch, F.C., Yang, X., Mo, H.J., & Norberg, P. 2005, MNRAS, 356, 1233
- Zel’dovich (1970) Zel’dovich, Ya.B. Astron. & Astrophys. 5, 84–89 (1970).