Deep Near-Infrared Observations of L 1014: Revealing the nature of the core and its embedded source
Abstract
Recently, the Spitzer Space Telescope discovered L 1014-IRS, a mid-infrared source with protostellar colors, toward the heretofore “starless” core L 1014. We present deep near-infrared observations that show a scattered light nebula extending from L 1014-IRS. This nebula resembles those typically associated with protostars and young stellar objects, tracing envelope cavities presumably evacuated by an outflow. The northern lobe of the nebula has an opening angle of 100∘, while the southern lobe is barely detected. Its morphology suggests that the bipolar cavity and inferred protostellar disk is not inclined more than 30∘ from an edge-on orientation. The nebula extends at least 8′′ from the source at Ks, strongly suggesting that L 1014-IRS is embedded within L 1014 at a distance of 200 pc rather than in a more distant cloud associated with the Perseus arm at 2.6 kpc. In this case, the apparently low luminosity of L 1014-IRS, 0.090 L⊙, is consistent with it having a substellar mass. However, if L 1014-IRS is obscured by a circumstellar disk, its luminosity and inferred mass may be greater. Using near-infrared colors of background stars, we investigate characteristics of the L 1014 molecular cloud core. We determine a mass of 3.6 M⊙ for regions of the core with 2 magnitudes. A comparison of the radial extinction profile of L 1014 with other cores suggests that L 1014 may be among the most centrally condensed cores known, perhaps indicative of the earliest stages of brown dwarf or star formation processes.
1 INTRODUCTION
The discovery by the Cores-to-Disks (hereafter, c2d; Evans et al. 2003) Spitzer Legacy team of L 1014-IRS (SSTc2d 2124075495909; Young et al. 2004), a mid-infrared source with protostellar colors (Allen et al. 2004; Megeath et al. 2004) observed toward the dark cloud L 1014, was unexpected since L 1014 was previously classified as a starless core based on lack of an associated IRAS source (Lee & Myers 1999). Modeling the mid-infrared through mm-wave spectral energy distribution (SED), Young et al. (2004) found that L 1014-IRS was best fitted with a total protostar and disk luminosity of 0.09 L⊙, assuming it was embedded within L 1014 at 200 pc. In that case, L 1014-IRS would be either the lowest luminosity protostar or embedded brown dwarf known. However, the nature of the source was ambiguous since a more distant cloud associated with the Perseus arm at 2.6 kpc exists along the same line of sight as L 1014. If the protostar were instead embedded in the distant cloud, then its luminosity would be similar to that of a typical T Tauri star. Determination of the distance to L 1014-IRS is important since, if it is indeed associated with the nearby L 1014 core, then it apparently has a remarkably low mass.
The most unambiguous determination of its distance would be to detect a protostellar outflow, either at the radial velocity associated with the nearby L 1014 core or the more distant cloud. In an attempt to detect an outflow from L 1014, Crapsi et al. (2005b) mapped the core in CS(2-1) and CO(1-0) with the Five College Radio Astronomy Observatory (FCRAO). The CS(2-1) spectra do not indicate an asymmetric double-peaked feature, with the blue peak stronger than the red peak, typically used to identify infall motions arising from the star formation process in cores (e.g., Lee, Myers, & Tafalla 1999). Furthermore, the study found no significant wing-like CO emission arising from a molecular outflow. Crapsi et al. (2005b) concluded that their data do not indicate any classical outflow signatures, at least for angular scales of 45′′, the size of the FCRAO beam. If L 1014-IRS is associated with the nearby core, and therefore of very low luminosity, sensitive submillimeter interferometric observations probing much smaller angular scales may be necessary to detect the outflows from such sources.
In this paper, we present deep near-infrared observations showing nebulosity around L 1014-IRS strongly suggesting that L 1014-IRS is indeed associated with L 1014. We describe our observations in §2. In §3, we discuss the properties of L 1014-IRS as indicated by these observations. Finally, in §4, we construct an extinction map of the core, derive its mass, and discuss the core density profile.
2 OBSERVATIONS
As part of a larger program to survey the c2d cores in the near-infrared, we obtained deep J, H, and Ks observations of L 1014 during UT 29–31 July 2004 using PISCES (McCarthy et al. 2001) on the converted Multiple Mirror Telescope (MMT) and during UT 24 September 2004 using FLAMINGOS (Elston 1998) on the 4-meter telescope at Kitt Peak National Observatory (KPNO). With a 10′10′ field of view, the purpose of the FLAMINGOS observations was to obtain deep observations of the entire L 1014 core. The PISCES observations, with a circular field of view of 31 on the MMT, were obtained to provide even deeper observations of L 1014-IRS and the center of the core. Seeing in the FLAMINGOS images was 09. In the PISCES images, the seeing varied from 04–10, depending on the night, but typically was 07.
The L 1014 core was observed with FLAMINGOS for a total of 6 minutes at J, 168 minutes at H, and 33 minutes at Ks. These times were obtained by combining dithered images with individual exposure times of 60 seconds at J and H, and 15 seconds at Ks. Since these exposure times saturated moderately bright stars, we obtained suites of at least 9 dithered, 5-second images from which the photometry of most of these sources could be derived. Each individual image was reduced using IRAF and IDL procedures following a standard method for reducing near-infrared images. Specifically, (1) a dark image, representing the signal due to the detector bias and temperature, was subtracted from the raw image, (2) the dark-subtracted image was then divided by a dome flat field to account for the nonuniform pixel-to-pixel sensitivity across the detector, and (3) the sky was subtracted. The individual images were then aligned and averaged, with discrepant pixel values rejected, to produce the final image at J, H, and Ks.
Sources in these final FLAMINGOS images were detected and aperture photometry obtained using PhotVis Version 1.09 (Gutermuth et al. 2004), an IDL GUI-based aperture photometry tool, which makes use of the standard daophot packages (Landsman 1993). The positions of these sources were derived by comparison with known positions of stars, as listed in the USNO-A2.0 catalog, that were observed in our fields. Instrumental magnitudes at J, H and Ks, obtained from 10-radius synthetic apertures centered on these sources, were calibrated using the published J, H, and Ks magnitudes of stars within our fields that were listed in the 2MASS catalog.
Our final L 1014 catalog contains 7000 sources detected at both H and Ks, with most of these sources having H and Ks photometric uncertainties less than 0.15 mag. We estimate our 90% completeness limits to be 18.5, 19.0 and 18.0 at J, H, and Ks, repectively. Uncertainties in the positions of individual sources are less than 1′′.
The central region of L 1014 was observed with PISCES for a total of 13.5 minutes at J, 68 minutes at H, and 9 minutes at Ks. These times were obtained by combining randomly dithered images with individual exposure times of 30 seconds at J and H, and 10 seconds at Ks. These images were supplemented with at least 9 dithered, 0.75-second images and 9 dithered, 5-second images at each band from which the photometry of the bright, saturated sources could be derived.
The individual PISCES images were corrected for quadrant cross-talk effects present in HAWAII arrays (McCarthy et al. 2001). Then, each image was reduced following the standard method previously described, except twilight flat fields were used instead of dome flats. In addition, PISCES images were corrected for geometric distortion prior to being aligned and averaged together.
3 THE L 1014-IRS PROTOSTAR AND NEBULA
The position of L 1014-IRS, as reported by Young et al. (2004), is 21h24m07.51s, 49∘59′090 (J2000.0). This position matches the coordinates of a very red source detected at Ks, seen near the center of the Ks image in Figure 1, to within 05. This separation is within our astrometric tolerance; thus, this Ks source is consistent with being the near-infrared counterpart to L 1014-IRS.
3.1 Detection and Inclination of the Cavity
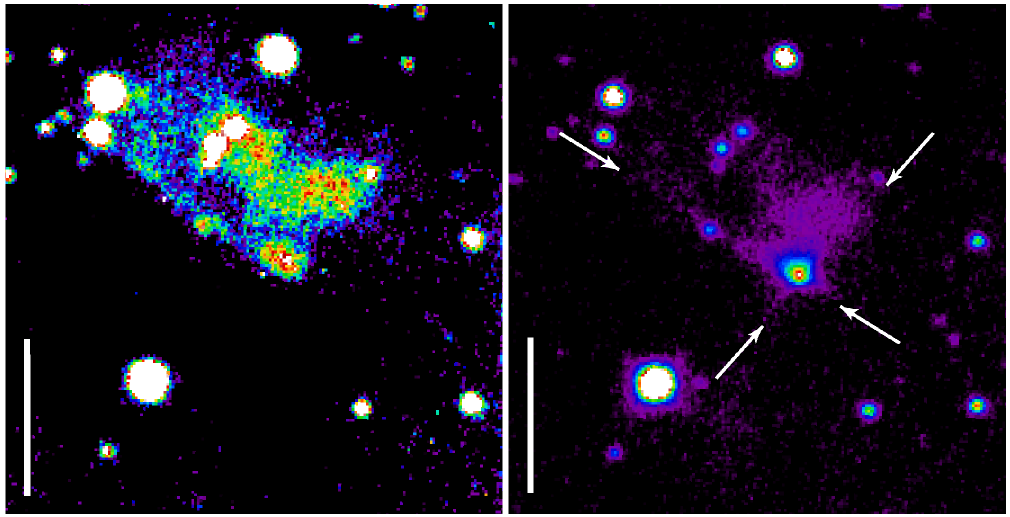
We detect a conical nebula, with opening angle of 100∘, extending at least 8′′ north of L 1014-IRS at Ks, shown in Figure 1. The north and northwestern portions of this nebula appears brighter at Ks than the northeastern portion. A more extended nebula is observed at H, also resembling a conical or fan-shaped nebula with L 1014-IRS at the apex. Similar to the Ks nebulosity, the nebulosity at H is brighter in the north and northwestern portions, but peaks somewhat farther from L 1014-IRS than the does the Ks nebulosity. Such features are typical of scattered light nebulae associated with bipolar cavities emanating from young stellar objects (YSOs) and protostars (e.g., Duchêne et al. 2004; Park & Kenyon 2002; Padgett et al. 1999; Whitney, Kenyon, & Goḿez 1997). Although the brightest H nebulosity is seen in the north and northwest portions of the cavity, the nebula is most extended in the northeastern half of the cavity, at least 15′′ from L 1014-IRS.
The nebulosity near L 1014-IRS is dominated by the northern lobe, but there is a hint of nebulosity at Ks associated with the projected boundaries of the southern lobe within ′′ south of L 1014-IRS. The projected boundaries of the southern lobe appear to be nearly extensions of those of the northern lobes, as illustrated in the figure, though there seems to be some hour-glass-like curvature associated with the nebula if faint nebulosity located 8–10′′ southeast of L 1014-IRS is tracing that projected boundary.
The prominence of the nebulosity associated with the northern lobe compared with that of the southern lobe is at least partly explained by extinction effects. Assuming that L 1014-IRS is embedded in the nearby L 1014 core (see §3.2), with half of the core material in the foreground and half background to L 1014-IRS, the steeply increasing extinction from the northern to the southern regions of the L 1014 core (see §4.1) suggests that light scattered from the southern lobe suffers an additional extinction of 5-10 magnitudes compared to light scattered from the corresponding position in the northern lobe. With a standard reddening law (e.g., Rieke & Lebofsky 1985), if the plane of symmetry of L 1014-IRS is oriented edge-on, then H light scattered from the southern lobe would be only 20–45% as bright as the northern lobe. At Ks, the southern lobe would be only 35–60% as bright as the northern lobe. At both H and Ks, most of the scattered light from the southern lobe would not be detected in our images, except within 2–5′′ south of L 1014-IRS.
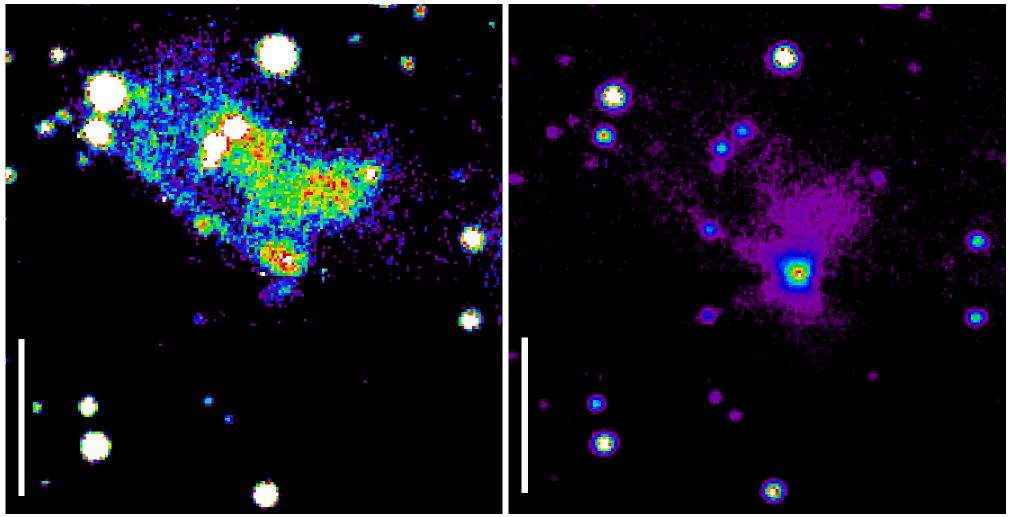
We explicitly demonstrate this point by constructing H and Ks images we would expect from an edge-on bipolar cavity, accounting for this asymmetric extinction from the L 1014 core. To do so, we first construct H and Ks images where the pixels south of L 1014-IRS were replaced with pixels representing the reflection of the northern pixels about the horizontal line through L 1014-IRS. Then, making use of the extinction map generated in §4.1, each southern pixel value was diminished by an appropriate amount, depending on the additional extinction at that southern position compared to the extinction at the corresponding northern position. Finally, noise was added to the southern pixel in order to ensure noise characteristics in the southern pixels were similar to the northern pixels. The resulting synthetic images expected from L 1014-IRS, if oriented with an edge-on inclination and accounting for asymmetric extinction from the core, are shown in Figure 2. Comparing Figure 2 with Figure 1, we see that the extinction from the core can explain most of the lack of nebulosity from the southern lobe, but the observations do not detect as much nebulosity as we might expect from an edge-on inclination, in particular within 2–5′′.
After accounting for extinction, an inclination of the bipolar cavity, with the northern lobe pointing toward the observer and the southern lobe pointing away, most naturally explains the relatively faint nebulosity observed toward the southern lobe. In this way, only back-scattered light will be detected from the southern lobe and, since dust in protostellar envelopes is believed to be more forward-scattering than back-scattering (e.g., Draine & Lee 1984; Kim, Martin, & Hendry 1994; Stark et al. 2005), nebulosity associated with this lobe would be fainter than the northern nebulosity. Radiative transfer models of protostellar environments (Stark et al. 2005) demonstrate the differences in nebulosity expected for different inclinations, ranging from an edge-on orientation () to a pole-on orientation (). These models suggest that inclinations in the range, , are likely to show at least a hint of nebulosity from the lobe pointed away from the observer. Within this range, the less inclined cavities () exhibit only very faint nebulosity associated with the lobe pointed away, while cavities with more edge-on inclinations () exhibit similarly bright nebulosity for both lobes. Based on these models, the inclination of L 1014-IRS can be constrained conservatively to be within 30∘ of an edge-on orientation.
3.2 The Distance Ambiguity
Whether the protostar is embedded within the nearby L 1014 core or embedded within the more distant cloud associated with the Perseus arm at 2.6 kpc (Brand & Blitz 1993) has been ambiguous, given the data available. Such ambiguity in distance has a wide range of implications for the nature of L 1014-IRS.
Assuming that L 1014-IRS is embedded in the nearby L 1014 core, located at a distance of 200 pc, Young et al. (2004) find that the total luminosity of the protostar and protostellar disk is 0.090 L⊙. They mention that the partition of this luminosity between the protostar and disk is uncertain, but a protostar with photospheric luminosity 0.025 L⊙ best fits the SED. If we assume the protostar has a luminosity between 0.025–0.050 L⊙, evolutionary tracks of D’Antona & Mazzitelli (1998, 1997; hereafter, DM97/98) imply a mass of 30–45 MJ for L 1014-IRS assuming a typical Class I age of 105 years. For comparison, extrapolating the Lyon98/00 tracks111DM97/98 and Lyon98/00 tracks are available online at http://www.mporzio.astro.it/{̃}dantona/prems.html and ftp://ftp.ens-lyon.fr/pub/users/CRAL/ibaraffe/BCAH98_iso.1, respectively (Chabrier et al. 2000; Baraffe et al. 1998) to this age results in a similar substellar mass, 20–25 MJ. If L 1014-IRS is younger than 105 years, these mass estimates represent upper limits. We caution, however, that masses derived from current evolutionary tracks for young sources with ages less than 106 years are rather uncertain (Baraffe et al. 2002).
Alternatively, if L 1014-IRS is associated with the more distant core, the luminosity of the protostar and protostellar disk would be 16 L⊙ (Young et al. 2004). In this case, referring to the evolutionary tracks of Siess, Dufour, Forestini (2000), the protostar would be more akin to a 0.5–2 M⊙ T Tauri star than a substellar object, depending on the specific partitioning of flux between the protostar and disk. Scattered light nebulae detected around such YSOs of comparable or less luminosity (or mass) typically extend no more than 1500 AU from the source at K, including those with extended edge-on morphologies (e.g., Duchêne et al. 2004; Padgett et al. 1999). This estimate is derived from deep near-infrared observations of Taurus and Ophiuchus sources at 140 pc. If these sources were moved to 2.6 kpc and placed behind a core with peak extinction A (as observed in the nearby L 1014 core; see §4.1), the detectable regions of these nebulae likely would be smaller than 1500 AU. Even so, the Ks nebulosity detected in our images extends at least 8′′ north of L 1014-IRS, corresponding to at least 20000 AU at 2.6 kpc. In this scenario, this nebula would be at least an order of magnitude larger than nebulae around similar YSOs. Thus, the angular extent of the near-infrared nebulosity detected in our observations strongly suggests that L 1014-IRS is associated with the nearby L 1014 core, not the distant cloud.
3.3 Significant Component of Scattered Light
Using a 1′′-diameter aperture, we find that L 1014-IRS has a Ks flux of 0.20 0.01 mJy, or Ks = 16.3 0.1 mag, where calibration is the dominant source of uncertainty. This detection potentially has two components: direct, but extincted, light from the protostar and scattered protostellar light.
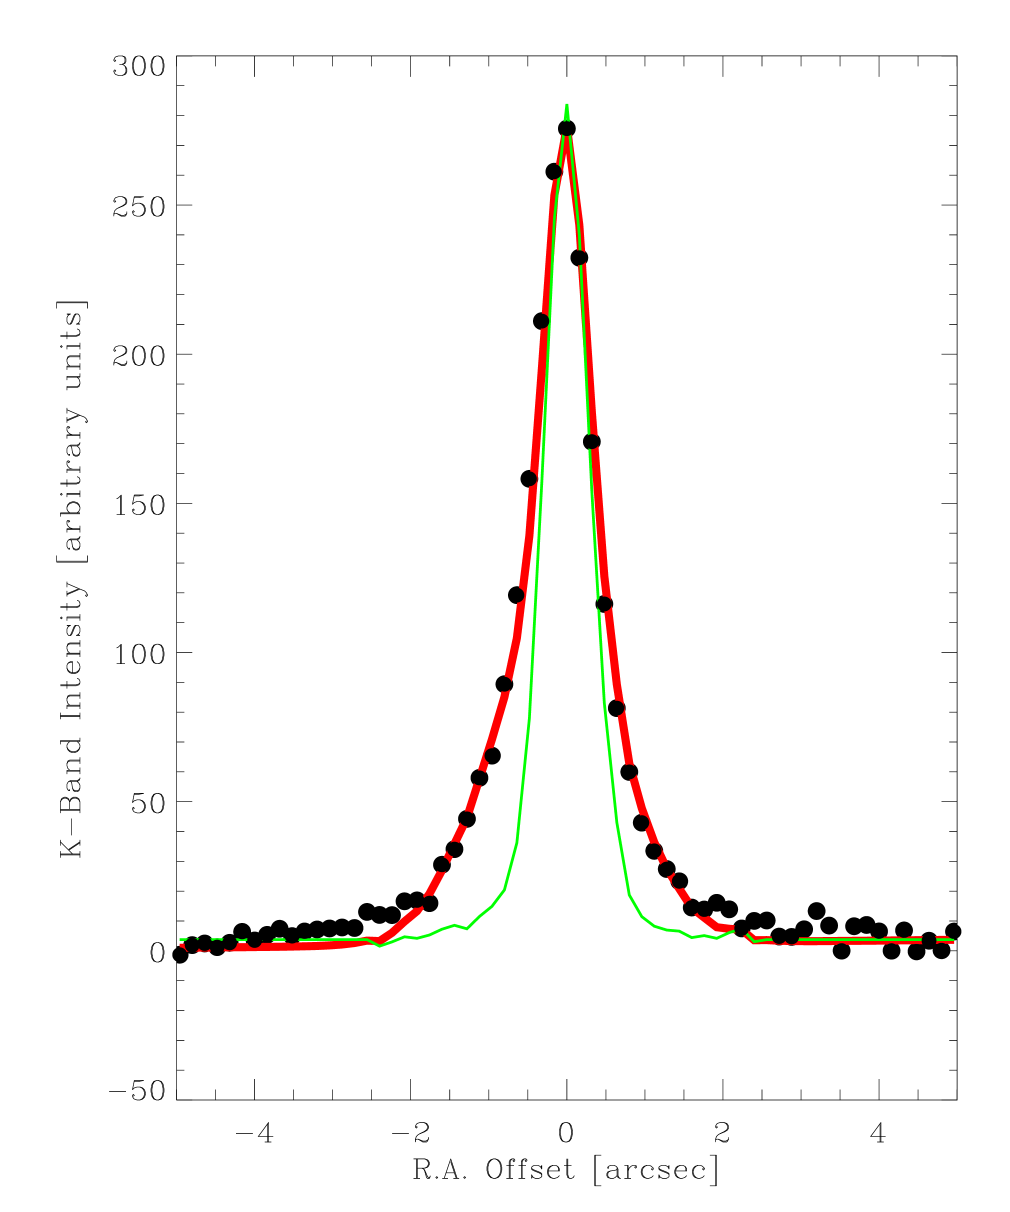
We plot in Figure 3 an east-west cut of the Ks intensity profile through L 1014-IRS. This particular cut is the most narrow (or nearly so) Ks profile for L 1014-IRS, and therefore will contain the least contamination due to scattered light. Next, we constructed a typical PSF (normalized to unity) by taking the average of normalized PSFs for five stars within 30′′ of L 1014-IRS. This typical PSF was then scaled to best-fit the Ks flux distribution near the L 1014-IRS peak. The observed profile of L 1014-IRS, however, is clearly broader than the typical PSF, as shown in Figure 3, suggesting that a significant amount of scattering is observed along the line-of-sight toward L 1014-IRS.
It is possible that the observed profile is entirely scattered light and, if so, then its deconvolved size of 07 (140 AU) would correspond to the size of the primary scattering region. In this case, our observations place no constraints on the Ks protostellar flux.
If instead the profile is comprised of a typical PSF from the attenuated light from the protostar and a broader Gaussian profile from the scattered light, then we find that at least 60% of the Ks flux arises from scattering within our 1′′-diameter aperture. From this consideration, if we have detected some direct light, the protostar would not be brighter than K 17.3 magnitudes, and could be much fainter. We do not detect L 1014-IRS in our deep H image; however, we derive a flux upper limit of H 18.5 magnitudes. With our upper limit on the Ks protostellar flux of 17.3 magnitudes, this non-detection can be explained by extinction from foreground dust in the core and extinction provided by a protostellar disk.
Regardless of whether we have detected entirely scattered light at Ks or attenuated protostellar light within brighter nebulosity, there is likely a significant contribution of unresolved scattered light in the observed IRAC mid-infrared fluxes as well, even though those observations were not sensitive to the faint, extended nebulosity. Based on the IRAC mid-infrared fluxes, Young et al. (2004) estimated that L 1014-IRS was best characterized with temperature of 700 300 K and photospheric luminosity of 0.025 L⊙. If, however, these mid-infrared fluxes were “contaminated” by scattered light, in particular the 3.6 m and 4.5 m fluxes, then the temperature and photospheric luminosity may be somewhat greater. For example, substellar luminosities were cited for HH 30 and Haro 6-5B until high angular resolution, near-infrared Hubble Space Telescope (HST) observations revealed that these sources are surrounded by nearly edge-on disks, rendering only scattered circumstellar light visible at these wavelengths (e.g., Padgett et al. 1999; Burrows et al. 1996). Similarly, HL Tau had been thought to be an optically visible classical T Tauri star until HST observations revealed that it is also surrounded by a nearly edge-on disk and thus only seen in scattered light at optical wavelengths (Stapelfeldt et al. 1995). Thus, HH 30, Haro 6-5B, and HL Tau are characterized by greater photospheric luminosities than originally thought.
If L 1014-IRS is obscured by a circumstellar disk in our observations, then careful two-dimensional radiative transfer modeling of the L 1014-IRS SED is necessary to constrain its photospheric temperature and luminosity. Taking into consideration scattered light, Whitney et al. (2004) developed two-dimensional radiative transfer models to generate IRAC mid-infrared color-color and color-magnitude plots expected for protostars of different temperatures and inclinations for the protostellar disk. After accounting for extinction from the foreground portion of the L 1014 core (i.e., 25 magnitudes; see §4.1), the mid-infrared fluxes of L 1014-IRS indicate that this source has a temperature less than 4000 K, the lowest temperature considered in those models, independent of the inclination. Assuming an age of 105 years, this temperature limit corresponds to a source with mass (DM97/98). Depending on age and mass, brown dwarfs may reach temperatures as high as 3000 K (e.g., Luhman et al. 2003; DM97/98; Chabrier et al. 2000; Baraffe et al. 1998). Clearly, a more detailed analysis of the L 1014-IRS SED with radiative transfer models that consider temperatures less than 4000 K is necessary to constrain the photospheric luminosity and temperature of L 1014-IRS to confirm that this source is substellar. Preliminary attempts to fit the L 1014-IRS SED using the radiative transfer model of Whitney et al. (2004) suggest the temperature is less than 2600 K, but we defer discussion of SED fitting to a more detailed analysis.
The current data available for L 1014-IRS are consistent with it having a remarkably low luminosity and perhaps a substellar mass. However, given the significant amount of scattering along the line of sight, the protostellar temperature is not yet constrained, except that its temperature may be hotter than the previous estimate of 700 K and cooler than 4000 K. Without further analysis, or near-infrared spectroscopic observations, a higher temperature low-mass protostar cannot be ruled out by our observations.
4 THE L 1014 CORE
With the case now much stronger for L 1014-IRS being embedded in the nearby L 1014 core, we make use of our near-infrared observations to derive some physical properties of its parental core to compare with those of other cores. An advantage of deep near-infrared observations toward molecular clouds is in the ability to use them to construct extinction maps with high spatial resolution (e.g., 20′′ as in Lada et al. 2004), which can be used to derive a mass for the core. The extinction profile for L1014 can be modeled to estimate its density structure. This density structure can be compared with those of other starless and star-forming cores in order to gain insight into the evolution of collapsing cores as they form protostars. If future observations confirm L 1014-IRS to be substellar, then the density structure of L 1014 and other cores harboring embedded brown dwarfs may be particularly interesting in comparing brown dwarf and protostellar formation.
4.1 High Resolution Extinction Map
Differential extinction as a function of wavelength gives rise to interstellar reddening, resulting in observed colors of stars that are redder than their intrinsic colors. This difference, known as a color excess, for is explicitly written as
| (1) |
Column densities mapped by this method, known as the NICE (Near-Infrared Color Excess; Lada, Alves, & Lada 1999) method, historically have been expressed in terms of their equivalent visual extinctions, . Given the observed reddening law of Rieke & Lebofsky (1985), the visual extinction is related to E(H-Ks) by
| (2) |
The FLAMINGOS field is sufficiently large that stars just beyond the core boundaries (e.g., regions exhibiting no color excess or cloud structure) may be used to determine the intrinsic colors of the background star population toward L 1014. The region used to compute the intrinsic colors is given by (2000.0)
| (3) | |||||
| (4) |
Within that region, the photometry of 247 stars with H and Ks photometric uncertainties less than 0.20 magnitude was used to obtain an intrinsic color of
| (5) |
The uncertainty quoted is the error in the mean HKs color. The dispersion in the HKs colors of these non-extincted stars was 0.149 magnitude and represents the photometric uncertainties in addition to the uncertainty in the intrinsic color of an individual background star. Thus, an individual line-of-sight extinction is uncertain by 2.4 magnitudes. Since the photometric uncertainty depends on the brightness of the star, and the background star population will tend to be fainter than the non-extincted stars, the uncertainty in an individual line-of-sight extinction through the densest regions may be closer to 3 magnitudes.
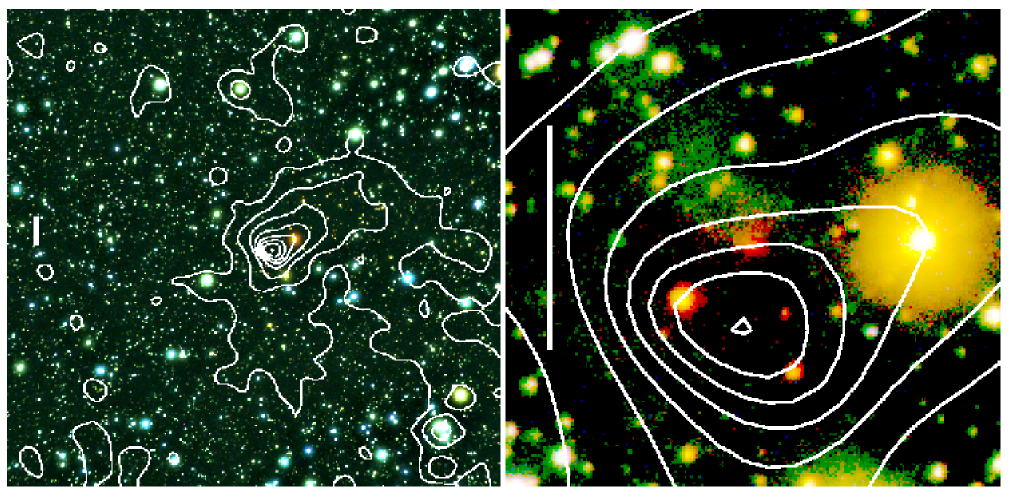
With the intrinsic HKs color, the observed HKs colors of stars (with H and Ks photometric uncertainties less than 0.20 magnitude) were converted to line-of-sight extinctions. Then, in order to reduce the errors in extinction determinations, these line-of-sight extinctions were convolved with a Gaussian beam with FWHM of 20′′ to produce the uniformly sampled, high-resolution extinction map shown in Figure 4.
The beam-average extinction peaks at AV = 35 magnitudes at a position, offset from L 1014-IRS, as given in Table 1. Since this position was determined from a 20′′ beam, the true position of peak extinction is likely to be within 10′′ of that position. The peak line-of-sight extinction is A 44 magnitudes, found for three stars south of L 1014-IRS. The next greatest line-of-sight extinction is A 29 magnitudes. Making use of line-of-sight extinctions to refine the peak position, we obtain a position offset 4′′ east and 14′′ south, as indicated in Table 1. This refined position was derived such that the extinction-weighted distances from the peak to each of the three stars with greatest extinctions was equal.
The line-of-sight extinctions near the center of L1014, as probed by the NICE method, are comparable to those derived in similar studies of other isolated dense cores. For example, in the deep near-infrared imaging surveys of Kandori et al. (2005) and Murphy & Myers (2003), peak extinctions of A 30–50 magnitudes were observed in almost half of their combined sample of 18 dense cores. Harvey et al. (2003a) observed line-of-sight extinctions of A 30 magnitudes at about 30′′ from the center of the starless core L694-2. For the protostellar core B335, Harvey et al. (2001) observed extinctions of A 50 magnitudes at about 20′′ from the center.
Other determinations of peak column density positions, derived from dust emission maps of L 1014, are included in Table 1. These positions are all south of L 1014-IRS, but north of the peak position as determined from our dust extinction study. Since the dust emission is a function of the column density and temperature, it is not surprising that the dust emission peaks closer to L 1014-IRS than our extinction peak. L 1014-IRS heats its circumstellar dust and, given the beamsize of the (sub)millimeter observations, will shift the dust emission peak toward L 1014-IRS and away from the column density peak.
The 10–15′′ offset between L 1014-IRS and the column density peak, as given by our extinction observations, may be explained in several ways. In Smoothed Particle Hydrodynamic (SPH) simulations, Stamatellos et al. (2005) demonstrate that protostars may be displaced from the core center due to asymmetries in the pattern of accretion. In one of their simulations, the protostar was given a peculiar velocity of 0.3 km s-1, comparable to the projected peculiar velocity of 0.1 km s-1 for L 1014-IRS, assuming an age of 105 years. According to these models, a consequence of this displacement is a significantly reduced accretion rate, slowing the growth of the protostar. We speculate that, if future observations of L 1014-IRS demonstrate it to be substellar, one difference between the formation of protostars and brown dwarfs may be that the accretion of a brown dwarf may have been turned off prematurely due to higher peculiar velocities imparted by asymmetric accretion. In this case, embedded brown dwarfs should be observed with greater offsets from their parental core centers compared to protostars. An alternative explanation for the offset between L 1014-IRS and the extinction peak may be that the structure of the L 1014 core includes two distinct condensations that, in projection, appear close together. One of these condensations formed L 1014-IRS, while the other remains intact.
| Offset from L 1014-IRS | Peak | |||
|---|---|---|---|---|
| Observations | Beamsize | RA | Dec. | [1022 cm-2] |
| SCUBA 850-m Dust Emission Mapa | 16′′ | 0′′ | 6′′ | 4.3 |
| MAMBO 1.2-mm Dust Emission Mapb,c | 20′′ | 1′′ | 3′′ | 3.5 |
| BIMA 3-mm Dust Emission Mapd | 2216′′ | 3′′ | 7′′ | … |
| NICE Dust Extinction Map | 20′′ | 2′′ | 10′′ | 6.3 |
| NICE Line-of-Sight Dust Extinctions | 20′′ | 4′′ | 14′′ | 7.9 |
a Visser, Richer, & Chandler (2002); Young et al. (2004)
b Young et al. (2004); Kauffmann et al. 2005, in preparation.
c Original data with 11′′ beam were used to derive peak column density, but original data were smoothed to 20′′ to derive position.
d Lai et al. 2005, in preparation.; Position was reliably determined, but peak column density could not be derived reliably since these observations resolved out some of the core emission.
4.2 Core Mass
The NICE method of mapping dust extinction provides a relatively reliable determination of the mass of the molecular cloud, independent of an assumed geometry for the cloud. The gas-to-dust ratio widely used is that derived by the study of Bohlin, Savage, & Drake (1978), which determined the column density of hydrogen in the diffuse interstellar medium (ISM) as a function of the optical color excess . Making use of the standard reddening law (Rieke & Lebofsky 1985), their gas-to-dust ratio can be expressed in terms of visual extinction as

| (6) |
The mass of the molecular cloud is determined by integrating the mass column density over the area of the cloud,
| (7) |
where is the mean molecular weight of gas within the core and is the projected area of the cloud on the sky.
Using circular apertures of different radii centered on the position of peak extinction, we plot in Figure 5 the mass of the L1014 core as a function of aperture radius , determined by
| (8) |
where is the distance and is the component of extinction attributed to the more extended component of the L 1014 cloud within which the core is embedded (or, alternatively, represents a systematic correction to our derived intrinsic color, as explained in §4.3). This plot demonstrates that the mass asymptotically approaches 3.46 0.03 M⊙ with increasing aperture size. Systematic uncertainties in these masses, dominated by uncertainties in the distance, are not included in our mass estimates.
For comparison, Young et al. (2004) used the 850 m dust emission map of L 1014 to derive a mass of 1.7 M⊙ within 75′′ (15000 AU) of the center of the core. Using Equation 8, we derive a mass of 2.1 M⊙ within the same region. This difference in mass determination is likely due to uncertainty in the submillimeter opacity or the reddening law for such dense environments, or both.
Most of the mass of the core is within the more extended regions of low column density. This fact is most evident when plotting the cumulative mass as a function of minimum extinction, , as in Figure 5. In particular, the mass of the core in regions with extinction 10 magnitudes is only 1.1 M⊙, while the mass in regions with extinction 2 magnitudes is more than triple that, at 3.55 0.02 M⊙.
4.3 Physical Properties from Extinction Modeling
For comparison with previous studies, we first model the L 1014 core as an isothermal spherical core in hydrostatic equilibrium, known as a Bonnor-Ebert core. Since L 1014 is clearly elongated, having an aspect ratio of 2, we also consider the case of an isothermal cylindrical core for comparison. L 1014 has a young embedded source and hence at least some portion of the core is likely to be collapsing and therefore not in hydrostatic equilibrium. For this reason, the modeling of L 1014 in this study is not for the purpose of ascertaining the hydrodynamic stability of the core. Instead, we make use of the density profiles derived from such modeling since they, regardless of stability, represent a core structure consistent with the observations. Furthermore, models of collapsing cores with Bonnor-Ebert initial states have density profiles very similar to Bonnor-Ebert profiles for the early stages of collapse (Myers 2005). Models of Bonnor-Ebert and isothermal cylindrical cores have been used recently to characterize B335 (Harvey et al. 2001), the prototypical Class 0 protostellar core. Starless cores, such as B68 (Alves, Lada, & Lada 2001), L 694-2 (Harvey et al. 2003a), and L 1544 (Evans et al. 2001) also have been fitted to such models. By comparing the density structures of different types of cores, we might be able to construct an evolutionary sequence of dense cores as they collapse to form low-mass protostars or brown dwarfs.
Adopting the peak position determined from the line-of-sight extinctions given in Table 1, we construct a radial profile of extinction for L 1014 in Figure 6 by averaging the line-of-sight extinctions of stars within 10′′-wide shells centered on the peak position. With this shell size, the central shell contains the three stars with the greatest (and similar) line-of-sight extinctions. The second smallest shell (outer radius of 20′′) contains five stars. For larger shells, the number of stars is nearly proportional to the area, with 30 stars found within the third smallest shell (outer radius of 30′′). The error bar on each data point represents the error in the mean of the line-of-sight extinctions within each shell. In general, these error bars are expected to include the photometric errors as well as errors in the assumed intrinsic color. Beyond 200′′, the mean extinction derived from the azimuthally averaged profile has not quite reached magnitude. Rather the profile appears to hover near magnitude, which could be attributed to a more extended cloud component within which the core is embedded. However, given that this “background” level of extinction can be explained instead by increasing the intrinsic color, determined in §4.1, by only 2, this apparent extended cloud component may simply represent a systematic error caused by a slight offset in the intrinsic color. The results of our study do not depend on the particular explanation since we are mainly concerned with that portion of the extinction due to the core itself.
Details of Bonnor-Ebert modeling of radial extinction profiles can be found in Harvey et al. (2001). In standard fitting of truncated Bonnor-Ebert models to extinction profiles, there are three “observational” parameters that are directly constrained by the profile: , , and . The shape of a normalized Bonnor-Ebert profile is characterized by , with larger values denoting more centrally condensed cores. The angular radius of the core, , and peak extinction through its center, , enable comparison of these normalized profiles with observed profiles. In addition, we consider that the extinction profile of the core is superimposed onto a constant level of extinction, , from the more extended molecular cloud within which the core is embedded. Finally, in Bonnor-Ebert modeling, there is often a weak “degeneracy” between and , especially if the density profile is very centrally condensed and there are no extinction observations sufficiently close to the core center. In such cases, greater values of may provide fits nearly as good as smaller values, provided is correspondingly greater. Yet, greater values of and imply smaller external pressures on the boundary of the core. While fits with large values of and may provide good fits to the extinction profile, the implied external pressure is unrealistically too small. The pressure in the local interstellar medium is K cm-3 (Boulares & Cox 1990), while external pressures confining molecular clouds and cores are typically a factor of a few, perhaps as large as 10, greater than this value (e.g., McKee & Holliman 1999). Similar to considerations made by Zucconi, Walmsley, & Galli (2001), we constrain the external pressure in our Bonnor-Ebert modeling to be greater than the minimum value, K cm-3.
Normalized, theoretical extinction profiles of Bonnor-Ebert cores were generated for a grid of (, ) values for , incremented by 5′′, and , incremented by 0.1. Each of these normalized theoretical profiles were then fitted to the observed profile by optimizing and , while ensuring the external pressure constraint is satisfied. The quality of these fits were judged by the standard reduced chi-squared values, . In order for a model to satisfactorily agree with observations, typically is required.
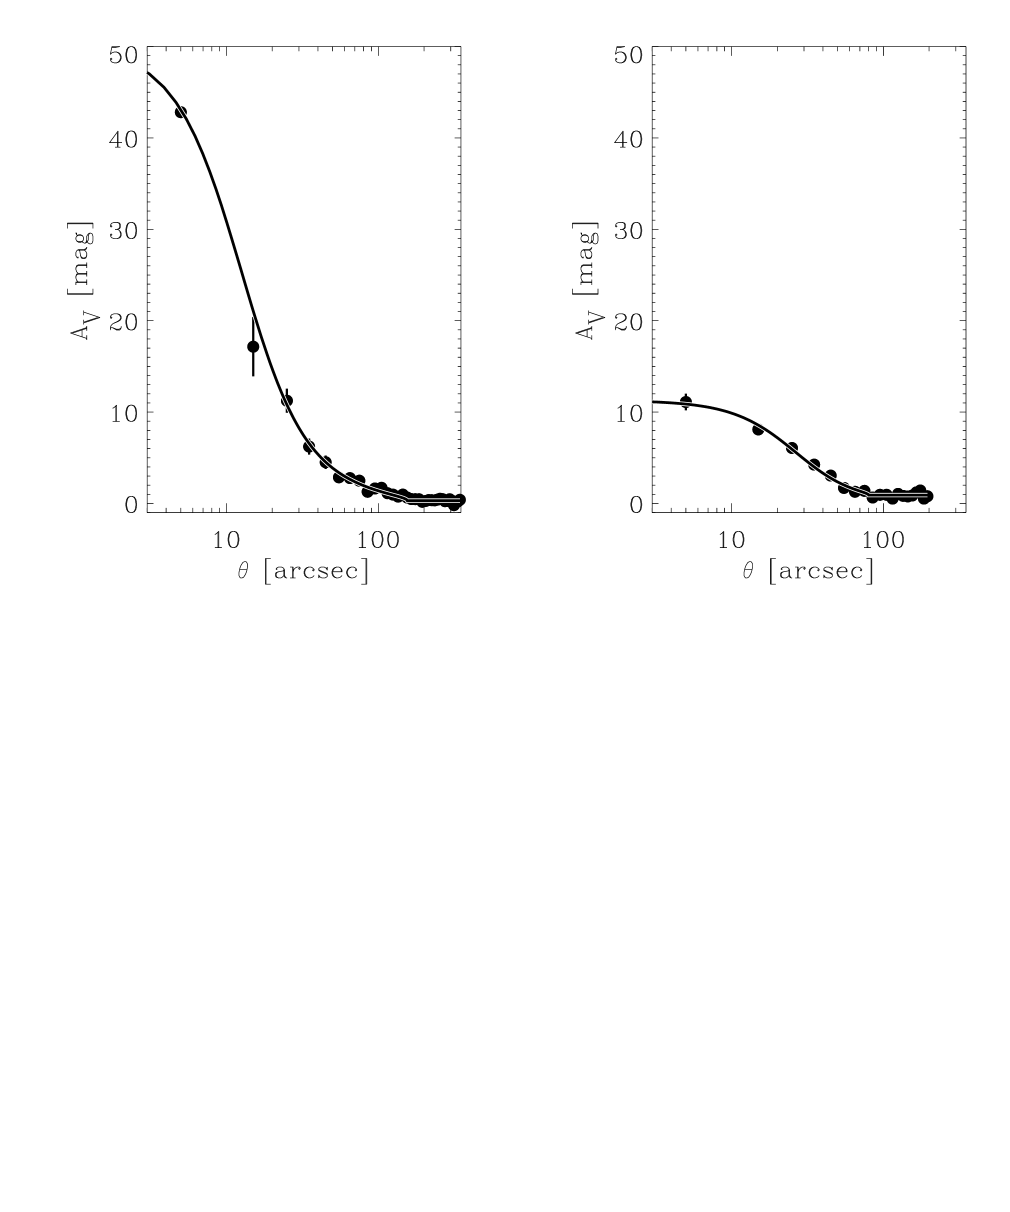
The best Bonnor-Ebert fit to the L 1014 radial extinction profile was consistent with observations, yielding . The observational parameter values corresponding to this fit are listed in Table 2 and the corresponding extinction profile is overlaid onto the observed profile in Figure 6. We also list in Table 2 the 99% confidence ranges, representing the set of parameter values for which
| (9) |
where is the number of degrees of freedom.
| Bonnor-Ebert | Isothermal Cylinder | |||
| Parameter | Best-Fit Value | 99% Confidence Range | Best-Fit Value | 99% Confidence Range |
| 35.8 | 29.2 – 36.9 | 6.9 | 3.2 – 9.2 | |
| 155 | 135 – 165 | 80 | 55 – 100 | |
| A | 50.2 | 47.7 – 51.8 | 10.4 | 8.2 – 12.8 |
| A | 0.3 | 0.2 – 0.4 | 0.9 | 0.8 – 1.0 |
From Table 2, we see that a range of values, given by , were found to satisfactorily agree with our observations of L 1014. Previously, the starless core B68 was found to be characterized by a density profile given by (Alves, Lada, & Lada 2001); the density profile of the well-studied protostellar core B335 was found to be more centrally condensed than that of B68 and characterized by (Harvey et al. 2001). From our analysis of the dust extinction profile presented here, L 1014 is more centrally condensed than both of these prototypical starless and star-forming cores.
In fact, L 1014 is more centrally condensed than would be inferred from previous dust emission (Visser, Richer, & Chandler 2002; Kauffmann et al. 2005, in preparation.; Lai et al. 2005, in preparation) and molecular line observations (Crapsi et al. 2005a, 2005b). For example, the integrated intensity of N2H+(1-0) at the peak of L 1014 is almost a third that of the L 694-2 core. Yet, L 1014 is condensed than L 694-2, characterized by from deep near-infrared observations of extinction (Harvey et al. 2003a). Referring to the azimuthally averaged radial extinction profile for L 1014 in Figure 6, we see that the column density of L 1014 falls to half its peak value within 10′′, whereas this characteristic size of L 694-2 is 20–30′′. With beamsizes of 20′′, single-dish millimeter observations cannot sample with sufficient angular resolution such a small, highly condensed core as L 1014.
Herein, we find the advantage of near-infrared observations and the NICE method in that individual lines of sight arbitrarily close to the peak column density may be sampled by deeper and deeper observations. For purposes of studying the inner structure of such small cores like L 1014, it is necessary to achieve angular resolutions provided by deep near-infrared observations or interferometric observations (e.g., Harvey et al. 2003b, 2003c; Bourke et al. 2005) of dust emission or molecular lines. Indeed, it is possible that isolated regions of low-mass star formation, or brown dwarf formation, may not have been detected by previous single-dish millimeter observations.
On the other hand, L 1544 and L 1689B are two examples of isolated starless cores, for which previous single-dish observations of dust emission (Evans et al. 2001) indicate that they are very centrally condensed () and should be forming stars. L 694-2 is another example. However, previous observations of L 694-2, L 1544, and L 1689B were not sensitive enough to detect very low-mass protostars or embedded substellar candidates such as L 1014-IRS. If the density structure is a significant factor in forming low mass protostars (e.g., Kandori et al. 2005; Muench et al. 2005, in preparation) and substellar sources, then we might expect that more sensitive near-infrared or mid-infrared observations of these cores might reveal embedded sources, which may be substellar.
Given the elongated shape of L 1014, for comparison with the radial extinction profile, we generate the extinction profile as a function of angular distance from the major axis, shown in Figure 6. Comparing this cylindrical profile with the radial profile, one striking difference is that the peak extinction in the radial profile is significantly greater than that in the cylindrical profile. This difference is due to the variation of the line-of-sight extinctions along the major axis, effectively diluting the peak extinction in the profile. Another difference between the radial and cylindrical profiles is that L 1014 appears to extend to a radius 155′′ when assuming a spherical symmetry, whereas it extends about half that distance in the cylindrical profile. The size of the core as given by the spherical profile will closely correspond to its major axis, while the extent of the cylindrical profile should closely correspond to the size of its minor axis. Hence, these profiles are consistent with L 1014 having an aspect ratio of 2:1, as apparent from the extinction contours in Figure 4.
Using a method similar to that for Bonnor-Ebert cores (e.g., Harvey et al. 2003a), we find that the cylindrical profile can be fit to models of truncated isothermal cylindrical filaments (Ostriker 1964). The best-fit values and the 99% confidence ranges for the observational parameters are listed in Table 2. With the best-fit cylindrical filament model yielding , these models fit our observations equally well compared to Bonnor-Ebert cores.
The density profiles given by some isothermal cylindrical core models and very centrally condensed Bonnor-Ebert core models are consistent with the L 1014 extinction profiles. These models constrain certain physical properties of L 1014, namely and , as well as the distance. Since at least some of the L 1014 core is not in hydrostatic equilibrium, the temperature that is inferred by such modeling may not be directly applicable to L 1014. For this reason, we refer to the temperature inferred by the modeling as an effective temperature. With that note of caution, we briefly investigate the implications of the modeling on , , and . The extent to which these inferred quantities are valid for L 1014 depends on the process by which star formation occurs in dense cores and the portion of the core affected.
The physical parameters are related to the fitted observational parameters by the following two constraints:
| (10) |
| (11) |
where is the dimensionless column density through the center of the core,
| (12) |
computed by numerical integration. Cylindrical filaments involve one more parameter than spherical cores — the inclination of the core relative to the line of sight, designated as in Equation 12. However, the extinction profile does not constrain this inclination. In the case of a Bonnor-Ebert core, in Equation 12. Assuming a distance of 200 pc for L 1014, the 99% confidence range for the Bonnor-Ebert core results in an effective temperature of 18–22 K and central density of 1.0–1.4 106 cm-3, as summarized in Table 3. In this table, we also include the range of core radii , derived from the distance and angular radii inferred from this model. For comparison, the quantities computed from the isothermal cylindrical core model are also listed in Tables 3, with in this case referring to the maximum extent of the L 1014 filament from the major axis.
Comparing the physical properties of the L 1014 core as inferred from the Bonnor-Ebert modeling with those inferred from the isothermal cylindrical core, the spherical core has a greater central density than the cylindrical core by an order of magnitude. This difference likely can be explained by the Bonnor-Ebert directly modeling the peak central density, probed by the peak central extinction, whereas the isothermal cylindrical core model considered here is only considering the average density along the major axis. Clearly, the extinction varies along this major axis and a more careful treatment of elongated cores should account for this feature. Finally, if the distance to L 1014 is assumed, both the Bonnor-Ebert and cylindrical core models predict similar effective temperatures for L 1014.
| Property | Bonnor-Ebert | Isothermal Cylinder |
|---|---|---|
| Teff [K] | 1822 | 1420 |
| n0 [106 cm-3] | 1.01.4 | (0.10.2) |
| R [pc] | 0.130.16 | 0.050.10 |
5 CONCLUSION
Deep near-infrared observations presented here have detected the Ks-band counterpart to L 1014-IRS, the mid-infrared source with protostellar colors detected by the Spitzer Space Telescope. At the time of discovery, the harboring core of this protostellar source was ambiguous — either L 1014 at a distance of 200 pc, or a more distant core associated with the Perseus arm at 2.6 kpc. The spatial extent of near-infrared nebulosity reported here, which traces the evacuated bipolar cavity typically associated with young stellar objects and protostars, strongly suggests that L 1014-IRS is indeed associated with L 1014. In this case, L 1014-IRS is the lowest luminosity source yet detected within a molecular cloud core; comparison with evolutionary tracks indicates that this source may be substellar. Given the large contamination of scattered light at Ks along the line of sight to L 1014-IRS, and the morphology of the bipolar nebula, L 1014-IRS may be obscured by its circumstellar disk. For this reason, without near-infrared spectroscopic observations or radiative transfer models extending to lower temperatures, we cannot rule out the possibility that L 1014-IRS is instead a deeply embedded, low-mass protostar.
Despite the lack of any outflow detection in previous, extensive searches, the near-infrared nebula would seem to be indirect evidence for an outflow oriented approximately north-south. Recent interferometric submillimeter observations from the Submillimeter Array (SMA) have detected the weak protostellar CO outflow aligned with the near-infrared nebula, confirming that L 1014-IRS is an outflow source embedded in the L 1014 core (Bourke et al. 2005). This direct detection of an outflow and determination of its characteristics may yield important information about the earliest stages of star formation or, if L 1014-IRS is confirmed to be substellar, elucidate differences between the formation of protostars and formation of brown dwarfs.
From near-infrared colors of background stars, we derive extinctions along many lines of sight through the L 1014 core and construct a high angular resolution extinction map. We find that L 1014 has a peak extinction of magnitudes and a mass of 3.6 M⊙. Based on the radial profile of extinction, L 1014 appears to be one of the most centrally condensed cores known. Finally, the extinction map suggests that L 1014-IRS may have been displaced by 10–15′′ (2000–3000 AU) from the core center, perhaps due to peculiar velocities imparted by asymmetric accretion. If future observations of L 1014-IRS confirm it to be substellar, the significant decrease in accretion rate resulting from its displacement may be a natural explanation for its substellar mass. With the successful launch of the Spitzer Space Telescope, which is sensitive to detecting young embedded brown dwarfs, this hypothesis may be tested by determining offsets between the embedded brown dwarfs and the core centers and comparing these offsets with those of low-mass embedded protostars.
References
- Allen et al. (2004) Allen, L.E., Calvet, N., D’Alessio, P., Merin, B., Hartmann, L., Megeath, S.T., Gutermuth, R.A., Muzerolle, J., Pipher, J.L., Myers, P.C., & Fazio, G.G. 2004, ApJS, 154, 363
- Alves, Lada, & Lada (2001) Alves, J.F., Lada, C.J., & Lada, E.A. 2001, Nature, 409, 159
- Baraffe et al. (1998) Baraffe, I., Chabrier, G., Allard, F. & Hauschildt, P. 1998, A&A, 337, 403
- Baraffe et al. (2002) Baraffe, I., Chabrier, G., Allard, F., & Hauschildt, P.H. 2002, A&A, 382, 563
- Bohlin, Savage, & Drake (1978) Bohlin, R.C., Savage, B.D., & Drake, J.F. 1978, ApJ, 224, 132
- Boulares & Cox (1990) Boulares, A. & Cox, D.P. 1990, ApJ, 365, 544
- Bourke et al. (2005) Bourke, T.L., Crapsi, A., Myers, P.C., Evans, N.J., Wilner, D.J., Huard, T.L., Jørgensen, J.K., & Young, C.H. 2005, ApJL, submitted
- Brand & Blitz (1993) Brand, J., & Blitz, L. 1993, A&A, 275, 67
- Burrows et al. (1996) Burrows, C.J., Stapelfeldt, K.R., Watson, A.M., Krist, J.E., Ballester, G.E., et al. 1996, ApJ, 473, 437
- Chabrier et al. (2000) Chabrier, G., Baraffe, I., Allard, F., & Hauschildt, P. 2000, ApJ, 542, 464
- Crapsi et al. (2005a) Crapsi, A., Caselli, P., Walmsley, C.M., Myers, P.C., Tafalla, M., Lee, C.W., & Bourke, T.L. 2005a, ApJ, 619, 379
- Crapsi et al. (2005b) Crapsi, A., DeVries, C.H., Huard, T.L., Lee, J.E., Myers, P.C., et al. 2005b, A&A, in press
- D’Antona & Mazzitelli (1997) D’Antona, F. & Mazzitelli, I. 1997, Mem. Soc. Astron. Italiana, 68, 807
- D’Antona & Mazzitelli (1998) D’Antona, F. & Mazzitelli, I. 1998, in ASP Conf. Ser. 134, Brown Dwarfs and Extrasolar Planets, ed. R. Rebolo, E.L. Martín, & M.R. Zapatero Osorio (San Francisco: ASP), 442
- Draine & Lee (1984) Draine, B.T., & Lee, H.M. 1984, ApJ, 285, 89
- Duchêne et al. (2004) Duchêne, G., Bouvier, J., Bontemps, S., André, P., & Motte, F. 2004, A&A, 427, 651
- Elston (1998) Elston, R. 1998, Proc. SPIE, 3354, 404
- Evans et al. (2003) Evans, N.J., Allen, L.E., Blake, G.A., Boogert, A.C.A., Bourke, T.L., Harvey, P.M., et al. 2003, PASP, 115, 965
- Evans et al. (2001) Evans, N.J., Rawlings, J.M.C., Shirley, Y.L., & Mundy, L.G. 2001, ApJ, 557, 193
- Gutermuth et al. (2004) Gutermuth, R.A., Megeath, S.T., Muzerolle, J., Allen, L.E., Pipher, J.L., Myers, P.C., & Fazio, G.G. 2004, ApJS, 154, 374
- Harvey et al. (2001) Harvey, D.W.A., Wilner, D.J., Lada, C.J., Myers, P.C., Alves, J.F., & Chen, H. 2001, ApJ, 563, 903
- Harvey et al. (2003a) Harvey, D.W.A., Wilner, D.J., Lada, C.J., Myers, P.C., & Alves, J.F. 2003a, ApJ, 598, 1112
- Harvey et al. (2003b) Harvey, D.W.A., Wilner, D.J., Myers, P.C., & Tafalla, M. 2003b, ApJ, 597, 424
- Harvey et al. (2003c) Harvey, D.W.A., Wilner, D.J., Myers, P.C., Tafalla, M., & Mardones, D. 2003c, ApJ, 583, 809
- Kandori et al. (2005) Kandori, R., Nakajima, Y., Tamura, M., Tatematsu, K., Aikawa, Y., et al. 2005, AJ, accepted
- Kim, Martin, & Hendry (1994) Kim, S., Martin, P.G., & Hendry, P.D. 1994, ApJ, 422, 164
- Lada, Alves, & Lada (1999) Lada, C.J., Alves, J., & Lada, E.A. 1999, in The Physics and Chemistry of the Interstellar Medium, eds. V. Ossenkopf, J. Stutzki, G. Winnewisser, 161
- Lada et al. (2004) Lada, C.J., Huard, T.L., Crews, L.J., & Alves, J. 2004, ApJ, 610, 303
- Landsman (1993) Landsman, W.B. 1993, in ASP Conf. Ser. 52, Astronomical Data Analysis Software and Systems II, ed. R.J. Hanisch, R.J.V. Brissenden, & J. Barnes (San Francisco: ASP), 246
- Lee & Myers (1999) Lee, C.W., & Myers, P.C. 1999, ApJS, 123, 233
- Lee, Myers, & Tafalla (1999) Lee, C.W., Myers, P.C., & Tafalla, M. 1999, ApJ, 526, 788
- Luhman et al. (2003) Luhman, K.L., Stauffer, J.R., Muench, A.A., Rieke, G.H., Lada, E.A., Bouvier, J., & Lada, C.J. 2003, ApJ, 593, 1093
- McCarthy et al. (2001) McCarthy, D.W., Jr., Ge, J., Hinz, J.L., Finn, R., & de Jong, R.S. 2001, PASP, 113, 353
- McKee & Holliman (1999) McKee, C.F. & Holliman II, J.H. 1999, ApJ, 52, 313
- Megeath et al. (2004) Megeath, S.T., Allen, L.E., Gutermuth, R.A., Pipher, J.L., Myers, P.C., Calvet, N., Hartmann, L., Muzerolle, J., & Fazio, G.G. 2004, ApJS, 154, 367
- Murphy & Myers (2003) Murphy, D.C. & Myers, P.C. 2003, ApJ, 591, 1034
- Myers (2005) Myers, P.C. 2005, ApJ, 623, 280
- Ostriker (1964) Ostriker, J. 1964, ApJ, 140, 1056
- Padgett et al. (1999) Padgett, D.L., Brandner, W., Stapelfeldt, K.R., Strom, S.E., Terebey, S., & Koerner, D. 1999, AJ, 117, 1490
- Park & Kenyon (2002) Park, S., & Kenyon, S.J. 2002, AJ, 123, 3370
- Rieke & Lebofsky (1985) Rieke, G.H., & Lebofsky, M.J. 1985, ApJ, 288, 618
- Siess et al. (2000) Siess, L., Dufour, E., & Forestini, M. 2000, A&A, 358, 593
- Stamatellos et al. (2005) Stamatellos, D., Whitworth, A.P., Boyd, D.F.A., & Goodwin, S.P. 2005, A&A, accepted (astro-ph/0505291)
- Stapelfeldt et al. (1995) Stapelfeldt, K.R., Burrows, C.J., Krist, J.E., Trauger, J.T., Hester, J.J. et al. 1995, ApJ, 449, 888
- Stark et al. (2005) Stark, D.P., Whitney, B.A., Stassun, K., & Wood, K. 2005, ApJ, submitted
- Visser, Richer, & Chandler (2002) Visser, A.E., Richer, J.S., & Chandler, C.J. 2002, AJ, 124, 2756
- Whitney et al. (2004) Whitney, B.A., Indebetouw, R., Bjorkman, J.E., & Wood, K. 2004, ApJ, 617, 1177
- Whitney, Kenyon, & Gómez (1997) Whitney, B.A., Kenyon, S.J., & Gómez, M. 1997, ApJ, 485, 703
- Whitney et al. (2003) Whitney, B.A., Wood, K., Bjorkman, J.E., & Cohen, M. 2003, ApJ, 598, 1079
- Young et al. (2004) Young, C.H., Jørgensen, J.K, Shirley, Y.L., Kauffmann, J., Huard, T.L., et al. 2004, ApJS, 154, 396
- Zucconi et al. (2001) Zucconi, A., Walmsley, C.M., & Galli, D. 2001, A&A, 376, 650