2 American University of Sharjah, College of Arts & Sciences, Physics Department, PO Box 26666, Sharjah, UAE
3 LATT, CNRS/OMP, 31000 Toulouse, France
Spectral analysis of the Galactic e+e- annihilation emission
We present a spectral analysis of the e+e- annihilation emission from the Galactic Centre region based on the first year of measurements made with the spectrometer SPI of the INTEGRAL mission. We have found that the annihilation spectrum can be modelled by the sum of a narrow and a broad 511 keV line plus an ortho-positronium continuum. The broad line is detected (significance 3.2) with a flux of (0.35 0.11) 10-3 photons s-1 cm-2. The measured width of 5.41.2 keV FWHM is in agreement with the expected broadening of 511 keV photons emitted in the annihilation of positroniums that are formed by the charge exchange process of slowing down positrons with hydrogen atoms. The flux of the narrow line is (0.72 0.12) 10-3 photons s-1 cm-2 and its width is 1.30.4 keV FWHM. The measured ortho-positronium continuum flux yields a fraction of positronium of (96.72.2)%.
To derive in what phase of the interstellar medium positrons annihilate, we have fitted annihilation models calculated for each phase to the data. We have found that 49 % of the annihilation emission comes from the warm neutral phase and 51% from the warm ionized phase. While we may not exclude that less than 23% of the emission might come from cold gas, we have constrained the fraction of annihilation emission from molecular clouds and hot gas to be less than 8% and 0.5%, respectively.
We have compared our knowledge of the interstellar medium in the bulge (size, density, and filling factor of each phase) and the propagation of positrons with our results and found that they are in good agreement if the sources are diffusively distributed and if the initial kinetic energy of positrons is lower than a few MeV. Despite its large filling factor, the lack of annihilation emission from the hot gas is due to its low density, which allows positrons to escape this phase.
Key Words.:
Gamma rays: observation – Line: formation, profile – ISM: general1 Introduction
In the quest for the origin of positrons, images of the annihilation line emission tell us that positrons annihilate primarily in the bulge of our Galaxy (Knödlseder et al. 2005 and references therein). Assuming that positrons do not propagate far from their sources, the spatial distribution of the annihilation emission should trace the spatial distribution of the sources. Under this hypothesis, the observations of the spectrometer SPI onboard the INTEGRAL observatory show that the sources of the bulk Galactic positrons seem to be associated with the old stellar population (Knödlseder et al. 2005).
In this paper we try to infer, from the spectral characteristics of the annihilation emission measured by SPI, information on the particular processes involved in the interaction of Galactic positrons with the interstellar medium (ISM). This information should provide some clues regarding the origin of Galactic positrons. The identification by spectral analysis of the ISM phase in which positrons annihilate could enable one to retrieve the type of positron sources under particular assumptions of the distance travelled by positrons as a function of their initial kinetic energy. For instance, if positrons propagate a short distance from their sources, it is then likely that the positron sources belong to or are specifically tied to the medium in which positrons annihilate.
The spectral characteristics of the annihilation emission (shape and intensity of the line, relative intensity of the ortho-positronium continuum) offer valuable information on the physical conditions of the ISM where positrons annihilate (Guessoum, Ramaty & Lingenfelter 1991; Guessoum, Jean & Gillard 2005). Several reports on observations with Ge spectrometers suggest a width of the line in the 2–3 keV range (Smith et al. 1993; Leventhal et al. 1993; Harris et al. 1998). Using only OSSE data, Kinzer et al. (1996) derived a positronium fraction of 0.970.03. Measurements with the Ge detector TGRS onboard the WIND mission (1995-1997) gives a compatible value of 0.940.04 (Harris 1998). From the line width and the positronium fraction measurements, Harris et al. (1998) concluded that a scenario in which annihilation does not occur either in cold molecular clouds or in the hot phase of the ISM is favored. Using preliminary SPI data of Jean et al. (2003) and TGRS data of Harris et al. (1998), Guessoum et al. (2004) showed that the bulk of the annihilation occurs in warm gas. However, they do not exclude that a significant fraction of the annihilation may occur in hot gas and in interstellar dust. Recently, Churazov et al. (2005) inferred from SPI measurements that the spectral parameters of the emission can be explained by positrons annihilating in a warm gas or in a combination of warm and cold gases.
In the present work, we include in the spectral analysis the classical model of the ISM described by McKee & Ostriker (1977). In this model, the ISM consists of molecular clouds, atomic gas in either a cold or a warm phase, and ionized gas in either a warm or a hot phase. Each phase is characterized by particular physical conditions in abundance, temperature, ionization fraction and density. Since the annihilation process and the Doppler broadening depend on the target properties (H atoms, electrons, velocity…) positrons annihilating in a given phase emit a particular spectrum. For instance, positrons in a cold medium annihilate mostly by forming positronium in flight, whereas the dominant process in a warm ionized medium is radiative recombination with free electrons. The spectral characteristics of the annihilation in the various ISM phases were first studied by Guessoum et al. (1991). They were recently revisited by Guessoum, Jean & Gillard (2005) – herafter GJG05 – in view of the most recent results on positron interaction cross sections with H, H2 and He as well as a detailed study on the annihilation in dust grains.
In the next section, we present the SPI observations and the method used to analyse the spectral distribution of the annihilation emission. We take into account the SPI spectral response (continuum Compton, energy resolution and line deformation due to radiation damage). In section 3, we present the results of the spectral analysis. We adopt two different approaches consisting of (a) an adjustment of simple Gaussian and ortho-positronium laws and (b) a fit of the ISM phase fractions using the spectral characteristics of the annihilation in each phase calculated by GJG05. This approach differs from that of Churazov et al. (2005) who fit the temperature and ionized fraction of the gas where annihilation occurs with a measured spectrum based on 4.5 106 s duration SPI observations of the Galactic Centre region. In section 4, we discuss the implications of these results for the origin and physics of Galactic positrons and in section 5, we summarize the most important new information.
2 Observations and analysis methods
2.1 Observations and data preparation
The data analysed in this work are those of the December 10, 2004 public INTEGRAL data release. The data span the IJD epoch 1073.394–1383.573, where IJD is the Julian Date minus 2 451 544.5 days. In order to reduce systematic uncertainties in the analysis, we exclude observation periods with strong instrumental background fluctuations. These background variations are generally due to solar flares or the exit and entry of the observatory into the Earth’s radiation belts. After this cleaning, we obtain a total effective exposure time of 15.2 Ms. The exposure is rather uniform in the central regions of our Galaxy from where most of the annihilation signal is observed (see Knödlseder et al. 2005).
The spectrum is extracted by model fitting, assuming that the sky intensity distribution is a 8o and 7o FWHM 2D-Gaussian. This distribution is one of the best fitting models derived by Knödlseder et al. (2005) who studied in detail the morphology of the annihilation emission. This spatial distribution does not correspond to the spatial distribution of the Galactic diffuse continuum emission, which is expected to be more extended in longitude and less extended in latitude. Therefore the intensity of the Galactic diffuse continuum emission, calculated in the spectral analysis, is overestimated (see section 3.1). However, this systematic error does not affect the shape of the annihilation spectrum since the Galactic continuum emission is fitted by a power-law and, consequently, this overestimation factor is the same over the whole energy band.
We perform the analysis in 1 keV wide energy bins for a 200 keV wide spectral window covering 400–600 keV. Each energy bin is adjusted to the data for each germanium detector separately, assuming that the count rate is due to the sum of the sky contribution and the instrumental background. The latter is assumed to be the sum of 3 terms: a constant, a component proportional to the rate of saturating GeD events (GEDSAT rate) and a component proportional to the convolution product of the GEDSAT rate with a 352 day exponential decay law (see Eq. 1 in Knödlseder et al. 2005). The last two components are tracers of the short time scale and radioactive build up variation of the instrumental background at 511 keV, respectively.
Figure 1 shows the resulting spectrum. For comparison, and to illustrate the quality of the background subtraction, we also show the detector averaged count rate spectrum. While overall the background subtraction is satisfactory, significant residuals remain at the location of some of the strong background lines. For instance, the 439 keV line, emitted in the decay of the metastable state of the 69Zn isotope is not properly removed. This metastable state has a half-life of 14h and consequently the temporal variation of this background line differs from the background model used in the model fitting. This gives rise to residuals that may induce systematic errors in the spectral analysis.
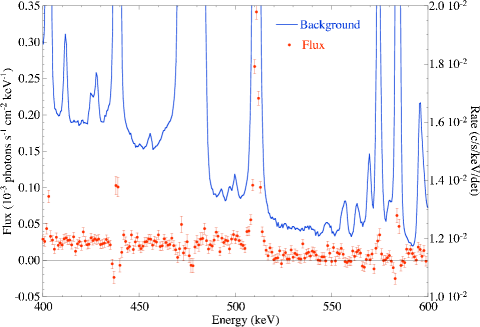
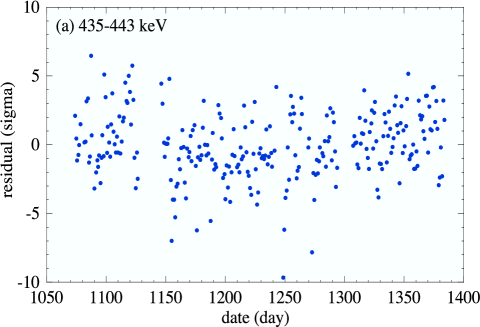
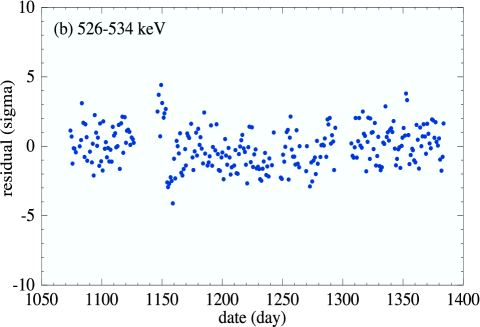
Figure 2 presents the residuals of the detector averaged count rate after subtraction of the background and sky models in the 435–443 keV and 526–534 keV bands. The residuals of the first band, which contains the 439 keV line, show large fluctuations leading to a reduced of 5.4, while the reduced is 1.9 for the 526–534 keV band which is free of strong background lines.
2.2 Spectral analysis methods
In order to avoid influences of instrumental background lines on the spectral analysis, we select the following energy bands, which are relatively free of systematic residuals (see previous subsection): 406–435, 443–467, 480–570, 578–580 and 589–593 keV. They cover 75% of the extracted energy range. This is sufficient (1) to quantify accurately the flux of the ortho-positronium continuum and (2) to characterize the shape of the annihilation line.
The spectral response of the instrument to a narrow (Dirac like) gamma-ray line is an instrumentally broadened Gaussian plus a Compton continuum. Due to radiation damage, the shape of the Gaussian is deformed with a low energy tail111High energy protons and neutrons impinging on the detectors displace Ge atoms in the crystal and then increase the number of hole traps. These traps reduce the number of collected holes, leading to an underestimation of the energy released by the photon in the detector.. This warping may affect the determination of the physical line width and has to be taken into account in the analysis. A simple way to model radiation damage is to convolve a Gaussian with a decreasing exponential function of energy (see Eq. 1). The energy scale of the exponential function quantifies the level of degradation and is called the “degradation parameter” hereafter. The degradation increases with time but is regularly removed by the annealing process (Roques et al. 2003). Analysis of the shapes of adjacent background lines yields an energy resolution at 511 keV of 2.0 keV FWHM and a mean degradation parameter = 0.3 keV, in agreement with previous analyses (Roques et al. 2003; Lonjou et al. 2005).
The Compton continuum shape and level at 511 keV is extracted from the IRF (Imaging Response Function) and RMF (Redistribution Matrix File) available in the SPI data processing database. These reponse matrices were generated by Monte-Carlo simulations (Sturner et al. 2003). Since the annihilation emission has an extent of 8o FWHM and INTEGRAL scans this emission, we average the IRFs in the field-of-view of SPI.
The spectral response function is:
| (1) |
where is a Gaussian with a FWHM of = 2.0 keV, denotes a convolution product and is the Compton continuum function. We then convolve models of the astrophysical signal, , with this spectral response and fit the set of parameters using the measured spectrum.
We adopt two different approaches to characterize the spectral distribution of the annihilation emission:
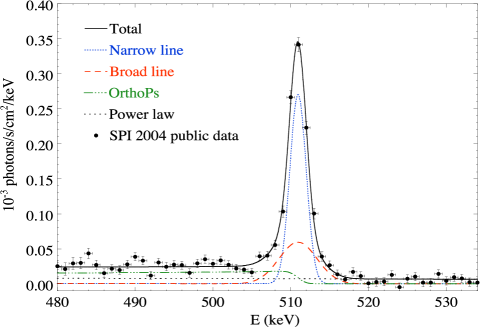
In the first approach, the “independent model”, we model the spectrum by four independent components: two Gaussians (to model narrow and broad 511 keV lines of FWHM ), the ortho-positronium continuum and a power law to account for Galactic diffuse continuum emission. The independent model is described by:
| (2) | |||||
where , , and are the flux and width (FWHM) of the narrow and broad lines, respectively. is the flux of the ortho-positronium continuum, which is represented by the Ore & Powell (1949) function . is the amplitude of the Galactic continuum at 511 keV and is the slope of the power law spectrum.
In the second approach, hereafter called the “ISM model”, we adopt the spectral characteristics (line shape and ortho-positronium continuum relative flux) for the different ISM phases given in the model calculated by GJG05, and with these spectral characteristics, we adjust the phase fractions so as to obtain the best fit to the measured spectrum. The “ISM model” is described by:
| (3) |
where is the normalized spectral distribution (in keV-1) of the annihilation photons in phase with =molecular, cold, warm neutral, warm ionized, hot, is the annihilation flux (photons s-1 cm-2) and represents the fraction of dust grains ( = 1 in the standard grain model of GJG05); allows for uncertainties in dust abundance and positron-grain reaction rates. Annihilation in dust grains is significant only in the hot phase where the standard grain model ( = 1) yields a FWHM of 2 keV, as opposed to a line width of 11 keV in the absence of grains ( = 0). The grain fraction has a negligible effect in the molecular, cold and warm neutral phases, and affects the 511 keV line width in the warm ionized gas by less than 2%. The grain fraction is a free parameter of the fit, and so too are the phase fractions , subject to the requirement that = 1.
In both cases, the spectral distribution of the Galactic continuum emission is assumed to be a power law with amplitude at 511 keV and a fixed slope of = -1.75 as derived by OSSE measurements in this energy range (Kinzer et al. 1999; Kinzer et al. 2000). The energy band analysed is not large enough and the SPI exposure not sufficient to constrain the slope accurately from the data themselves. We also fix the line position at 511 keV since we observe a relatively symmetric distribution of the emission around the Galactic Centre and do not expect a Doppler shift due to Galactic rotation in this region. Moreover, Churazov et al. (2005) did not measure a significant shift of the line centroid.
The models (Eqs. 2 & 3) are convolved with the SPI spectral response, (Eq. 1). The parameters of each model are fitted by minimizing the . The individual errors on the best fit parameters are obtained by calculating their confidence intervals for which 1 (1 uncertainty) with and the minimum value of .
3 Results
3.1 Independent model
When fitting the line with a single Gaussian, we obtain a of 193.7 for 150 degrees of freedom, a line width of (2.20.1) keV, a 511 keV line flux of (1.010.02) 10-3 photons s-1 cm-2 and an ortho-positronium flux of (4.30.3) 10-3 photons s-1 cm-2. We clearly see a significant excess of counts in the wings of the narrow line, suggesting the presence of a broad line (see Fig. 3). This broad line is presumably due to the annihilation of the para-positronium state formed in flight. We then include the broad line in the analysis and use the model presented in Equation 2.
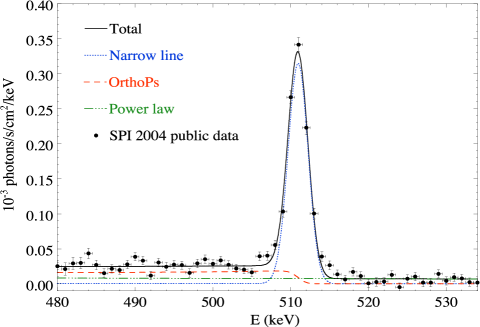
In this model, the parameters to be adjusted are the widths of the narrow and broad lines, their intensities, the ortho-positronium continuum flux and the level of the Galactic diffuse continuum. Figure 4 shows the result of the fit. We obtain a value of 171.3 for 148 degrees of freedom. The value is improved by 22.4 with respect to the value obtained when we fit the line with a single Gaussian.
The measured parameters are listed in Table 1. The detection significance of the broad line is 3.2. Its FWHM (5.36 1.22 keV) is in agreement with the width of the annihilation line of positronium formed in flight in H (5.8 keV; see GJG05). The total line (narrow+broad) flux is =(1.070.03)10-3 photons s-1 cm-2, in agreement with the flux derived by Knödlseder et al. (2005) for the 2D Gaussian shaped emission profile. The measured ortho-positronium flux yields a ratio I3γ/I2γ of 3.95 0.32 and consequently a positronium fraction of fPs = 0.967 0.022, also in agreement with previous measurements (Kinzer et al. 1999; Harris et al. 1998; Churazov et al. 2005). The statistical uncertainties of I2γ and I3γ/I2γ are not obtained by combining quadratically the uncertainties of I3γ, In and Ib as listed in Table 1, since these parameters are not independent. Instead we fit the parameters of the function:
| (4) | |||||
where = I3γ/I2γ and fn is the fraction of 511 keV flux in the narrow line. The width of the narrow line (1.320.35 keV) can be explained by thermalized positrons annihilating either in the warm neutral medium (1.16 keV) or in the warm ionized medium (0.98 keV). We also searched for a component with a 11 keV FWHM as expected from positrons annihilating in a hot (106 K) interstellar grain-free gas. We obtain only an upper limit of 0.36 10-3 photons s-1 cm-2 (2) for such a component, whereupon we conclude that annihilation in a hot plasma contributes less than 7 to the total annihilation flux.
The Galactic continuum intensity at 511 keV () is slightly larger than the 4–6 10-6 photons s-1 cm-2 keV-1 obtained by Kinzer et al. (1999) with OSSE measurements. However, these authors extracted this spectral component assuming a uniform distribution along the Galactic plane with a latitude width of 5o FWHM, while we assume a latitude width of 7o FWHM. This can explain the factor 7/5 discrepancy between the two estimations.
In order to estimate systematic errors, we first performed the analysis with the uncertainty of the spectrum bins increased by a factor such that the reduced is equal to 1. This factor is found to be 1.075, yielding 7.5 systematic errors. Secondly, we quantified the effect on the results of possible uncertainties in the fixed parameters (degradation parameter, slope of the continuum). The uncertainty in the degradation parameter affects neither the continuum intensities nor the total 511 keV flux. Performing the analysis with = 0.2 keV and 0.4 keV yields differences of less than 1.5 of the statistical errors in these parameter values. Nevertheless, the narrow and broad line widths (and fluxes) change by 14 (and 13) and 4.5 (and 13) of their statistical uncertainties, respectively. We adopt these values as systematic errors for the parameters of the lines. Kinzer et al. (1999) did not provide uncertainties in the slope of the Galactic Centre continuum spectrum measured by OSSE. Kinzer et al. (2001) used a slope of -1.65 to adjust the Galactic continuum model to the OSSE data. Considering the results presented in Table 3 of Kinzer et al. (1999), we can reasonably assume an uncertainty of 0.1 in the slope. This yields a systematic error of 10 in the intensity of the ortho-positronium continuum in our analysis, the other parameters being not significantly affected by this change (less than 1 of the statistical errors). The corresponding systematic uncertainty in the fraction of positronium is then 0.3%.
We also constructed another spectrum by model fitting (see section 2.1) but excluding regions of observations for which the Crab nebula and Cyg X-1 are in the field-of-view of SPI, in order to check whether these sources produce a bias in the analysis results. The statistical error bars of the spectrum are larger due to the smaller amount of data in this dataset. The analysis of this spectrum provides results that are statistically consistent with those presented in Table 1.
3.2 ISM model
The parameters of this model are the phase fractions (), the grain fraction (), the annihilation flux () and the amplitude of the Galactic diffuse continuum at 511 keV (; see Eq. 3). Figure 5 shows the best-fit model and Table 2 the corresponding parameters. The 1 statistical uncertainties in the phase fractions were calculated separately by searching for the 68.3% confidence interval of a phase fraction allowing the other parameters to vary but keeping the constraints = 1. The total annihilation flux and the continuum amplitude at 511 keV obtained by this analysis are consistent with the independent model analysis. The spectral characteristics of the measured annihilation emission can be explained by positrons annihilating only in the warm ISM. Our best fit for the cold phase fraction is 0, however the upper-limit for this value is 23%, so we cannot yet reject a significant contribution from this phase. The contribution of positrons in molecular clouds and hot gas is negligible since we obtain upper-limits of 8% and 0.5%, respectively.
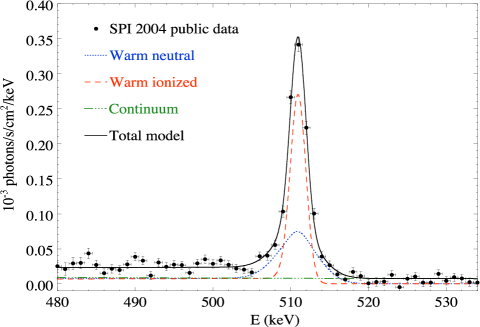
The total positronium fraction ( = 93.5 %) is calculated according to the intrinsic positronium fraction of each phase predicted by the GJG05 model, weighted by the phase fraction . The positronium fraction in each phase is the sum of the contributions of positroniums formed in flight and in thermal conditions (via charge exchange and radiative recombination). These contributions were calculated using the probabilities of charge exchange in flight and the annihilation rates tabulated in GJG05. It should be noted that in this analysis, the fraction of ortho-positronium continuum is tied to the phase fractions.
Applying the method described in section 3.1, we find 9 of systematic errors with this analysis, leading to the systematic uncertainties presented in Table 2 for the molecular and cold phase fractions, while we obtained of systematic uncertainty for the warm neutral phase fraction. However, when the fit of the phase fraction is performed with a degradation parameter () of 0.2 keV (0.4 keV), the optimal fractions are 51 (47) and 49 (53) for the warm neutral and warm ionized phases, respectively, the other fractions do not change and the fraction of positronium is 0.938 (0.933). The uncertainty in the slope of the continuum power-law model does not affect the results of the fit. Then to be conservative, the systematic errors for the warm neutral and ionized phase fractions are taken to be and 0.02 respectively, and 0.3% for the positronium fraction.
We now present the salient characteristics of the different spectral forms of the annihilation radiation that emerges from the different phases of the ISM; this will serve as a guide in the determination of the relative contributions of the different phases. The annihilation spectra for the different ISM phases can be characterized by the sum of three components: a narrow line due to the annihilation of thermalized positrons (except in the hot phase where the line is broad: a width of 11 keV), a broad line emitted by the annihilation of positronium formed in flight, and an ortho-positronium continuum.
Table 3 summarizes the spectral characteristics of the annihilation emission in the different phases. The widths of the 511 keV line listed in this table were extracted from Table 3 of GJG05. The relative intensities of the different components () and the fraction of positronium () for each phase were calculated using the fractions of positronium formed in flight in each case and the annihilation rates tabulated in GJG05 (see Tables 2 & 4 therein), assuming = 0. Since annihilation in dust grains is significant only in the hot phase (see section 2.2), we also calculated the spectral characteristics (, & ) of the annihilation emission from this phase with = 1. The spectral characteristics obtained by the best-fit models are also shown for comparison. They were calculated using the results presented in Tables 1 and 2 of the present paper. By comparing the relative intensities of the annihilation features in each phase with the measured ones, we can conclude that the annihilation emission from a single phase cannot explain the measured spectral characteristics. A combination of annihilation emission from several phases is needed.
In the warm ionized phase, 87.4% of positrons annihilate after thermalization, forming positroniums by radiative recombinaison with free electrons, while the remaining positrons annihilate directly with free electrons. In both annihilation processes, the width of the 511 keV line (0.98 keV) can explain the narrow line component of the measured spectrum (Fig. 4 and 5). There is no formation of positronium in flight in this phase since the totality of H is ionized, thus no broad line is emitted. In the warm neutral phase, 94% of positrons form positroniums in flight; one-fourth of them annihilate producing a 511 keV line emission with the 5.8 keV width required to explain the broad line component observed in the SPI data. The remaining 6% of positrons thermalize and have sufficient kinetic energy to form positroniums by charge exchange with H atoms – one-fourth of these positroniums annihilate producing a narrow ( = 1.16 keV) but weak ( 1.2 %) 511 keV line. Consequently, the total positronium fraction in the warm neutral phase is 99.9%.
Combining 49% of annihilation in the warm neutral phase with 51% of annihilation in the warm ionized phase as derived by the best-fit of the phase fractions yields 94% total positronium fraction and the measured relative fluxes . The broad line component with the required width can also be due to the annihilation of positroniums formed in flight in cold gas. However, most of the thermalized positrons annihilate directly with H in this phase (the temperature is too low in the cold gas to allow the formation of positronium by charge exchange), and therefore the total fraction of positronium is only due to the positroniums formed in flight (94%). Consequently, annihilation emission from the cold gas alone, or even combined with the annihilation emission from the warm ionized phase cannot (1) reproduce the measured positronium fraction and (2) explain the shape of the annihilation spectrum. However, a mix of annihilation emission from the cold gas and the warm neutral phase both combined with 51% of annihilation emission from the warm ionized phase can reproduce the measured spectrum. This explains the uncertainty values on the cold and warm neutral phase fractions obtained by the best fit (see Table 2). Similar conclusions hold for the contribution of the annihilation emission from the molecular medium, which in addition is characterized by (1) narrow and broad 511 keV line widths that are both slightly larger than the cold phase’s, and (2) a positronium fraction lower than those of the cold gas and the warm phase (see Table 3). These differences significantly reduce the possible contribution of the molecular medium to the best-fit model. For the hot phase, the widths of the calculated annihilation line, with or without grains, are too broad and the positronium fraction too low for this phase to contribute substantially in the model.
4 Discussion
Our analysis suggests that Galactic positrons annihilate primarily in the warm phases of the ISM. A similar conclusion was reported in previous analyses (Harris et al. 1998; Churazov et al. 2005). Since positron annihilation takes primarily place in the Galactic bulge region (Knödlseder et al. 2005), we now compare the current knowledge about the ISM in this area (i.e., within 600 pc radius of the Galactic Centre, corresponding to an approximative bulge size of 8o FWHM) with our results.
4.1 Gas content in the Galactic bulge
The gas content in the Galactic center region is not well known. The gas content of the Galactic bulge as well as its influence on the morphological and spectral characteristics of annihilation emission are under study and will be presented in a future paper (Gillard et al. in preparation). Launhardt et al. (2002) analysed IRAS and COBE data and showed that the nuclear bulge (region inside a Galactocentric radius of 230 pc with a scale height of 45 pc) contains 7 107 M⊙ of hydrogen gas (the mass of 2 107 M⊙ quoted in their paper has to be corrected by a factor 3.5; Launhardt, private communication).
Launhardt et al. (2002) also argued that roughly 90% of the interstellar mass in this region is trapped in small high-density (104 cm-3) molecular clouds with a volume filling factor of a few %, while the remaining 10% is homogeneously distributed and constitutes the intercloud medium with an average density 10 cm-3 and probably a high ionization fraction. From radio observations, Mezger & Paul (1979) deduced a mass of HII gas in this region of 1.4 106 M⊙ with an electron density n 10 cm-3 and an electron temperature T 5000 K. Observations of the 21 cm line yield a HI mass of 3.1 106 M⊙ in this region (Rohlfs & Braunsfurth 1982). The mass of H2 in the nuclear bulge is estimated by subtracting this HI mass and the HII mass derived from the model of Lazio & Cordes (2003)222The mass of HII derived from the model of Lazio & Cordes (2003) is in agreement with the measurements performed by Mezger & Paul (1979) from the total mass of hydrogen gas measured by Launhardt et al. (2002).
The rest of the gas in the Galactic bulge is contained in the asymmetric Galactic bar. Its shape can be approximated by an ellipsoid with semi-major axis 1.75 kpc and semi-minor axes 0.6 kpc (Bissantz, Englmaier & Gerhard 2003). The interstellar gas is not uniformly distributed across the bar, which makes its mass difficult to estimate. Mezger et al. (1996) derived a mass of HI gas 4 107 M⊙ in the bar from far infra-red and C18O line observations. We can resonably assume that the HI gas mass is equally distributed between cold and warm neutral gases, as in the Galactic disk (Ferrière 1998). Based on 13CO observations (Combes 1991) and a recent value of the abundance ratio 13CO/H2 (Martin et al. 2004) we estimate a mass of H2 gas 2 107 M⊙ in the bar.
For the warm and hot ionized phases we consider the volume inside 600 pc for which the Galactic free-electron density model of Lazio & Cordes (2003) yields an HII gas mass of 2 106 M⊙. We assume that 90 of this mass is in the warm ionized phase and 10 in the hot phase, similar to the proportion found in the Galactic disk (Ferrière 1998).
From this mass model and the rough geometrical distribution of the gas in the Galactic bulge region, we derive the space-average densities of the five interstellar phases. Since gravity is stronger in the Galactic bulge than near the Sun, we expect the gas to be more compressed there than locally. We then estimate the true density of each phase in the bulge by multiplying its true density measured near the Sun333with =1000, 40, 0.4, 0.21 and 3.410-3 cm-3 in the molecular, cold, warm neutral, warm ionized and hot phase respectively (Ferrière 1998)., by a common “compression factor” , whose value is set by the requirement that = 1, where = is the volume filling factor of phase i. This requirement leads to 3.6, and hence to the densities and filling factors listed in Table 4. The true density obtained for the molecular gas with this method is in agreement with the observations of Launhardt et al. (2002), Martin et al. (2004) and Stark et al. (2004).
If positrons are generated uniformly in the Galactic bulge and annihilate in situ (i.e. without propagation) then, in stationary conditions, the phase fraction fi of each phase must be equal to its filling factor . In this case, one would expect the hot medium to be the dominant component. However, in a 0.01 cm-3 density hot medium, 1 MeV positrons thermalize in 4 106 years and then annihilate on a timescale 108 years if there are no interstellar grains in this phase; in the standard grain model the annihilation timescale is 107 years (GJG05). With such long timescales it is likely that positrons escape the hot medium (before they can annihilate), either by propagation or following an encounter with a supernova shock wave (timescales 0.5–1 Myr; Cox 1990). Positrons escaping the hot medium then have a high probability of entering a warm phase due to the large filling factor of this phase (c.f. Table 4). If such positrons annihilate in the warm phases, then the phase fractions between the warm neutral and warm ionized phase should be close to the relative values of their filling factors. In order to verify whether positrons escape a given ISM phase or not, it is necessary to estimate the distance they travel within this phase and compare it with the typical half-size of the phase.
4.2 Propagation of positrons
The distance travelled by positrons depends on their initial velocity and their energy loss rate, which is a function of the density and the ionization fraction of the ambient medium. The timescale for 1 MeV positrons to thermalize in a warm medium is 105 years. Positrons then annihilate with a timescale 3.4104 years in the 0.8 cm-3 density warm ionized phase. In the 1.5 cm-3 density warm neutral gas, positrons that do not form a positronium in flight by charge exchange with H, take 1.3104 years to annihilate. Typical sizes of warm and hot regions are 100 pc. Roughly speaking, positrons will escape the hot phase if the distance travelled by diffusion in a time 107 years (slowing down time plus annihilation time in the standard grain model) is greater than the typical half-size of hot region, 50 pc, i.e., if the diffusion coefficient is greater than 1.31025 cm2s-1. On the other hand, positrons that enter the warm phases will annihilate if the distance travelled by diffusion in a time 105 years is less than 50 pc, i.e., if is smaller than 1.31027 cm2s-1. These limits have to be compared with the quasilinear diffusion coefficient (Melrose 1980) which can be expressed as:
| (5) |
with the Bohm diffusion coefficient, the positron gyroradius, the positron velocity, the maximum scale of the turbulence, = 5/3 for a Kolmogorov turbulent spectrum, and = BB the relative perturbation in magnetic field pressure which is often approximated to 1, since the turbulent component of the ISM magnetic field has been estimated to be of the same order of magnitude as the regular magnetic field.
The magnetic field strength in the Galactic Centre region was estimated to be 10 G (Sofue et al. 1987; La Rosa et al. 2005). The maximum scale was estimated to be 100 pc from measurements of ISM turbulence (Armstrong et al. 1995). Then for 1 MeV positrons in the Galactic bulge, 31026 cm2s-1. This coefficient is well above and below and leads support to our hypothesis that positrons indeed escape the hot phase and subsequently annihilate in the warm phases.
However, quasilinear diffusion is valid only when positrons are in resonance with Alfvén waves. This condition is satisfied when:
| (6) |
with the Lorentz factor, , the proton mass, the positron mass and the Alfvén speed.
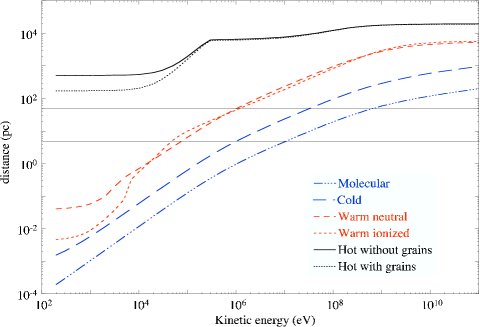
When the kinetic energy of positrons drops below a given threshold , quasilinear diffusion theory breaks down and the diffusion regime changes. is calculated for each phase using Eq. (6) together with B = 10G and the densities given in Table 4. The slowing down times for 1 MeV positrons to reach are listed in Table 4 as well as the associated distances which are obtained by:
| (7) |
The distances are lower than or of the same order as the typical half-sizes of the corresponding phases (see Table 4) except for the hot gas.
The diffusion regime of positrons with kinetic energies below is uncertain (interstellar winds, resonance with other plasma waves…) and is currently under study (Marcowith et al., in preparation). However we can estimate an upper-limit to the distance travelled by these positrons assuming that they propagate in a collisional regime. In this case, the distance is given by:
| (8) |
where is the lowest kinetic energy for which positrons are able to form a positronium in flight by charge exchange in the molecular, cold and warm neutral phases or are thermalized ( = k) in the warm ionized and hot phases (charge exchange does not happen in these phases since all the hydrogen is ionized). is the energy-loss rate. Accounting for the streaming of positrons in the ISM, at a characteristic velocity , we write the diffusion coefficient where is the distance over which interactions gradually deflect positrons with kinetic energy by 90o. was calculated according to Lang (1974) for a fully ionized plasma and using the approach of Emslie (1978) for neutral hydrogen. When positrons are thermalized, the distance they travel before annihilation is given by:
| (9) |
where is the annihilation lifetime of thermalized positrons. The resulting values of (see Table 4) confirm that 1 MeV positrons injected in the hot phase should escape it, while those injected in other phases should annihilate in them. Since positrons leaving the hot phase most likely enter the warm phases (due to their large filling factors) we expect that positron annihilation occurs mostly in the warm phases.
It has to be noted that several authors (see Morris & Serabyn 1996 and references therein) estimate magnetic field values of 1mG in the Galactic centre region. This is 2 orders of magnitude larger than the value (10G) used in our study. If we assume that this value is effective everywhere in the Galactic bulge, then this increases by 2 orders of magnitude and rules out quasilinear diffusion in the warm and hot phases for 1 MeV positrons (see Eq. 6). Consequently, we can only derive upper limits to the distances travelled by positrons in these phases, by assuming that they propagate in a collisional regime. Here again, a detailed investigation of the diffusion of positrons in a non-quasilinear regime is required to derive relevant distances of propagation.
4.3 Initial kinetic energy of positrons
The above estimates on the transport of positrons are based on the assumption that their initial kinetic energy is 1 MeV, which is a typical value for positrons emitted by radioactive nuclei. The actual mean energy of positrons from 56Co, one of the proposed candidates for the source of Galactic positrons, is 0.6 MeV. Figure 6 shows the maximum distance = ++ travelled by positrons before annihilating as a function of their initial kinetic energy in a 10 G magnetic field. The conclusions derived above, assuming 1 MeV positrons, obviously hold for positrons with E1 MeV even for the hot phase. Positrons with initial kinetic energy above 1 MeV would escape the warm and hot phases and would then have a chance to annihilate in molecular clouds provided they do not escape the Galactic bulge. However, the 1 MeV limit should not be considered as very constraining, since it was derived using rough estimates for the size of each phase (see Table 4). Moreover, we have to keep in mind that the calculated distances quantify the spatial extent of the distribution of annihilating positrons around the source. Then the fraction of positrons produced in a warm phase with initial energy of e.g. 2 MeV that escape this warm phase to annihilate in cold or molecular clouds, would probably be sufficiently low to be in agreement with the phase fractions derived by the spectral analysis, since most of these positrons would annihilate in the warm phase.
In our discussion, we have assumed that positrons are generated uniformly in the Galactic bulge. This assumption is valid in the case of numerous positron sources, including light dark matter annihilating into electron-positron pairs (Boehm et al. 2003). However, such positrons should have an initial kinetic energy lower than a few MeV to explain the measured spectrum. Other possible uniformly distributed sources in the Galactic bulge are type Ia supernovae, novae and low mass X-ray binaries, all of which belong to the old stellar population. However, these sources produce their own warm and hot phases by heating the surrounding ISM, so that they do not inject positrons in cold atomic and molecular regions.
Low energy (1MeV) positrons produced in the warm phase probably stay in this phase and annihilate at a distance 50pc from the sources. When such positrons are produced in the hot medium, they are likely to leave this medium and enter the warm phase within which they will annihilate. Then, assuming that the typical size of the hot phase does not exceed 200 pc and that positrons are produced at the edge of this phase, then the maximum distance covered by such positrons is 250 pc from the source. Therefore a single source releasing positrons in a warm or hot region (e.g. a gamma-ray burst as suggested by Parizot et al. 2005) might have difficulty accounting for the observed spatial extent of the annihilation emission, which covers a radius 600 pc around the Galactic centre.
5 Conclusions
The positron-electron annihilation emission spectrum can be explained by narrow and broad 511 keV lines plus an ortho-positronium continuum. The detection significance of the broad line is 3.2. The broad line width of (5.41.2) keV FWHM is in agreement with the value calculated by GJG05 for positronium formed in flight by charge exchange with H (5.8 keV). This value is also in agreement with the width (5.3 keV) calculated by Churazov et al. (2005). The narrow line width is (1.30.4) keV FWHM. This width is consistent with the 1 keV width of positrons annihilating by radiative recombination in the warm ionized medium.
Galactic positrons seem to annihilate mostly in the warm phases of the ISM. These results are in agreement with conclusions of Harris et al. (1998) and Churazov et al. (2005). We estimate that 50 % of the annihilation emission comes from the warm neutral phase and 50 % from the warm ionized phase. The contribution of molecular clouds and the hot phase are less than 8% and 0.5%, respectively. We cannot exclude from our spectral analysis that a significant fraction (23%) of the emission comes from cold gas. However in view of the gas content of the Galactic bulge, this fraction is expected to be negligible.
A preliminary study of the interstellar gas content and positron propagation in the Galactic bulge shows that the phase fractions derived from the spectral analysis are in agreement with the relative filling factors of the warm and low temperature gases. The lack of detection of annihilation in molecular and cold atomic gases could be explained by their low filling factors. The spectral analysis suggests comparable amounts of annihilation in the warm neutral and warm ionized phases of the ISM. This is in good agreement with our expectation if the positron sources are uniformly distributed and if the initial kinetic energy of positrons is lower than a few MeV, otherwise they may escape the warm phase of the ISM and annihilate in molecular or cold atomic regions.
Despite its large filling factor, positrons do not annihilate in the hot gas because its density is low enough to allow them to escape. Using quasilinear diffusion theory and assuming a magnetic field 10 G in the Galactic bulge, we estimate that, down to low kinetic energies, positrons are generally confined in warm and cold regions. In the hot phase, they should be less confined and assuming that they are released in a collisional regime when their kinetic energy drops below 270 keV, they have sufficient kinetic energy to escape it. However, the diffusion regime of positrons with keV energies in a hot low-density plasma is not yet known. More detailed studies on the Galactic bulge gas content and on the diffusive regime of positrons as a function of their energy and the magnetic field strength are under way and will be presented in forthcoming papers.
According to the rough gas model described in section 4, we expect the warm ionized component to dominate the annihilation emission in the nuclear bulge, while the warm neutral component should dominate in the Galactic bar. Additional exposure will make it possible to perform spectra in different regions of the Galactic Centre and confirm this prediction.
Our understanding of Galactic positron physics can be improved by imaging and spectroscopic explorations of Galactic regions other than the central regions, particularly by measurements of the annihilation emission from the Galactic disk, which appears to be explainable by 26Al decay (Knödlseder et al. 2005). While our understanding of positron annihilation in the Galactic Centre region is limited by the poor knowledge of both the sources and initial kinetic energy of positrons and the gas content in the Galactic bulge, the task would be easier for the disk emission, since: (1) we know that positrons from 26Al are released in the molecular ring region since COMPTEL onboard CGRO measured the spatial distribution of the 1.8 MeV gamma-ray line emitted during the radioactive decay of this isotope; (2) the average energy of such positrons has been measured to be 450 keV; (3) the distribution and characteristics of the gas in the molecular ring region are known with better accuracy than in the Galactic bulge. Consequently, the measured spatial distribution of the annihilation emission from the disk would teach us how far from the sources positrons annihilate and this will lead to estimates of their diffusion coefficient. The spectral characteristics of the disk emission would tell us in what phases of the ISM positrons annihilate. Since much 26Al is located in the molecular ring region, we expect to measure a strong 6.4 keV FWHM line component due to the annihilation of positronium formed in flight in H2 (see Fig. 5 of GJG05). On the other hand, the significance of the annihilation emission from the disk is still weak (3–4) after one year of the INTEGRAL mission. Additional exposure is needed to allow the spectral analysis to provide constraining results.
Additional note: After acceptation of this manuscript, a related paper (Weidenspointner et al. 2005) recently submitted, confirms that the spatial distribution of the positronium continuum emission measured using SPI data, is consistent with the 511 keV line emission distribution.
Acknowledgements.
We are grateful to R.J. Murphy for useful discussions on the energy loss rate of positrons in the ISM. We thank the anonymous referee for suggestions that have improved the quality of this paper.References
- Albernhe et al. (1981) Albernhe, F., et al. 1981, A&A, 94, 214
- Armstrong et al. (1995) Armstrong, J.W., Rickett, B.J. & Spangler, S.R. 1995, ApJ, 443, 209
- (3) Bissantz, N., Englmaier, P. & Gerhard, O. 2003, MNRAS, 340, 949
- Boehm et al. (2003) Boehm, C., et al. 2003, Phys. Rev. Lett., 92, 101301
- Churazov et al. (2005) Churazov, E., et al. 2005, MNRAS, 357, 1377
- Combes (1991) Combes, F. 1991, ARA&A, 29, 195
- Cox (1990) Cox, D.P. 1990, In The Interstellar Medium in Galaxies, eds H.A. Thronson & J. M. Shull, Kluwer, Dordrecht, pp. 181 200
- Dermer & Murphy (2001) Dermer, C. D. & Murphy, R.J. 2001, In: Exploring the gamma-ray universe. Proceedings of the Fourth INTEGRAL Workshop, 4-8 September 2000, Alicante, Spain. Editor: B. Battrick, Scientific editors: A. Gimenez, V. Reglero & C. Winkler. ESA SP-459, Noordwijk: ESA Publications Division, ISBN 92-9092-677-5, 2001, p. 115
- Durouchoux (1993) Durouchoux, P., et al. 1993, A&A Supp., 97, 185
- Emslie (1978) Emslie, A.G. 1978, ApJ, 224, 241
- FerriereA (1998) Ferriere, K. 1998a, ApJ, 497, 759
- FerriereB (1998) Ferriere, K. 1998b, ApJ, 503, 700
- Ferriere (2001) Ferriere, K.M. 2001, Rev. Mod. Phys., 73, 1031
- Ferriere (2003) Ferriere, K.M. 2003, in “Physique et Astrophysique du Rayonnement Cosmique”, Proceedings of Ecole de Goutelas held 2-6 June 2003, Goutelas, France, Edited by E. Parizot, A. Marcowith, V. Tatischeff, G. Pelletier & P. Salati, Observatoire Astronomique de Strasbourg & SF2A, p. 7
- Gehrels (1991) Gehrels, N., et al. 1991, ApJ Letters, 375, 13
- Gould (1989) Gould, R.J. 1989, ApJ, 344, 232
- Guessoum, Ramaty, Lingenfelter (1991) Guessoum, N., Ramaty, R., and Lingenfelter, R.E. 1991, ApJ, 378, 170
- Guessoum, Ramaty, Skibo (1997) Guessoum, N., Ramaty, R., and Skibo, J.G. 1997, in “The Transparent Universe,” Proceedings of the 2nd INTEGRAL Workshop held 16-20 September 1996, St. Malo, France, Edited by C. Winkler, T. J.-L. Courvoisier, and Ph. Durouchoux, European Space Agency, 1997, p.113
- Guessoum (2004) Guessoum, N., et al. 2004, in “The Integral Universe,” Proceedings of the 5th INTEGRAL Workshop held 16-20 February 2004, Munich, Germany, ESA SP-552, 57
- Guessoum, Ramaty, Lingenfelter (1991) Guessoum, N., Jean, P., and Gillard, W. 2005, A&A, 436, 171
- Harris (1998) Harris, M.J., et al. 1998, ApJ Letters, 501, 55
- Harris (2000) Harris, M.J., et al. 2000, The Fifth Compton Symposium, Proceedings of the fifth Compton Symposium, held in Portsmouth, NH, USA, September 1999. Melville, NY: American Institute of Physics (AIP), 2000. Edited by Mark L. McConnell and James M. Ryan AIP Conference Proceedings, Vol. 510., p.31
- Kinzer (2001) Kinzer, R.L., et al. 1998, ApJ, 559, 285
- Knödlseder (2005) Knödlseder, J., et al. 2005, A&A, in press
- Jean et al. (2003) Jean, P., et al. 2003, A&A, 407, L55
- Jean et al. (2004) Jean, P., et al. 2004, in “The Integral Universe,” Proceedings of the 5th INTEGRAL Workshop held 16-20 February 2004, Munich, Germany, ESA SP-552, 51.
- Lang (1974) Lang, K.R. 1974, Astrophysical Formulae, New York, Springer-Verlag New York, p. 224-225
- La Rosa et al. (2005) LaRosa, T.N., et al. 2005, ApJ, 626, 23
- Leventhal et al. (1978) Leventhal, M., MacCallum, C.J., & Stang, P.D. 1978, ApJ, 225, L11
- Leventhal et al. (1980) Leventhal, M., et al. 1980, ApJ, 240, 338
- Leventhal et al. (1982) Leventhal, M., Huters, A.F. & Stang, P.D. 1982, ApJ, 260, L1
- Leventhal et al. (1986) Leventhal, M., et al. 1986, ApJ, 302, 459
- Leventhal et al. (1993) Leventhal, M., et al. 1993, ApJ, 405, L25
- Lonjou (2004) Lonjou, V., et al. 2004, in “The Integral Universe,” Proceedings of the 5th INTEGRAL Workshop held 16-20 February 2004, Munich, Germany. ESA SP-552, 129
- Lonjou (2005) Lonjou, V., et al. 2005, Nucl. Inst. & Methods, accepted
- McKee & Ostriker (1977) McKee, C.F. & Ostriker, J.P. 1977, ApJ, 218, 148
- Martin et al. (2004) Martin, C.L., et al. 2004, ApJS, 150, 239
- Melrose (1980) Melrose, D.B. 1980, Plasma astrohysics. Nonthermal processes in diffuse magnetized plasmas, New York: Gordon and Breach
- Milne (2000) Milne, P.A., et al. 2000, American Astronomical Society, HEAD Meeting #5, #40.06; Bulletin of the American Astronomical Society, Vol. 32, p.1253
- Morris & Serabyn (1996) Morris, M. & Serabyn, E. 1996, ARA&A, 34, 645
- Parizot (2005) Parizot, E., Cassé, M., Lehoucq, R., et al. 2005, A&A, 432, 889
- Purcell (1997) Purcell, W.R., et al. 1997, ApJ, 491, 725
- Rohlfs & Braunsfurth (1982) Rohlfs, K. & Braunsfurth, E. 1982, A&A, 113, 237
- Roques (2003) Roques, J.P., et al. 2003, A&A, 411, L91
- Sofue et al. (1987) Sofue, Y., et al. 1987, PASJ, 39, 843
- Stark et al. (2004) Stark, A.A., et al. 2004, ApJ, 614, L41
- Strong et al. (2004) Strong, A.W., et al. 2004, in “The Integral Universe,” Proceedings of the 5th INTEGRAL Workshop held 16-20 February 2004, Munich, Germany. ESA SP-552, 507
- Sturner et al. (1996) Sturner, S.J., et al. 2003, A&A, 411, L81
- Teegarden (1996) Teegarden, B.J., et al. 1996, ApJ Letters, 463, 75