Oxygen from the High-Excitation Triplet in Open Cluster Dwarfs: Hyades11affiliation: Based on observations obtained with the Mayall 4-m telescope at Kitt Peak National Observatory, a division of the National Optical Astronomy Observatories, which is operated by the Association of Universities for Research Astronomy, Inc. under cooperative agreement with the National Science Foundation. 22affiliation: This paper includes data taken with the Harlan J. Smith 2.7-m telescope at The McDonald Observatory of the University of Texas at Austin.
Abstract
Oxygen abundances have been derived from the near-IR, high-excitation O I triplet in high-resolution, high signal-to-noise spectra of 45 Hyades dwarfs using standard one dimensional, plane-parallel LTE models. Effective temperatures of the stellar sample range from K, and the derived relative O abundances as a function of evince a trichotomous morphology. At , there is evidence of an increase in the O abundances with increasing , consistent with non-LTE (NLTE) predictions. At intermediate (), the O abundances are flat, and star-to-star values are in good agreement, having a mean value of ; however, systematic errors at the level might exist. The O abundances for stars with show a striking increase with decreasing , in stark contrast to expectations and canonical NLTE calculations. The cool Hyades triplet results are compared to those recently reported for dwarfs in the Pleiades cluster and the UMa moving group; qualitative differences between the trends observed in these stellar aggregates point to a possible age-related diminution of triplet abundance trends in cool open cluster dwarfs. Correlations with age-related phenomena, i.e., chromospheric activity and photospheric spots, faculae, and/or plages, are investigated. No correlation with Ca II H+K chromospheric activity indicators is observed. Multi-component LTE “toy” models have been constructed in order to simulate photospheric temperature inhomogeneities that could arise from the presence of starspots, and we demonstrate that photospheric spots are a plausible source of the triplet trends among the cool dwarfs.
1 INTRODUCTION
The derivation of stellar O abundances using spectra at visible wavelengths is generally limited to a small number of atomic features. The two sets of features most often used for O abundance determinations are a) two forbidden [O I] spectral lines at 6300.3 and 6363.8 Å, and b) the permitted high-excitation O I triplet in the 7771-7775 Å region. The formation of the [O I] lines is well described by current local thermodynamic equilibrium (LTE) calculations (Takeda, 2003), but the lines are weak in the spectra of solar-type stars and suffer from blends (e.g., Johansson et al. 2003). High-quality spectra and knowledge of the blending features are required if the forbidden lines are to be used for accurate abundance derivations. On the other hand, each line of the O I triplet is strong in the spectra of solar-type dwarfs and evolved stars at all metallicities, and they are presumably free from blends, making them a more attractive choice for O abundance studies. However, the O I triplet (henceforth the triplet) is known to be sensitive to non-LTE (NLTE) effects (Kiselman, 1991), and there is much controversy regarding its delivery of accurate O abundances.
The formation of the triplet is due to a high-excitation electronic transition (9.15 eV above the ground state) from the 3s orbital into the 3p orbital, with the multiple lines of the feature resulting from three possible values of the total angular momentum () in the terminal state. The NLTE behavior of the triplet is due to the dilution of each line’s source function () compared to the Planck function in the line forming region (Kiselman, 2001). Thus, O abundances derived using LTE calculations, which utilize a Planckian source function, are overestimated. The magnitude of the effect is expected to increase as the number of O atoms in the 3s state increases, for instance by an increase in the total number of O atoms, by a decrease in gas pressure, or by an increase in temperature in the line forming region (e.g., Takeda 2003, Kiselman 2001). In particular, Takeda (2003) has constructed an extensive collection of NLTE corrections for late-F through early-K stars in various evolutionary states with the general result that the NLTE corrections for a given adopted O abundance increase with increasing for all evolutionary states, with negligible corrections required for dwarfs with .
On the observational side, quantifying the NLTE behavior of derived triplet abundances is difficult because of the inhomogeneity of O abundances among field stars; star-to-star comparisons are generally not meaningful. This can be overcome by deriving simultaneously O abundances from the triplet and a feature predicted to be free from NLTE effects, such as [O I] line. For example, King & Boesgaard (1995) compared LTE O abundances as derived from the triplet and the [O I] in a sample of field dwarfs with a moderate range in metallicities (; [Fe/H] is used throughout this paper as a fiducial for metallicity). No significant difference in the O abundance from the two indicators was found for stars with , but an increasing difference- presumably due to larger triplet abundances- with increasing was evident in the warmer stars of the sample. The results of the King & Boesgaard study are in good agreement with NLTE predictions. Many other studies have derived NLTE O abundances using the triplet, with varying results. Additional observational behavior of the triplet compared to other O spectral lines has been covered extensively in the literature (e.g., Fulbright & Johnson 2003; Nissen et al. 2002; Mishenina et al. 2000; Israelian, García López, & Rebolo 1998), and we point the reader interested in a more thorough discussion to those publications.
Another tactic to investigate triplet departures from LTE is to analyze O abundances of open cluster stars. Open clusters are stellar aggregates composed of members believed to have a common age and chemical composition. These shared characteristics make intracluster comparisons ideal for probing mass-dependent stellar effects and intercluster comparisons ideal for probing age-related or metallicity effects-. Surprisingly, only a handful of cluster O studies have been done. García López et al. (1993) subjected the triplet in spectra of 25 Hyades (600 Myr, ) F dwarfs (), as well as 18 F dwarfs () in the Ursa Major (UMa) kinematic moving group (600 Myr, ), to an NLTE analysis. While good star-to-star agreement (within uncertainties) of the O abundances for both stellar samples was found, -dependent differences are seen when the stars are placed into bins. The mean bin O abundance decreases with decreasing for both the Hyades and UMa, raising questions as to the accuracy of the adopted NLTE corrections. King (1993) analyzed the triplet in the spectra of four Hyades dwarfs () and found star-to-star agreement in the LTE O abundances. King et al. (2000) derived LTE O abundances from the triplet in two Pleiades (100 Myr, ) and one NGC 2264 (10 Myr, ) K-dwarfs. Given the relatively low for these stars (), NLTE effects on the formation of the triplet are predicted to be negligible (Takeda, 2003), yet unexpectedly high O abundances were found for all three stars. No explanation for the high abundances was immediately obvious, but the authors speculated that yet unknown NLTE effects resulting from the presence of a chromosphere may be the cause (as suggested by Takeda 1995).
A more comprehensive study of LTE O abundances derived using the triplet in Pleiades dwarfs, as well as in M34 (200 Myr, ) dwarfs, has been presented by Schuler et al. (2004; henceforth SKHP). The stellar sample includes 15 Pleiads with and eight M34 dwarfs with , and in both cases, a dramatic increase in triplet [O/H] abundances with decreasing is seen for . The Pleiades results confirmed the high triplet-based O abundances initially reported by King et al. (2000) and are in contrast with canonical NLTE predictions. Furthermore, the Pleiades abundances evince scatter that exceeds uncertainties at . Following Takeda (1995), the triplet results were compared to and Ca II triplet chromospheric activity indicators from the literature. No correlations between O abundances and activity or O abundance scatter and activity scatter were found; it should be noted, however, that the O abundances and activity indices were not measured contemporaneously. SKHP proposed temperature inhomogeneities resulting from photospheric spots, faculae, and/or plages (henceforth collectively referred to as spots) as a possible explanation for the high O abundances, being influenced by the work of Stauffer et al. (2003) who suggested the anomalously blue color excess of Pleiades K-dwarfs may be due to the presence of spots. King & Schuler (2005) extended the study of the triplet to six UMa dwarfs in the range of 4925-5827 K, and the LTE O abundances show a similar increase with decreasing as seen in the Pleiades. The UMa trend, however, is shallower. The age and metallicity differences between the Pleiades and UMa suggest that triplet abundance trends observed among cool open cluster dwarfs might be influenced by effects related to either of these parameters.
The Hyades open cluster is the next logical target for our continued investigation of the ubiquity and nature of triplet-derived O abundance trends in cool cluster dwarfs. The cluster is observationally appealing because of the relative brightness of its members; late-K dwarfs are brighter than and thus within the capabilities of moderate-sized telescopes. More importantly, the physical characteristics are well-suited for this study. Its members are metal-rich compared to those in both the Pleiades and UMa, and they have an age that is approximately coeval to UMa members (King & Schuler, 2005). If a Hyades triplet trend is present, comparing its morphology to that of the Pleiades and UMa should provide valuable insight into its possible cause and evolution. Therefore, an LTE analysis of the triplet in high-resolution, high signal-to-noise (S/N) spectra obtained with the Mayall 4-m telescope and echelle spectrograph at Kitt Peak National Observatory and with the Harlan J. Smith 2.7-m telescope and the cross-dispersed echelle spectrometer at McDonald Observatory of 45 Hyades dwarfs is presented. The cool dwarf O abundances derived from the triplet are compared to previous open cluster results, and a plausible explanation for observed triplet trends is proffered.
2 OBSERVATIONS AND DATA REDUCTION
Hyades membership is well determined (Perryman et al. 1998), and the cluster is rich with G and K dwarfs. We made use of the recent studies of Yong et al. (2004) and Paulson et al. (2003) in constructing our target list, which contains 45 stars. The analysis presented herein makes use of three sets of high-resolution echelle spectra obtained with two telescopes on different dates. The majority of the sample were observed 2002 November 22-25 with the KPNO Mayall 4-m and accompanying Cassegrain echelle spectrograph. This sample will henceforth be referred to as KPNO-02. The echelle grating and cross disperser were used, resulting in a dispersion of and a resolution () at 7775 Å. The detector (T2KB) consists of pixels and has dimensions of ; no binning was used.
The second set of spectra was also obtained with the KPNO Mayall 4-m telescope and echelle spectrograph; the observations took place on the dates of 2004 December 20-23 (henceforth KPNO-04). These later observations utilized the echelle grating and the cross disperser. The data are characterized by a dispersion of and a similar resolution of () at 7775 Å. The T2KB detector was again used without binning.
The final set of spectra was obtained on 2004 October 10-12 with the Harlan J. Smith 2.7-m telescope and the ”2dcoude” cross-dispersed echelle spectrometer at McDonald Observatory (henceforth McD-04). The cs23 setting and E2 echelle grating () were used, giving a resolving power of () and dispersion of at 7775 Å. The angle of the echelle grating and cross dispersion prism was set manually so that the O I triplet fell well away from the edge of the detector. The TK3 detector, with pixels, is a square ccd, and it was used without binning. We note that one star (HIP 20146) was kindly acquired by Dr. J. Laird with the McDonald 2.7-m telescope in 1995 with a similar set-up as the 2004 2.7-m observations and is included in our sample. Its spectrum is of equal quality to the other McDonald data.
The stars in the combined sample are listed according to Hipparcos number, along with the HD number when available, in Table 1. The adopted stellar parameters (see below), as well as the telescope used to observe each object, are also presented therein. It will be noticed that a handful of stars have been observed during two different runs. This is beneficial in that it allows for the revelation of possible systematic errors that might be associated with a particular data set. A solar proxy spectrum of the daytime sky was obtained during each observing run, as is indicated in Table 1. The KPNO and McDonald data were reduced in a consistent fashion using IRAF333IRAF is distributed by the National Optical Astronomy Observatories, which are operated by the Association of Universities for Research in Astronomy, Inc., under cooperative agreement with the National Science Foundation., following standard procedures of bias subtraction, flat fielding, correction for scattered light, extraction, and wavelength calibration. A sample spectrum from each data set is shown in Figure 1. ††margin: Tab. 1 ††margin: Fig. 1
3 ANALYSIS AND RESULTS
3.1 Stellar Parameters
Effective temperatures have been derived photometrically following the procedure of Thorburn et al. (1993). Briefly, ( colors are transformed to ( colors using an empirical relation for Hyades dwarfs (Carney, 1983). Effective temperatures are then derived using the ()-relation of Carney (1983) modified to include the zero-point correction of Cayrel et al. (1985). The error in the resulting temperatures as reported by Thorburn et al. (1993) is . The () colors for the largest number of stars are from Allende Prieto & Lambert (1999), and for the stars not appearing therein, the colors are from Paulson et al. (2003) or Yong et al. (2004).
Surface gravities () have been determined by making use of the latest isochrones (Yi et al., 2003) and the interpolation routine provided by the consortium444See http://www.astro.yale.edu/demarque/yyiso.html to generate a stellar track suitable for the Hyades. The required cluster parameters for the interpolation are age, [Fe/H], and -enrichment ([/Fe]). There have been multiple studies on the age and Fe content of the Hyades. We have chosen an age of 600 Myr (e.g., Perryman et al. 1998; Torres, Stefanik, & Latham 1997) and a relative Fe abundance of (Paulson et al., 2003). Paulson et al. also derived the abundances of the Mg, Si, Ca, and Ti and found them to scale with Fe; thus the Hyades -enrichment has been taken to be zero. Surface gravities and effective temperatures taken from the stellar track characterized by the above parameters were fit with a fourth order Legendre polynomial using the curfit utility within IRAF. This utility provides equivalent power series coefficients which were used to create a -dependent relation for . The final values were calculated using the adopted described above. Additionally, the effect of the adopted stellar track parameters on the derived surface gravities has been tested by creating several additional stellar tracks interpolated with a mixture of relative iron abundances and ages ranging from and 600-700 Myr. The surface gravities derived from these different tracks never differ from the adopted values by more the 0.01 dex, demonstrating the insensitivity of the values for these main sequence (MS) dwarfs to the reasonable choice of cluster parameters. We have chosen a conservative error in of 0.10 dex.
Microturbulent velocities () are calculated using the empirical formula of Allende Prieto et al. (2004). The function predicts values with an rms scatter of . We have chosen a uncertainty of in our values. The adopted stellar parameters are given in Table 1.
3.2 Equivalent Widths
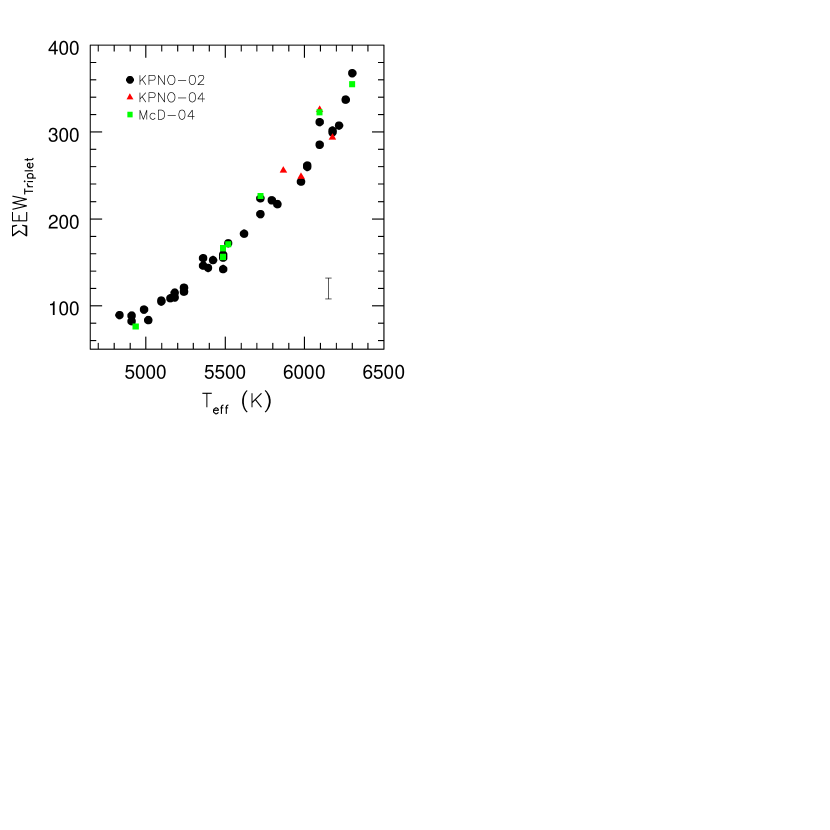
Continuum normalization and equivalent width (EW) measurements were carried out using the one-dimensional spectrum analysis package SPECTRE (Fitzpatrick & Sneden 1987). The triplet falls in two separate orders of the KPNO-02 data due to order overlap in the individual spectra. EWs of the triplet have been measured in both orders- designated as blue and red- and abundances are derived using the blue, red, and mean EWs. Gaussian profiles were used to determine the EWs of the triplet feature; the three lines were measurable in the spectra of all the stars except for eight: two lines were measurable for seven stars and one line for one star. These eight stars are generally the coolest stars in the sample as the triplet feature becomes increasingly weak in the spectra of dwarfs with decreasing temperature, ceteris paribus. The dependence of triplet EWs on is clearly seen in Figure 2. Only stars for which all three lines were measurable are plotted in the figure, and thus all the stars cooler than are not included. Also apparent in Figure 2 is the uniformity of EW measurements at a given shared among the different data sets. This is encouraging and suggests our individual samples do not suffer from observation-dependent systematic errors. The measured EWs and the per pixel signal-to-noise (S/N) ratio, as given by Poisson statistics, in the region are given in Tables 2 and 3. Some of the stars were observed multiple times during a given run, and the EW and S/N measurements for these were made using the co-added spectra. ††margin: Fig. 2 ††margin: Tab. 2
Empirical estimation of line strength uncertainties has been made by comparing the EWs from the blue and red orders of the KPNO-02 data. Line-by-line differences were calculated for each star in the KPNO-02 sample, and the mean difference for each line has been adopted as the uncertainty in the EW of the line. The final uncertainties are 4.4 mÅ for , 4.8 mÅ for , and 2.7 mÅ for and have been adopted for the entire stellar sample. It should be noted that 35 out of 36 stars comprising the KPNO-02 data set have effective temperatures greater than 4800 K and thus have larger EWs than the cooler stars in the sample. The adopted line strength uncertainties represent a far larger percentage of the EWs of the weaker features in the coolest stars and may not accurately reflect the errors associated with their measurement. Indeed, comparing the line strengths from the blue and red orders of the coolest star in the KPNO-02 sample (HIP 18322) gives uncertainties of 0.4 and 0.7 mÅ for the and lines, respectively; the line was not measurable for this star. Nonetheless, we conservatively adopt the larger EW uncertainties for the whole stellar sample. The final uncertainties in the derived abundances for the coolest stars are clearly dominated by the line strength errors and are large relative to the warmer stars; however, the final conclusions of this work remain unchanged.
3.3 Oxygen Abundances
Oxygen abundances have been derived following the procedure of SKHP using an updated version of the LTE stellar line analysis software package MOOG (Sneden 2004, private communication). Atomic data () are from the NIST555http://physics.nist.gov/PhysRefData/ASD/index.html database. Stellar atmosphere models characterized by the adopted stellar parameters and (Paulson et al., 2003) were interpolated from the ATLAS9 (LTE) grids of R. Kurucz666See http://kurucz.harvard.edu/grids.html. The grids utilized here include the convective overshoot approximation. The validity of using the overshoot models of Kurucz to derive Fe abundances for Hyades dwarfs has recently been questioned (Paulson et al., 2003), who suggest Kurucz grids without convective overshoot are more appropriate. However, SKHP derived triplet abundances in Pleiades and M34 dwarfs utilizing four different sets of ATLAS9 grids, including Kurucz grids with and without overshoot, and found the results to be independent of model atmosphere. Models with convective overshoot have been used here due to the availability of finer super-solar metallicity steps for these grids compared to grids without the overshoot approximation.
The derived mean O abundances and final internal uncertainties are presented in Table 4; the abundances are given relative to solar values (using the usual notation on a scale where ) via a line-by-line comparison. Solar abundances were derived in the same manner as the rest of the sample from spectra obtained during each observing run; each solar spectrum was used for comparison with only those stars observed during the same observing run. Abundance sensitivities to the adopted stellar parameters were determined by constructing additional model atmospheres characterized by single parameter changes of in , in , and in for each star and deriving the adjusted abundances in the same manner as above; typical sensitivities are given in Table 5. The resulting parameter-dependent abundance uncertainties are summed quadratically with uncertainties in line strengths and in the mean abundances to achieve the final internal uncertainties. ††margin: Tab. 3 ††margin: Tab. 4
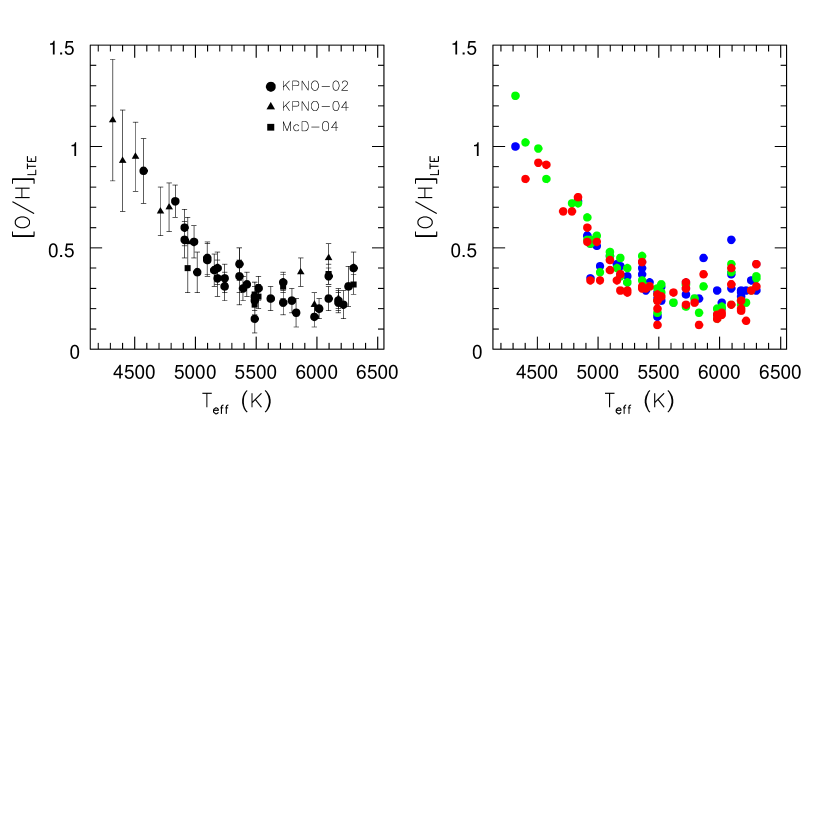
In Figure 3 the relative O abundances and associated error bars, as well as the line-by-line relative abundances for each star, are plotted against . The KPNO-02 abundances are those derived using the mean EWs. The error bars for the coolest stars are significantly larger than those for the warmer stars due to the large adopted EW uncertainties relative to the cool object line strengths, as described above. Regardless, a smooth increase in [O/H] vs is clearly seen for stars with , as well as an apparent increase for stars with . Also apparent is the lack of star-to-star scatter in the [O/H] abundances, in contrast to that observed among cool Pleiades dwarfs (SKHP). Abundances for stars that are common to more than one data set are given in Table 6. Comparing results from the different data sets reveals no statistically significant deviations. This was suggested by the uniformity of EWs in Figure 2, and more strongly demonstrated here. We are confident that no large systematic differences exist between the data sets, and they will no longer be distinguished. ††margin: Fig. 3 ††margin: Tab. 5
There are also no systematic differences in the line-by-line O abundances (Figure 3), which are in good agreement for each star and provide strong evidence that the triplet is not hampered by blends. Possible exceptions are the two coolest stars, HIP 19441 and HIP 20762. Only two of the three lines of the triplet were measurable for these two stars, and in each case, the abundance of the line is dex larger than that of the other measurable line. There is an Fe I line at () (Takeda et al., 1998) that may be enhancing the line strength of the O feature in the spectra of the coolest stars, and we have used MOOG to synthesize the triplet region of HIP 19441 in order to determine the magnitude of this effect. According to the relative line strength parameter provided by MOOG, the O line is expected to be an order of magnitude stronger than the Fe line, suggesting that this particular Fe feature is not responsible for the enhanced EW of the O line. Alternatively, systematic errors related to measuring the weak triplet in the spectra of the coolest dwarfs or a yet to be identified blend may be the cause of the seemingly higher abundance provided by the line. Regardless, if the abundance of the feature is ignored for the two coolest stars, the morphology of the cool dwarf abundance trend is not greatly affected.
One star, HIP 15310, has an O abundance that deviates from those of stars in the sample with similar (). Paulson et al. (2003) reports a Fe abundance for HIP 15310 that is larger than the cluster mean and introduced the possibility that this star might have been chemically enriched, possibly by the accretion of proto-planetary or planetary material. The observational evidence that host stars of the discovered planetary systems are statistically more Fe-rich compared to otherwise similar field stars that do not have planets is now well established (Fischer & Valenti, 2005). Two theories to explain the higher metallicity of planetary hosts have been discussed in the literature: a) planets form preferentially in high-metallicity environments, or b) planetary hosts are chemically enriched due to planetary accretion. Gonzalez (1997) suggested that a possible signature of accretion would be abundance enhancements correlated with condensation temperature. Oxygen is a volatile element with a condensation temperature of (in a gas of solar composition), and Fe is a refractory element with a condensation temperature of (Lodders, 2003). While a larger fraction of the initial O abundance of a gas condenses into rocky material than of other volatile elements- due to its role in the formation of silicates and oxides- the increase in its abundance in a stellar photosphere compared to refractory elements such as Fe should not be as significant if accretion has taken place. Adopting a mean Hyades O abundance using the stars in the range of 5450-6100 K (the range over which there is good agreement in O abundances; see below) and the mean cluster Fe abundance from Paulson et al. (2003), a cluster [O/Fe] ratio of +0.12 is attained. Paulson et al. derived an Fe abundance of for HIP 15310, and comparing this to the O abundance found here, for this star. From these results, it is apparent that HIP 15310 has not been chemically enriched by fractionated material, although more quantitative data on the expected relative O and Fe enhancements due to accretion are in order. Based on previous membership studies, Paulson et al. (2003) also question the cluster membership of HIP1 15310. Further investigation of HIP 15310 and its possible chemical enrichment is beyond the scope of this paper but certainly should be addressed in future studies.
4 DISCUSSION
Although the [O/H] abundances of the warmest stars () in the sample agree with those of slightly cooler stars within the calculated uncertainties (Figure 3), the abundances appear to be increasing with increasing . This behavior is consistent with previous triplet LTE abundance derivations of near-solar metallicity dwarfs (King & Boesgaard, 1995) and with expectations from canonical NLTE calculations (e.g., Takeda 2003). More interesting is the trend of increasing [O/H] abundances with decreasing , which is not congruous with expectations for open cluster stars nor predicted by NLTE calculations. In fact, NLTE corrections for MS dwarfs with are predicted to be less than 0.05 dex and decrease with decreasing according to Takeda (2003).
The triplet is highly sensitive to , and thus the cool dwarf O abundance trend may be a consequence of the adopted scale. At , the Hyades is the nearest open cluster and is well-studied photometrically and astrometrically, making the use of a color-temperature relation a seemingly reasonable choice for derivations of Hyades dwarf . However, Pinsonneault et al. (2004) was unable to fit an isochrone to the photometry of the Hyades cluster, especially for the reddest stars, using several color-temperature relations from the literature. They go on to demonstrate that their empirically calibrated luminosity-based temperature scale is in better agreement with the spectroscopically derived temperatures of Paulson et al. (2003) and argue the mismatch between photometry and theoretical colors is due to systematic errors in the color-temperature relations. In order to test the sensitivity of the cool dwarf abundances to our adopted photometric scale, temperatures using the empirically calibrated Hyades isochrone of Pinsonneault et al. (2004; ) and the metallicity-dependent temperature-color calibration of Ramírez & Meléndez (2005; ) have been derived. The temperature scale of Ramírez & Meléndez is derived using the infrared flux method (IRFM; Blackwell et al. 1990) and is an extension of the work of Alonso, Arribas, & Martínez-Roger (1996, 1999). The B-V colors from Table 1 and a cluster metallicity of were used to derive from the calibration of Ramírez & Meléndez (we use the coefficients for the metallicity-dependent polynomial correction that are applicable for ).
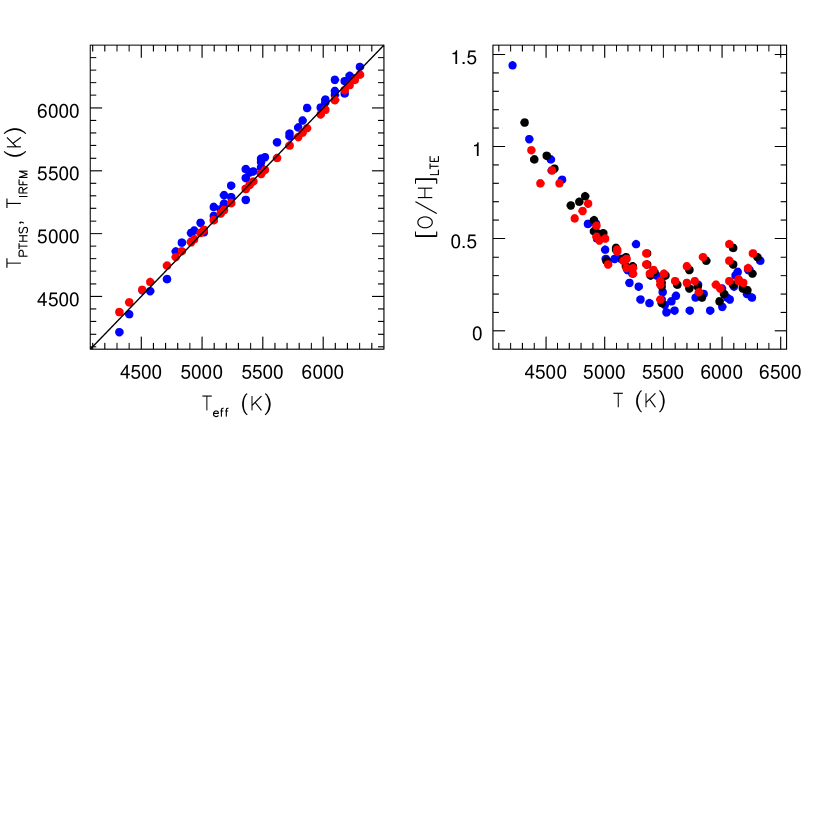
In Figure 4a, and are plotted against the adopted photometric . The Pinsonneault et al. isochrone-based temperatures of all but seven stars are higher than our adopted ones; temperature differences on a star-by-star basis are , with differences for about half of the sample being . Temperatures from the temperature-color calibration of Ramírez & Meléndez are in better agreement with , with star-by-star differences being , with all but nine having differences . For both and , absolute differences with are approximately less than or equal to the error , and thus no large-scale differences are found. Oxygen abundances have been rederived using the new temperatures, and the results are plotted along with the original values in Figure 4b. The abundances in Figure 4b have been culled of duplicates; in cases of overlap, preferred abundances are taken from the data set following the order KPNO-02, KPNO-04, and McD-04. The KPNO-02 abundances are those derived using the mean EWs, as described above. In the intermediate range of 5450-6100 K, the abundances of the dwarfs derived using are on average 0.06 dex lower than the original abundances. Outside of this intermediate range, the trends of increasing O abundances among both the warm and cool dwarfs remain. The abundances derived using do not differ significantly from the original abundances, and again, the cool dwarf abundance trend persists. In both cases, the differences in the abundances of the coolest stars are of the greatest magnitude, but they are generally within the calculated uncertainties. The pertinent result of this exercise is that the triplet abundance trend among the cool Hyades dwarfs presented here is apparently not due to an inaccurate scale. A similar conclusion was reached by SKHP in their study of the triplet in Pleiades dwarfs. This result is not surprising given the abundance sensitivities in Table 5. For the coolest stars in the sample, a change of over 400 K would be required to bring their abundances into concordance with those of the intermediate stars, where there is good star-to-star agreement. Comparing the adopted photometric scale to those of Pinsonneault et al. and of Ramírez & Meléndez suggests that uncertainties in our temperatures may be as high as 150 K, which is significantly less than what is required to eliminate the cool dwarf abundance trend. ††margin: Fig. 4
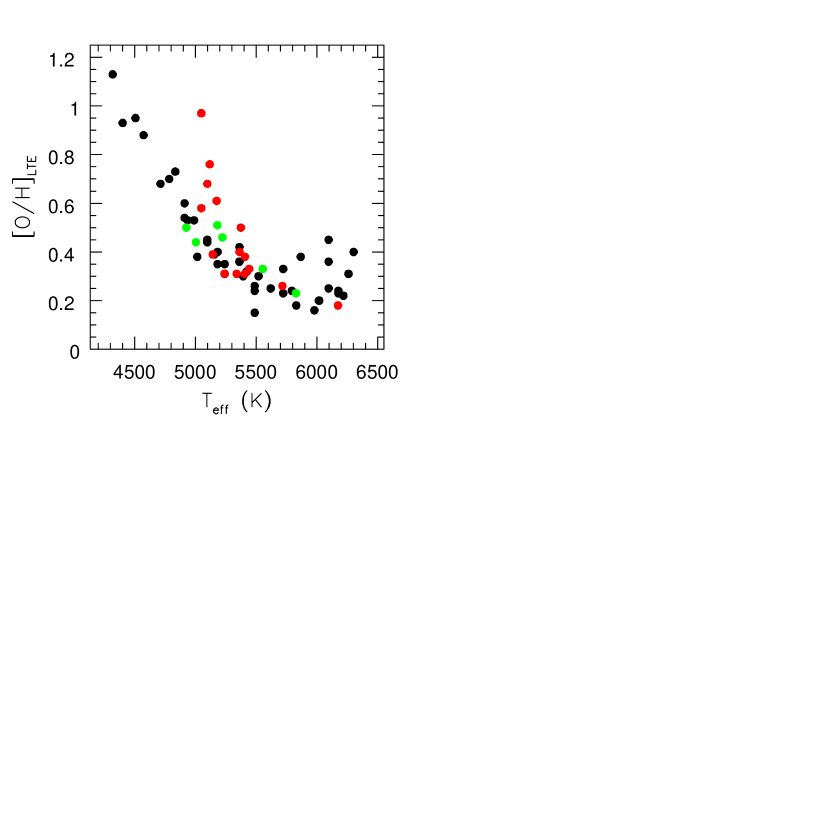
The morphology of the Hyades cool dwarf () abundances is qualitatively similar to that recently seen in Pleiades dwarfs (SKHP), but significant differences do exist. The Hyades [O/H] abundances sans duplicates and the SKHP Pleiades [O/H] abundances (derived using Kurucz models with no convective overshoot) are plotted in Figure 5. The typical uncertainty in the Pleiades abundances is dex. Although there are more Hyades stars with , no difference in the triplet abundances of the two clusters in this region is discernible. This in itself is striking given that Hyades stars are metal-rich compared to Pleiades (; Boesgaard & Friel 1990) stars, suggesting the Pleiades [O/Fe] ratio could be as much as 0.13 dex higher than the Hyades. It has been demonstrated that even a moderate, non-zero [O/Fe] ratio can have a significant effect on pre-main sequence (PMS) Li depletion predictions (Swenson et al. 1994; Piau & Turck-Chièze 2002), and because of the prominent roles the Pleiades and Hyades play in the study of Li depletion mechanisms (e.g., Ford, Jeffries, & Smalley 2002), the potentially larger [O/Fe] ratio for the Pleiades relative to the Hyades must be taken into consideration. ††margin: Fig. 5
For stars with , the [O/H] abundances of the two clusters clearly diverge, with the Hyades trend being less steep than that for the Pleiades. The Hyades [O/H] abundances were fit with a quadratic function, and the reduced between this fit and the Pleiades data was calculated. Based on this, the Pleiades abundances deviate from those of the Hyades at a confidence level of . In an attempt to explain this divergence and, as a result, shed light on the nature of the increasing triplet abundances with decreasing , one naturally turns to the two possibly relevant physical characteristics that are disparate between these two clusters: metallicity and age. A similar suggestion is offered by King & Schuler (2005) who compared their triplet results of six UMa dwarfs to the SKHP Pleiades abundances and found the UMa trend to be shallower than the Pleiades. The UMa moving group is characterized by a sub-solar Fe abundance of (Boesgaard & Friel, 1990) and an age that is approximately coeval to the Hyades (King & Schuler, 2005); UMa is an excellent sample with respect to the Hyades and Pleiades results to perform an empirical test of the sensitivity of the [O/H] trends to metallicity and age. Accordingly, the King & Schuler [O/H] UMa abundances are included in Figure 5. In order to put the UMa abundances on a scale similar to the Hyades and Pleiades, the abundances have been increased by a constant to bring the abundance of the warmest UMa star into concordance with the mean abundance for Hyads in the range of , the temperature range in which the two warmest UMa stars are located. If metallicity is a factor, then an UMa trend that is steeper than the Pleiades trend would be expected. Despite the paucity of UMa data points, this is clearly not seen. Indeed, for stars with , the UMa abundances map well with the Hyades trend. These limited data, while not conclusive, instead point to an age-related effect influencing the triplet abundance trends in cool cluster dwarfs. We now turn our attention to two age-related phenomena previously suggested to possibly affect triplet abundances: chromospheric activity and photospheric spots.
4.1 Chromospheric Activity
The effects of a global chromosphere on the formation of spectral lines are not well understood. There is some evidence that the large spread in Li abundances among Pleiades K-dwarfs is correlated with chromospheric activity indicators (King & Schuler 2004; Soderblom et al. 1993), but it is far from clear whether the correlation is causal. With respect to O, Takeda (1995) found appreciable increases in the modeled line strengths of the triplet in the solar spectrum when using Kurucz atmospheres modified to include a chromosphere. The increase is apparently due to the temperature rise at depths and to the large fraction of O atoms that remain neutral. SKHP compared the O abundances derived from the triplet for the Pleiades and M34 to and Ca II triplet chromospheric activity measures from the literature and found no correlation. A similar analysis for the Hyades sample is presented in Figure 6, where our [O/H] abundances are plotted against Ca II H+K activity indicators (Paulson et al., 2002) and against differences in observed and -dependent mean values (). No statistically significant correlation exists for either comparison. Thus, the combined Hyades and Pleiades results suggest a global chromosphere does not contribute to triplet trends among cool cluster dwarfs. ††margin: Fig. 6
More recently, Morel & Micela (2004) analyzed the triplet and [O I] forbidden line in spectra of 14 single-lined, chromospherically active RS CVn binaries, and in Pleiades, Hyades, and field dwarf, as well as in field giant, data from the literature. They report increasingly discrepant results between the two indicators with higher chromospheric activity levels, with the discrepancy primarily due to increasing triplet abundances (see Figure 1 therein). In general, the inconsonant results are restricted to the RS CVn binaries and the Pleiades dwarfs- the other stellar subsets generally have lower levels of chromospheric activity and do not evince a triplet-activity correlation. With regards to the Pleiades dwarfs (the [O/H] and color-based data for which are taken from SKHP), a correlation between triplet [O/Fe] abundances and X-ray-based activity indicators (- ratio of X-ray and bolometric luminosities) at a confidence level of is reported. This should be viewed with caution due to the correlation (at the confidence level according to the linear correlation coefficient; data taken from Table 2 of Morel & Micela 2004) between the Pleiades and , and to the fact that the [O/Fe] abundances are highly correlated with (). The degeneracy of these correlations prevents firm conclusions from being made, and it is possible that the [O/Fe]- activity relation might be due to other -related effects. Indeed, Morel & Micela state the Pleiades [O/H]-relation found by SKHP may be masking an activity effect given the tight correlation between - as reported by Micela et al. (1999); however, the converse argument is equally valid, i.e., the [O/Fe]-activity relation is masking a effect. Because no correlation between Pleiades triplet [O/H] abundances and and Ca II chromospheric activity indicators exists, we find the data supporting a triplet-activity relation for the Pleiades unconvincing.
For the RS CVn binaries, the interpretation of the Morel & Micela results and their relevance to the current study are not clear. The triplet [O/Fe] abundances of the Rs CVn stellar subset show a statistically significant correlation at the confidence level with Ca II H+K activity indicators, but a correlation with indicators is totally absent. On the other hand, both activity indicators are not correlated with , but the [O/Fe] abundances are correlated with at a confidence level. These relations do not provide a definitive picture of the connection between activity and the triplet O abundances for these stars, especially when the nature and inhomogeneity of the sample are considered. RS CVn systems have enhanced chromospheric and photospheric (spots) activity, presumably due to effects resulting from interactions between the binary components. The primary components are generally evolved stars, and the Morel & Micela sample is composed mostly of sub-giants, according to the derived surface gravities (Morel et al. 2003; Morel et al. 2004). Thus, comparing the RS CVn triplet results to those of the Hyades and Pleiades dwarfs may be unwarranted.
4.2 Photospheric Spots
The effect of photospheric spots on abundance derivations has received a healthy amount of attention in the literature, especially with respect to Li abundances as measured from the resonance feature (e.g., Xiong & Deng 2005; Ford et al. 2002). Unfortunately, such analyses are limited to speculation because spots and their areal coverage of stellar surfaces are not well understood. The advent of doppler imaging has permitted the mapping of stellar surfaces and confirmed the presence of spots on target stars, but the technique is limited to stars with high rotational velocities (; Vogt & Penrod 1983). In order to reduce the rotationally-induced broadening of spectral features, stars that are typically included in abundance analyses are slow rotators and thus are not suitable for doppler imaging studies.
Nonetheless, we have undertaken a plausibility study to investigate whether the presence of spots could produce the anomalous triplet O abundances observed among our cool Hyades dwarf sample. We have utilized “toy” model atmospheres that include flux contributions to the triplet region from both cool and hot spots, as well as from the quiescent star. Our modeling scheme is a gross oversimplification of a complex interplay of atmospheric physics (i.e., magnetic fields, etc.) and temperature inhomogeneities, but it is useful as a first approximation of spot effects. The first criterion to which our multi-component toy models adhere is the conservation of total luminosity, similar to that described by Ford et al. (2002), by using a weighted Stefan-Boltzmann relation:
where is the adopted effective temperature for the star (Table 1), , , and are the areal coverages of the cool spots, hot spots, and quiescent star, respectively, and , , and are the corresponding temperatures. The sum of the areal coverages are constrained such that
Areal coverages of and initial spot temperatures were chosen arbitrarily, and the Stefan-Boltzmann relation was then solved for . Three model atmospheres characterized by either , , or were constructed; surface gravities and microturbulent velocities remain unchanged for the three models for each star and are as they appear in Table 1. With an input O abundance equal to the mean abundance of Hyads in the range of (), cool, hot, and star component spectra were synthesized using MOOG. Before combining the spectra into a composite spectrum, the contribution of flux at 7774 Å- approximately at the center of the O I triplet- from the three temperature components was determined by solving the Planck function for each. The resulting values were then normalized to create a “Planck factor”. Each component spectrum was multiplied by its areal coverage and Planck factor, and finally the components were added to achieve a composite spectrum. The cool and hot temperatures were altered and the procedure iterated until the measured EWs of the composite spectrum were approximately equal (typically to within the measured EW uncertainties) to the observed EWs.
A sample of the component and composite spectra of HIP 18322 is presented in Figure 7, and the results of this exercise for three Hyads are given in Table 7. Assuming reasonable spot coverages and temperatures given in Table 7, the toy model employed here is able to satisfactorily reproduce the observed line strengths for all three stars. It is evident from Figure 7 that if spots affect observed triplet line strengths, the dominant contribution comes from hot spots, i.e., faculae and/or plages; the cool spot regions have little or no effect. This provides significant freedom in choosing the spot coverages and temperatures for the present case, and it excludes uniqueness for our models. A more sophisticated approach to this problem could include other spectral features, including molecular lines, with differing sensitivities in order to constrain the areal coverages and temperatures of the models, assuming there are other features that show relations similar to the triplet. There are existing data suggesting this to be the case (e.g., SKHP). While this exercise is in no way conclusive, we have been able to demonstrate that photospheric temperature inhomogeneities can possibly account for the high triplet abundances of the cool Hyades dwarfs presented here and thus possibly produce the triplet abundance trends observed in cool open cluster dwarfs. ††margin: Fig. 7 ††margin: Tab. 6
5 SUMMARY AND CLOSING REMARKS
Oxygen abundances have been derived under the assumption of LTE from the high-excitation O I triplet in high-resolution spectra for 45 Hyades dwarfs in the effective temperature range of . The warmest stars in the sample () show evidence of increasing triplet abundances with increasing , as predicted by current NLTE calculations. A striking increase of triplet abundances with decreasing is observed for stars with , contrary to expectations and to NLTE predictions. Triplet abundances have been rederived using two additional temperature scales, and the morphology of the cool dwarf abundance trend is unaltered, suggesting the trend is not due to erroneous . Comparing the Hyades trend to that previously observed among Pleiades dwarfs (SKHP) reveals both similarities and differences. At greater than , no difference in the abundances at a given for the two clusters is discernible, raising the possibility of a larger [O/Fe] ratio for the Pleiades relative to the Hyades. For stars with less than , the two trends diverge with the Hyades trend being less steep than that for the Pleiades. Another difference is the star-to-star abundance scatter seen for Pleiads with is not seen among the Hyads.
Recently derived triplet abundances for six dwarfs that are members of the Ursa Major moving group are compared to the Hyades and Pleiades results. UMa members have a sub-solar metallicity (; Boesgaard & Friel 1990), and an age that is approximately coeval with that of the Hyades (King & Schuler, 2005). Despite the small number of UMa stars, their abundances closely follow the Hyades results, suggesting an age-related effect, as opposed to metallicity, is a material factor in triplet O abundance trends in cool cluster dwarfs. No correlation is found between Ca II H+K activity chromospheric activity indicators and Hyades [O/H] abundances. SKHP report a similar lack of correlation between and Ca II triplet chromospheric activity indicators and Pleiades triplet O abundances. Thus, we are unable to find evidence for an activity-triplet relation as suggested by the theoretical results of Takeda (1995). On the other hand, we demonstrate to first order that photospheric temperature inhomogeneities possibly due to spots, faculae, and/or plages can plausibly produce anomalously high triplet abundances. A simple toy model consisting of arbitrarily chosen line flux contributions from cool and hot spots is able to reproduce observed equivalent widths for three Hyads with differing and triplet abundances. The results do not conclusively point to spots as the source of the triplet trends in cool cluster dwarfs, but they are provocative and require further investigation.
There is concordance among the triplet O abundances for stars in the intermediate range of 5450-6100 K. Over this range, the NLTE corrections of Takeda (2003) differ by dex, and thus the abundances given relative to solar values are essentially free of NLTE-related anomalies. The mean abundance for this group of 15 stars (excluding HIP 15310 which has questionable cluster membership) is , where the quoted error is the uncertainty in the mean. This value is in good agreement with that found by King (1993), who derived an LTE abundance using the triplet of 777The quoted abundance from King 1993 is that using an updated measurement of the EW for one of his program stars, as described by King & Hiltgen 1996. García López et al. (1993) performed an NLTE analysis of the triplet in 25 Hyades F dwarfs and reported a mean O abundance of . This value is appreciably lower than that of the present study and of King (1993). The difference in the García López et al. and the King 1993 results is discussed thoroughly in King & Hiltgen (1996), who come to the conclusion that the bulk of the difference is most likely due to the NLTE corrections adopted by García López et al. and to different solar EWs adopted by the two studies. Finally, King & Hiltgen (1996) derived a Hyades O abundance from two dwarfs using spectral synthesis of the [O I] feature and find a mean abundance of . Comparing this result with that of the triplet in the intermediate group of stars here reveals a dex difference, possibly indicating the presence of underestimated internal errors or unaccounted for systematic errors in one or both studies. For instance, if the luminosity-based scale from the Hyades isochrone of Pinsonneault et al. (2004) is used to derive the triplet abundances of the intermediate group of stars, the mean abundance reduces to . If we take the [O I]-based and triplet-based O abundances as lower and upper limits, respectively, it appears the Hyades O abundance falls in the range of .
References
- Allende Prieto et al. (2004) Allende Prieto, C., Barklem, P. S., Lambert, D. L., & Cunha, K. 2004, A&A, 420, 183
- Allende Prieto & Lambert (1999) Allende Prieto, C., & Lambert, D. L. 1999, A&A, 352, 555
- Alonso et al. (1996) Alonso, A., Arribas, S., & Martinez-Roger, C. 1996, A&AS, 117, 227
- Alonso et al. (1999) Alonso, A., Arribas, S., & Martínez-Roger, C. 1999, A&AS, 140, 261
- Blackwell et al. (1990) Blackwell, D. E., Petford, A. D., Arribas, S., Haddock, D. J., & Selby, M. J. 1990, A&A, 232, 396
- Boesgaard & Friel (1990) Boesgaard, A. M., & Friel, E. D. 1990, ApJ, 351, 467
- Carney (1983) Carney, B.W. 1983, AJ, 88, 623
- Cayrel et al. (1985) Cayrel, R., Cayrel de Strobel, G., & Campbell, B. 1985, A&A, 146, 249
- Fischer & Valenti (2005) Fischer, D. A., & Valenti, J. 2005, ApJ, 622, 1102
- Fitzpatrick & Sneden (1987) Fitzpatrick, M. J., & Sneden, C. 1987, BAAS, 19, 1129
- Ford et al. (2002) Ford, A., Jeffries, R. D., & Smalley, B. 2002, A&A, 391, 253
- Fulbright & Johnson (2003) Fulbright, J. P., & Johnson, J. A. 2003, ApJ, 595, 1154
- García López et al. (1993) García López, R. J., Rebolo, R., Herrero, A., & Beckman, J. E. 1993, ApJ, 412, 173
- Gonzalez (1997) Gonzalez, G. 1997, MNRAS, 285, 403
- Israelian et al. (1998) Israelian, G., García López, R. J., & Rebolo, R. 1998, ApJ, 507, 805
- Johansson et al. (2003) Johansson, S., Litzén, U., Lundberg, H., & Zhang, Z. 2003, ApJ, 584, L107
- King (1993) King, J.R. 1993, Ph.D. dissertation, University of Hawaii
- King & Boesgaard (1995) King, J. R., & Boesgaard, A. M. 1995, AJ, 109, 383
- King & Hiltgen (1996) King, J. R., & Hiltgen, D. D. 1996, AJ, 112, 2650
- King & Schuler (2004) King, J. R., & Schuler, S. C. 2004, AJ, 128, 2898
- King & Schuler (2005) King, J. R., & Schuler, S. C. 2005, PASP, submitted
- King et al. (2000) King, J. R., Soderblom, D. R., Fischer, D., & Jones, B. F. 2000, ApJ, 533, 944
- Kiselman (1991) Kiselman, D. 1991, A&A, 245, L9
- Kiselman (2001) Kiselman, D. 2001, New Astronomy Review, 45, 559
- Lodders (2003) Lodders, K. 2003, ApJ, 591, 1220
- Micela et al. (1999) Micela, G., et al. 1999, A&A, 341, 751
- Mishenina et al. (2000) Mishenina, T. V., Korotin, S. A., Klochkova, V. G., & Panchuk, V. E. 2000, A&A, 353, 978
- Morel & Micela (2004) Morel, T., & Micela, G. 2004, A&A, 423, 677
- Morel et al. (2003) Morel, T., Micela, G., Favata, F., Katz, D., & Pillitteri, I. 2003, A&A, 412, 495
- Morel et al. (2004) Morel, T., Micela, G., Favata, F., & Katz, D. 2004, A&A, 426, 1007
- Nissen et al. (2002) Nissen, P. E., Primas, F., Asplund, M., & Lambert, D. L. 2002, A&A, 390, 235
- Paulson et al. (2003) Paulson, D.B., Sneden, C., & Cochran, W.D. 2003, AJ, 125, 318
- Paulson et al. (2002) Paulson, D. B., Saar, S. H., Cochran, W. D., & Hatzes, A. P. 2002, AJ, 124, 572
- Perryman et al. (1998) Perryman, M. A. C., et al. 1998, A&A, 331, 81
- Piau & Turck-Chièze (2002) Piau, L., & Turck-Chièze, S. 2002, ApJ, 566, 419
- Pinsonneault et al. (2004) Pinsonneault, M. H., Terndrup, D. M., Hanson, R. B., & Stauffer, J. R. 2004, ApJ, 600, 946
- Ramírez & Meléndez (2005) Ramírez, I., & Meléndez, J. 2005, ApJ, 626, 465
- Schuler et al. (2004) Schuler, S. C., King, J. R., Hobbs, L. M., & Pinsonneault, M. H. 2004, ApJ, 602, L117 (SKHP)
- Soderblom et al. (1993) Soderblom, D. R., Jones, B. F., Balachandran, S., Stauffer, J. R., Duncan, D. K., Fedele, S. B., & Hudon, J. D. 1993, AJ, 106, 1059
- Stauffer et al. (2003) Stauffer, J. R., Jones, B. F., Backman, D., Hartmann, L. W., Barrado y Navascués, D., Pinsonneault, M. H., Terndrup, D. M., & Muench, A. A. 2003, AJ, 126, 833
- Swenson et al. (1994) Swenson, F. J., Faulkner, J., Iglesias, C. A., Rogers, F. J., & Alexander, D. R. 1994, ApJ, 422, L79
- Takeda (1995) Takeda, Y. 1995, PASJ, 47, 463
- Takeda et al. (1998) Takeda, Y., Kawanomoto, S., & Sadakane, K. 1998, PASJ, 50, 97
- Takeda (2003) Takeda, Y. 2003, A&A, 402, 343
- Thorburn et al. (1993) Thorburn, J. A., Hobbs, L. M., Deliyannis, C. P., & Pinsonneault, M. H. 1993, ApJ, 415, 150
- Torres, Stefanik, & Latham (1997) Torres, G., Stefanik, R. P., & Latham, D. W. 1997, ApJ, 474, 256
- Vogt & Penrod (1983) Vogt, S. S., & Penrod, G. D. 1983, PASP, 95, 565
- Xiong & Deng (2005) Xiong, D.-R., & Deng, L. 2005, ApJ, 622, 620
- Yi et al. (2003) Yi, Sukyoung, Kim, Yong-Cheol, & Demarque, P. 2003, ApJS, 144, 259
- Yong et al. (2004) Yong, D., Lambert, D. L., Allende Prieto, C., & Paulson, D. B. 2004, ApJ, 603, 697


| () | |||||||||||
|---|---|---|---|---|---|---|---|---|---|---|---|
| HIP | HD | (Mag) | CommentaaProvides the source of the values: A- Allende Prieto & Lambert 1999; P- Paulson et al. 2003; Y- Yong et al. 2004 | (K) | (cgs) | (km ) | TelescopebbDenotes with which telescope the object was observed, as described in §2: KPNO-02- KPNO 4-m 2002; KPNO-04- KPNO 4-m 2004; McD-95- McDonald Observatory 2.7-m 1995; McD-04- McDonald Observatory 2.7-m 2004 | ||||
| 13806 | 0.86 | P | 5097 | 4.60 | 1.10 | KPNO-02 | |||||
| 13976 | 18632 | 0.93 | P | 4910 | 4.63 | 1.04 | KPNO-02 | ||||
| 14976 | 19902 | 0.73 | A | 5487 | 4.54 | 1.24 | KPNO-02,McD-04 | ||||
| 15310 | 20439 | 0.62 | A | 5866 | 4.47 | 1.40 | KPNO-04 | ||||
| 16529 | 0.84 | A | 5154 | 4.59 | 1.12 | KPNO-02 | |||||
| 16908 | 0.92 | Y | 4936 | 4.63 | 1.05 | KPNO-04,McD-04 | |||||
| 18322 | 286363 | 1.07 | Y | 4573 | 4.68 | 0.94 | KPNO-02 | ||||
| 18327 | 285252 | 0.90 | P | 4988 | 4.62 | 1.07 | KPNO-02 | ||||
| 18946 | 265348 | 1.10 | Y | 4507 | 4.69 | 0.92 | KPNO-04 | ||||
| 19098 | 285367 | 0.89 | A | 5015 | 4.61 | 1.08 | KPNO-02 | ||||
| 19148 | 25825 | 0.59 | A | 5978 | 4.44 | 1.45 | KPNO-02,KPNO-04 | ||||
| 19263 | 285482 | 1.01 | Y | 4712 | 4.66 | 0.98 | KPNO-04 | ||||
| 19441 | 1.19 | Y | 4319 | 4.72 | 0.87 | KPNO-04 | |||||
| 19781 | 26756 | 0.69 | A | 5619 | 4.51 | 1.30 | KPNO-02 | ||||
| 19786 | 26767 | 0.64 | A | 5793 | 4.48 | 1.37 | KPNO-02 | ||||
| 19793 | 26736 | 0.66 | A | 5722 | 4.49 | 1.34 | KPNO-02,McD-04 | ||||
| 19796 | 26784 | 0.51 | A | 6301 | 4.37 | 1.61 | KPNO-02,McD-04 | ||||
| 19934 | 284253 | 0.81 | A | 5240 | 4.58 | 1.15 | KPNO-02 | ||||
| 20082 | 285690 | 0.98 | P | 4784 | 4.65 | 1.00 | KPNO-04 | ||||
| 20130 | 27250 | 0.75 | A | 5423 | 4.55 | 1.22 | KPNO-02 | ||||
| 20146 | 27282 | 0.72 | A | 5519 | 4.53 | 1.26 | KPNO-02,McD-95 | ||||
| 20237 | 27406 | 0.56 | A | 6095 | 4.42 | 1.51 | KPNO-02 | ||||
| 20480 | 27732 | 0.76 | A | 5392 | 4.55 | 1.21 | KPNO-02 | ||||
| 20492 | 27771 | 0.86 | A | 5097 | 4.60 | 1.10 | KPNO-02 | ||||
| 20557 | 27808 | 0.52 | A | 6259 | 4.38 | 1.59 | KPNO-02 | ||||
| 20712 | 28033 | 0.56 | A | 6095 | 4.42 | 1.51 | KPNO-04,McD-04 | ||||
| 20741 | 28099 | 0.66 | A | 5722 | 4.49 | 1.34 | KPNO-02 | ||||
| 20762 | 32347 | 1.15 | Y | 4401 | 4.70 | 0.89 | KPNO-04 | ||||
| 20815 | 28205 | 0.54 | A | 6176 | 4.40 | 1.55 | KPNO-02 | ||||
| 20826 | 28237 | 0.56 | A | 6095 | 4.42 | 1.51 | KPNO-02 | ||||
| 20827 | 285830 | 0.93 | P | 4910 | 4.63 | 1.04 | KPNO-02 | ||||
| 20949 | 283704 | 0.77 | A | 5361 | 4.56 | 1.20 | KPNO-02 | ||||
| 20951 | 285773 | 0.83 | P | 5182 | 4.59 | 1.13 | KPNO-02 | ||||
| 21099 | 28593 | 0.73 | A | 5487 | 4.54 | 1.24 | KPNO-02,McD-04 | ||||
| 21112 | 28635 | 0.54 | A | 6176 | 4.40 | 1.55 | KPNO-02,KPNO-04 | ||||
| 21317 | 28992 | 0.63 | A | 5829 | 4.47 | 1.39 | KPNO-02 | ||||
| 21637 | 29419 | 0.58 | A | 6017 | 4.43 | 1.47 | KPNO-02 | ||||
| 21741 | 284574 | 0.81 | A | 5240 | 4.58 | 1.15 | KPNO-02 | ||||
| 22380 | 30505 | 0.83 | A | 5182 | 4.59 | 1.13 | KPNO-02 | ||||
| 22422 | 30589 | 0.58 | A | 6017 | 4.43 | 1.47 | KPNO-02 | ||||
| 22566 | 30809 | 0.53 | A | 6217 | 4.39 | 1.57 | KPNO-02 | ||||
| 23312 | 0.96 | P | 4834 | 4.64 | 1.02 | KPNO-02 | |||||
| 23498 | 0.77 | A | 5361 | 4.56 | 1.20 | KPNO-04 | |||||
| 23750 | 240648 | 0.73 | A | 5487 | 4.54 | 1.24 | KPNO-02 | ||||
| 24923 | 242780 | 0.77 | A | 5361 | 4.56 | 1.20 | KPNO-02 | ||||
| Sun | 5777 | 4.44 | 1.38 | KPNO-02,KPNO-04,McD-04 |
| Blue Order | Red Order | Mean | ||||||||||||
|---|---|---|---|---|---|---|---|---|---|---|---|---|---|---|
| HIP | S/N | S/N | ||||||||||||
| (mÅ) | (mÅ) | (mÅ) | (mÅ) | (mÅ) | (mÅ) | (mÅ) | (mÅ) | (mÅ) | ||||||
| 13806 | 290 | 38.1 | 36.0 | 29.7 | 194 | 44.5 | 36.5 | 27.2 | 41.3 | 36.3 | 28.5 | |||
| 13976 | 490 | 30.7 | 30.0 | 21.9 | 320 | 34.4 | 25.9 | 21.6 | 32.6 | 28.0 | 21.8 | |||
| 14976 | 340 | 57.8 | 54.5 | 42.6 | 260 | 65.2 | 51.2 | 39.5 | 61.5 | 52.9 | 41.1 | |||
| 16529 | 265 | 41.4 | 40.1 | 28.8 | 200 | 45.8 | 34.4 | 26.7 | 43.6 | 37.3 | 27.8 | |||
| 18322 | 245 | 18.8 | 16.2 | 170 | 18.4 | 15.5 | 18.6 | 15.9 | ||||||
| 18327 | 295 | 36.4 | 33.2 | 27.5 | 200 | 36.2 | 33.8 | 24.2 | 36.3 | 33.5 | 25.9 | |||
| 19098 | 208 | 32.6 | 28.0 | 21.5 | 195 | 34.7 | 29.0 | 21.3 | 33.7 | 28.5 | 21.4 | |||
| 19148 | 465 | 91.0 | 80.7 | 65.7 | 310 | 93.0 | 82.6 | 72.7 | 92.0 | 81.7 | 69.2 | |||
| 19781 | 300 | 65.7 | 64.9 | 51.5 | 218 | 71.8 | 57.3 | 54.7 | 68.8 | 61.1 | 53.1 | |||
| 19786 | 455 | 82.7 | 76.3 | 63.7 | 300 | 85.4 | 74.8 | 60.2 | 84.1 | 75.6 | 62.0 | |||
| 19793 | 405 | 82.0 | 80.6 | 63.2 | 295 | 87.3 | 70.1 | 64.2 | 84.7 | 75.4 | 63.7 | |||
| 19796 | 460 | 139.0 | 130.1 | 110.4 | 284 | 135.7 | 110.0 | 110.0 | 137.4 | 120.1 | 110.2 | |||
| 19934 | 293 | 44.4 | 39.6 | 32.6 | 190 | 46.5 | 40.9 | 28.5 | 45.5 | 40.3 | 30.6 | |||
| 20130 | 286 | 56.5 | 53.6 | 39.9 | 208 | 61.6 | 49.5 | 44.0 | 59.1 | 51.6 | 42.0 | |||
| 20146 | 289 | 61.8 | 61.5 | 46.5 | 194 | 71.1 | 57.5 | 45.6 | 66.5 | 59.5 | 46.1 | |||
| 20237 | 390 | 115.8 | 111.1 | 86.8 | 300 | 116.8 | 104.4 | 87.9 | 116.3 | 107.8 | 87.4 | |||
| 20480 | 275 | 50.7 | 49.4 | 38.7 | 186 | 58.6 | 49.6 | 40.4 | 54.7 | 49.5 | 39.6 | |||
| 20492 | 320 | 37.7 | 37.5 | 27.7 | 205 | 44.6 | 36.5 | 25.8 | 41.2 | 37.0 | 26.8 | |||
| 20557 | 355 | 129.0 | 118.6 | 96.8 | 298 | 125.4 | 106.3 | 98.5 | 127.2 | 112.4 | 97.7 | |||
| 20741 | 340 | 76.2 | 74.0 | 56.5 | 240 | 84.1 | 62.8 | 57.4 | 80.2 | 68.4 | 57.0 | |||
| 20815 | 387 | 114.8 | 106.6 | 88.5 | 260 | 112.4 | 97.4 | 79.8 | 113.6 | 102.0 | 84.2 | |||
| 20826 | 390 | 107.0 | 98.3 | 80.2 | 270 | 113.5 | 91.6 | 80.2 | 110.2 | 95.0 | 80.2 | |||
| 20827 | 285 | 30.5 | 32.9 | 24.7 | 190 | 35.4 | 30.9 | 23.0 | 33.0 | 31.9 | 23.9 | |||
| 20949 | 238 | 55.4 | 56.9 | 40.0 | 180 | 57.1 | 53.3 | 47.0 | 56.3 | 55.1 | 43.5 | |||
| 20951 | 320 | 41.6 | 43.6 | 29.6 | 200 | 44.4 | 39.5 | 31.5 | 43.0 | 41.6 | 30.6 | |||
| 21099 | 325 | 53.7 | 47.1 | 39.9 | 220 | 55.5 | 52.4 | 35.7 | 54.6 | 49.8 | 37.8 | |||
| 21112 | 347 | 112.7 | 105.5 | 84.0 | 255 | 117.1 | 97.8 | 85.9 | 114.9 | 101.7 | 85.0 | |||
| 21317 | 230 | 84.9 | 76.5 | 60.6 | 180 | 87.6 | 70.1 | 54.1 | 86.3 | 73.3 | 57.4 | |||
| 21637 | 380 | 96.5 | 90.1 | 73.1 | 250 | 98.6 | 87.8 | 73.8 | 97.6 | 89.0 | 73.5 | |||
| 21741 | 343 | 46.5 | 44.1 | 33.1 | 196 | 47.2 | 42.4 | 28.5 | 46.9 | 43.3 | 30.8 | |||
| 22380 | 280 | 40.9 | 39.1 | 28.5 | 189 | 48.5 | 35.6 | 26.8 | 44.7 | 37.4 | 27.7 | |||
| 22422 | 349 | 98.7 | 89.6 | 71.4 | 256 | 100.7 | 87.8 | 74.9 | 99.7 | 88.7 | 73.2 | |||
| 22566 | 297 | 116.5 | 108.2 | 84.4 | 265 | 122.7 | 101.3 | 81.8 | 119.6 | 104.8 | 83.1 | |||
| 23312 | 256 | 30.1 | 30.9 | 24.5 | 162 | 39.6 | 29.2 | 24.4 | 34.9 | 30.1 | 24.5 | |||
| 23750 | 261 | 58.0 | 59.1 | 45.6 | 176 | 61.4 | 52.8 | 40.5 | 59.7 | 56.0 | 43.1 | |||
| 24923 | 274 | 56.7 | 48.6 | 38.1 | 163 | 63.6 | 48.5 | 37.0 | 60.2 | 48.6 | 37.6 | |||
| Sun | 342 | 64.3 | 61.0 | 50.3 | 219 | 68.8 | 58.7 | 47.5 | 66.6 | 59.9 | 48.9 | |||
| HIP | S/N | ||||
|---|---|---|---|---|---|
| (mÅ) | (mÅ) | (mÅ) | |||
| KPNO-04 | |||||
| 15310 | 142 | 103.4 | 82.5 | 69.9 | |
| 16908 | 210 | 31.8 | 28.2 | ||
| 18946 | 206 | 18.2 | 11.9 | ||
| 19148 | 125 | 100.0 | 83.4 | 65.1 | |
| 19263 | 188 | 14.9 | |||
| 19441 | 212 | 11.0 | 13.2 | ||
| 20082 | 221 | 25.8 | 18.0 | ||
| 20712 | 123 | 130.4 | 108.0 | 87.4 | |
| 20762 | 220 | 12.8 | 6.9 | ||
| 21112 | 139 | 114.1 | 97.9 | 81.7 | |
| 23498 | 85 | 56.9 | 34.7 | ||
| Sun | 272 | 65.6 | 58.0 | 44.4 | |
| McDonald | |||||
| 14976 | 237 | 67.0 | 55.2 | 44.1 | |
| 16908 | 131 | 29.8 | 28.7 | 17.6 | |
| 19793 | 184 | 88.7 | 76.2 | 61.4 | |
| 19796 | 208 | 133.0 | 121.5 | 100.7 | |
| 20712 | 131 | 125.9 | 109.5 | 87.2 | |
| 21099 | 190 | 60.3 | 53.4 | 42.6 | |
| 20146aaObserved with the McDonald Observatory 2.7-m telescope in 1995 | 234 | 67.2 | 58.1 | 45.6 | |
| Sun | 825 | 72.8 | 60.2 | 48.2 | |
| HIP | [O/H] | ||
|---|---|---|---|
| KPNO-02aaKPNO-02 abundances are those derived using the mean EWs. | |||
| 13806 | 0.45 | ||
| 13976 | 0.54 | ||
| 14976 | 0.24 | ||
| 16529 | 0.39 | ||
| 18322 | 0.88 | ||
| 18327 | 0.53 | ||
| 19098 | 0.38 | ||
| 19148 | 0.16 | ||
| 19781 | 0.25 | ||
| 19786 | 0.24 | ||
| 19793 | 0.33 | ||
| 19796 | 0.40 | ||
| 19934 | 0.31 | ||
| 20130 | 0.32 | ||
| 20146 | 0.30 | ||
| 20237 | 0.36 | ||
| 20480 | 0.30 | ||
| 20492 | 0.44 | ||
| 20557 | 0.31 | ||
| 20741 | 0.23 | ||
| 20815 | 0.23 | ||
| 20826 | 0.25 | ||
| 20827 | 0.60 | ||
| 20949 | 0.42 | ||
| 20951 | 0.40 | ||
| 21099 | 0.15 | ||
| 21112 | 0.24 | ||
| 21317 | 0.18 | ||
| 21637 | 0.20 | ||
| 21741 | 0.35 | ||
| 22380 | 0.35 | ||
| 22422 | 0.20 | ||
| 22566 | 0.22 | ||
| 23312 | 0.73 | ||
| 23750 | 0.26 | ||
| 24923 | 0.36 | ||
| KPNO-04 | |||
| 15310 | 0.38 | ||
| 16908 | 0.53 | ||
| 18946 | 0.95 | ||
| 19148 | 0.22 | ||
| 19263 | 0.68 | ||
| 19441 | 1.13 | ||
| 20082 | 0.70 | ||
| 20712 | 0.45 | ||
| 20762 | 0.93 | ||
| 21112 | 0.25 | ||
| 23498 | 0.36 | ||
| McDonald | |||
| 14976 | 0.27 | ||
| 16908 | 0.40 | ||
| 19793 | 0.31 | ||
| 19796 | 0.32 | ||
| 20712 | 0.37 | ||
| 21099 | 0.22 | ||
| 20146 | 0.26 | ||
| Abundance Sensitivity | ||||||
|---|---|---|---|---|---|---|
| HIP | Parameter | 7772 | 7774 | 7775 | ||
| 21112 () | ||||||
| 19786 () | ||||||
| 20082 () | ||||||
| KPNO-02 | KPNO-04 | McD-04 | |||||||
|---|---|---|---|---|---|---|---|---|---|
| HIP | [O/H] | [O/H] | [O/H] | ||||||
| 14976 | 0.24 | 0.27 | |||||||
| 16908 | 0.53 | 0.40 | |||||||
| 19148 | 0.16 | 0.22 | |||||||
| 19793 | 0.33 | 0.31 | |||||||
| 19796 | 0.40 | 0.32 | |||||||
| 20146 | 0.30 | 0.26 | |||||||
| 20712 | 0.45 | 0.37 | |||||||
| 21099 | 0.15 | 0.22 | |||||||
| 21112 | 0.24 | 0.25 | |||||||
| Observed | Composite | |||||||||||||
|---|---|---|---|---|---|---|---|---|---|---|---|---|---|---|
| HIP | (K) | (K) | (K) | (K) | (mÅ) | (mÅ) | (mÅ) | (mÅ) | (mÅ) | (mÅ) | ||||
| 18327 | 4988 | 4200 | 5900 | 4785 | 36.3 | 33.5 | 25.9 | 39.9 | 32.3 | 27.1 | ||||
| 20082 | 4784 | 4000 | 5700 | 4569 | 25.8 | 18.0 | 25.1 | 21.4 | ||||||
| 18322 | 4573 | 3800 | 5500 | 4339 | 18.6 | 15.9 | 19.6 | 17.3 | ||||||