Presenter: R. D. McKeown (bmck@krl.caltech.edu), usa-mckeown-R-abs2-he13-oral
Search for Correlated High Energy Cosmic Ray Events with CHICOS
Abstract
We present the results of a search for time correlations in high energy cosmic ray data (primary eV) collected by the California HIgh school Cosmic ray ObServatory (CHICOS) array. Data from 69 detector sites spread over an area of 400 km2 were studied for evidence of isolated events separated by more than 1 km with coincidence times ranging from 1 microseconds up to 1 second. We report upper limits for the coincidence probability as a function of coincidence time.
1 Introduction
Correlations between spatially separated cosmic ray events would indicate that the particles have some common history. Extensive air showers are well-known to produce correlated signals on the earth’s surface over distances of several kilometers. However, it is possible that isolated primary cosmic ray events separated by km could arrive in time coincidence. Such correlated cosmic ray events could result, for example, from the photodisintegration of heavy nuclei (i.e., iron) by solar photons [1]. In a previous study [2], there was some episodic evidence for time correlations up to s in events separated by km. More recently, LAAS [3] searched for correlated events at large distances km and found a few candidate events. However, these events were consistent with interpretation as accidental coincidences between uncorrelated events. We have studied data obtained with the CHICOS array during January 2003 through June 2005 and searched for evidence of correlated air shower events separated by km with energy threshold eV.
2 CHICOS
The California HIgh school Cosmic ray ObServatory (CHICOS) observes cosmic ray induced air showers with an array of detector sites located on school roofs in the Los Angeles area (Lat. , Long. , average 250 m above sea level). The sites are separated by distances of typically kilometers, with the overall array covering an area of km2. During this study, the number of operational sites increased from 31 to 66. Each detector site contains two plastic scintillator detectors, separated by meters. The detector typically has m2 area and cm thickness. Data are stored on local hard disk and automatically transferred to Caltech via internet every night by the computer located at each site.
“Trigger” events are defined as those where both detectors at a site record signals greater than 2 single vertical particles within a 100 ns time window. Most trigger events are isolated single events (i.e., no nearby sites are hit ) which are generated by low energy showers with a threshold of about eV. The rate of these triggers ( about 1000 per day per site) is comparable to expectations based on the previously measured flux [4] and computer simulations of air showers with the AIRES code [5].
Large showers that generate a trigger at one site with coincident single hits at several neighboring sites must have extremely high energies of eV. We do observe such large air shower events with the CHICOS array, presently at a rate of about one per month. However, even the largest air showers with primary energy eV would not generate 2 triggers in sites separated by more than 1 km. In this work we search for double trigger events where two sites, separated by more than 1 km, both record trigger events within a certain coincidence time. Such a signal could indicate the existence of isolated correlated cosmic ray events separated in distance by up to 60 km (the largest distance between two CHICOS sites).
3 Correlation Analysis
The data sample for this analysis is the time-stamped sequence of trigger data from the operational sites, which forms a complete record of all the events detected by the array with sufficient energy to trigger a single site. In order to examine these data for time correlations, a randomized data set was constructed directly from the real data, as in [2], by offsetting the sequence of triggers at each site by some integer number of seconds relative to the other sites. Since a shift of several seconds is small compared to the time for drift in the average trigger rate, the randomized data should reproduce all aspects of the real data associated with accidental coincidences. Deviations of correlations observed in the real data relative to the randomized data could be indications of significant correlations (i.e., not accidental) in the data.
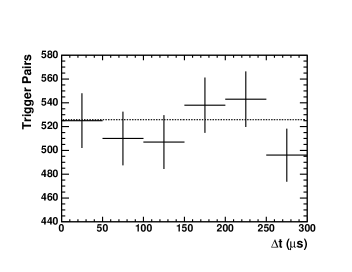
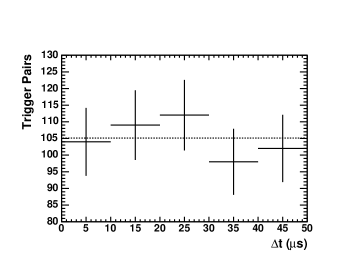
Given a coincidence time interval , we define as the number of excess event pairs (relative to the randomized data sample) with that time difference, which may be positive or negative. If both members of a successive pair are from the same site, that pair is not counted (to eliminate instrumental effects such as PMT afterpulsing).
In order to search for correlations on any time scale less than 1 second, we compute the probability of an excess coincidence per site for the cumulative time interval according to
| (1) |
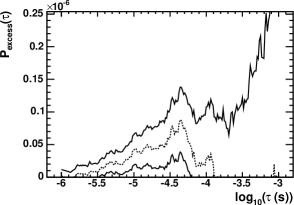
in which is the average number of operational sites and is the total number of trigger pairs. We compute a 90% confidence interval for using the method in [6], and interpret the upper limit as the 90% confidence level upper limit for the excess probability per site for the interval . The results, for 17 months of data from January 2003 through July 2004 are shown in Fig. 1 [7].
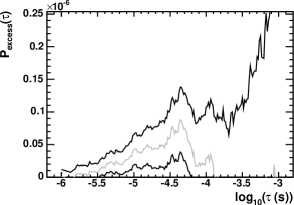
As discussed in [7], the data in Fig. 1 indicate an excess of events at time scales of order s, or s. The excess heals itself at larger as we add more data that show (apparently) no correlations. To study this possible signal further, we have repeated this analysis with an independent data set from August 2004 through May 2005. In Fig. 2 we show the results of the analysis of the new data. It is clear from the new data that there is no evidence of the apparent excess displayed in Fig. 1. Therefore, the excess in the earlier dataset is interpreted as a statistical fluctuation.
4 Conclusions
A search for time correlations in cosmic ray data collected by the CHICOS project has been performed. The results are consistent with a lack of any real correlation between isolated events. Earlier observations that indicated an excess of events at shorter times are interpreted as a statistical fluctuation. The excess coincidence probabilities displayed in Fig. 1 can be properly interpreted as 90% CL upper limits for the incidence of correlated pairs of cosmic rays above eV separated by distances between 1 and 60 km.
5 Acknowledgements
We are grateful for the generous support of Caltech and the Weingart Foundation in initiating the CHICOS project. The donation of the detectors by the CYGNUS collaboration is gratefully acknowledged. Support from the NSF (grants PHY-0244899 and PHY-0102502) and the donation of computers for the project by IBM Corporation are also acknowledged. The volunteer efforts of many high school and middle school teachers 111http://www.chicos.caltech.edu/collaboration/collaboration-list.html have been essential in the deployment and operation of the CHICOS array, and we are delighted to acknowledge their participation.
References
- [1] G. A. Medina-Tanco and A. A. Watson, Astropart. Phys. 10, (1999) 157.
- [2] O. Carrel and M. Martin, Physics Letters B325, (1994) 526.
- [3] N. Ochi, et al., J. Phys. G.: Nucl. Part. Phys. 29 (2003) 1169.
- [4] M. Nagano and A. Watson, Rev. Mod. Phys. 72, (2000) 698.
-
[5]
AIRES Webpage:
http://www.fisica.unlp.edu.ar/auger/aires/ - [6] G. Feldman and R. Cousins, Phys. Rev. D57, (1998) 3873.
- [7] B. E. Carlson, et al., Journ. Phys. G: Nucl. Part. Phys. 31, 409 (2005).