HE 13272326, an unevolved star with .
I. A Comprehensive Abundance Analysis11affiliation: Based on data collected with the Subaru Telescope, which is
operated by the National Astronomical Observatory of Japan.
Abstract
We present the elemental abundances of HE 13272326, the most iron-deficient star known, determined from a comprehensive analysis of spectra obtained with the Subaru Telescope High Dispersion Spectrograph. HE 13272326 is either in its main sequence or subgiant phase of evolution. Its NLTE corrected iron abundance is [Fe/H], 0.2 dex lower than that of HE 01075240, the previously most iron-poor object known, and more than 1 dex lower than those of all other metal-poor stars. Both HE 13272326 and HE 01075240 exhibit extremely large overabundances of carbon ([C/Fe]). The combination of extremely high carbon abundance with outstandingly low iron abundance in these objects clearly distinguishes them from other metal-poor stars. The large carbon excesses in these two stars are not the result of a selection effect.
There also exist important differences between HE 13272326 and HE 01075240. While the former shows remarkable overabundances of the light elements (N, Na, Mg and Al), the latter shows only relatively small excesses of N and Na. The neutron-capture element Sr is detected in HE 13272326, but not in HE 01075240; its Sr abundance is significantly higher than the upper limit for HE 01075240. The Li I 6707 Å line, which is detected in most metal-poor dwarfs and warm subgiants having the same temperature as HE 13272326, is not found in this object. The upper limit of its Li abundance () is clearly lower than the Spite plateau value.
These data provide new constraints on models of nucleosynthesis processes in the first generation objects that were responsible for metal enrichment at the earliest times. We discuss possible scenarios to explain the observed abundance patterns.
1 INTRODUCTION
Recent simulations to study the formation of the first generations of stars predict the formation of objects with masses from several hundred solar mass (M⊙) to as large as 1000 M⊙. These massive stars are believed to have played a crucial role in the re-ionization of the early Universe and metal enrichment (Bromm & Larson, 2004, and references therein). In particular, supermassive stars ( M⊙), which terminate their lives as pair-instability supernovae or direct formation of black holes, would be a unique type of objects formed only from primordial clouds (e.g. Heger & Woosley, 2002). In contrast, the formation of low-mass stars from metal-free clouds has been a long-standing problem. While some studies suggest that their formation might have been prohibited due to the lack of an efficient cooling source such as dust grains during the collapse of gas clouds, others predict the production of objects having masses M⊙ (Bromm & Larson, 2004, and references therein). Although the mass function of these first objects is a key to estimating their contribution to re-ionization, metal enrichment, and subsequent formation of stars and galaxies, no definitive observational constraint has yet been made.
Elemental abundance measurements for the most metal-poor stars found in our Galaxy have played a unique role in studies of the first stellar generations, because the record of their nucleosynthetic yields is believed to be preserved in the atmospheres of extremely metal-poor stars. The large objective-prism surveys for metal-poor stars that have been conducted over the past two decades, the HK survey of Beers and colleagues (Beers et al. 1985, 1992; Beers 1999), and the Hamburg/ESO survey of Christlieb and colleagues (Christlieb, 2003), have provided substantial samples of very metal-poor stars, but no object with [Fe/H] was identified until quite recently111[A/B] = , and for elements A and B.. The discovery of HE 01075240, a giant with (Christlieb et al., 2002, 2004b) was a breakthrough in the study of the first generation of stars and supernovae (SNe), and the star formation processes that were operating in the early Universe. In contrast to its low Fe abundance, HE 01075240 exhibits extreme overabundances of carbon, nitrogen, and oxygen (Christlieb et al. 2002; Bessell et al. 2004).
A number of possibilities have been proposed to account for the distinctive abundance pattern of elements in HE 01075240. Several models assume that it is a second generation object, and explain its abundance pattern by calling for pollution by either one or two supernovae (Umeda & Nomoto, 2003; Limongi et al., 2003). Shigeyama et al. (2003) investigated possible accretion of material from the interstellar matter (ISM), and suggested that this star may be a low-mass first generation object. Suda et al. (2004) investigated this possibility in more detail, combining the production of light elements (e.g. C, N) in an AGB star with mass transfer across a binary system. More detailed discussions of these models are presented in Beers & Christlieb (2005). Clearly, there is no present consensus on the origin of the abundance pattern of HE 01075240, and further observational studies are needed to place stronger constraints on the various proposed scenarios.
As has been reported by Frebel et al. (2005), spectra of the subgiant or dwarf HE 13272326 obtained with the Subaru Telescope High Dispersion Spectrograph (HDS: Noguchi et al., 2002) in May and June 2004 revealed that its Fe abundance is even lower than that of HE 01075240. Aside from its obvious importance in establishing the class of Hyper Metal-Poor (HMP: Beers & Christlieb, 2005) stars with [Fe/H] , the chemical abundance pattern of HE 13272326 provides additional important constraints on the models proposed for HE 01075240. In Frebel et al. (2005), we presented results of an abundance analysis based on the Subaru/HDS spectra. Here we describe our observations and analysis in more detail, and discuss more extensively the implications of the derived abundances, as well as possible scenarios for the origin of the abundance pattern of HE 13272326. In §2 we report details of the sample of stars from which HE 13272326 was identified, as well as the observations and measurements obtained to date. The determination of atmospheric parameters is described in §3. In §4 we present the abundance and error analysis. An overview of the derived elemental abundances and a summary of the abundance characteristics for this star is presented in §5. Possible interpretations of the observed abundances are discussed in §6, while the implications for future surveys to identify additional HMP stars are given in §7. A summary and concluding remarks are presented in §8.
2 OBSERVATIONS AND MEASUREMENTS
2.1 Sample selection
The digital spectra of the Hamburg/ESO objective-prism survey (HES; Wisotzki et al., 2000) has yielded numerous candidate faint metal-poor stars over the past years. HE 01075240, a mag star, was found amongst these faint objects (Christlieb et al., 2004b).
The selection of candidates for extremely metal-poor stars (Christlieb, 2003) was recently extended to the brightest objects that are measured in the HES; that is, to the magnitude range (Frebel et al., in preparation). The HES objective-prism spectra of stars brighter than suffer from saturation effects, and they were thus excluded from the original selection procedure. However, careful investigation has shown that viable metal-poor candidates can still be selected from among these bright objects, albeit with a 3–4 times lower efficiency than for the selection of fainter stars. HE 13272326 is one of the 1777 bright metal-poor candidates found on 329 (out of a total of 380) HES plates, covering a nominal area of 8225 square degrees of the southern high-galactic latitude sky.
In the course of moderate-resolution ( Å) follow-up observations of the entire sample, HE 13272326 stood out because of its very weak Ca II K line. In a medium-resolution spectrum obtained with the ESO 3.6 m telescope and EFOSC, the Ca II K line index KP and the H index HP2 (Beers et al., 1999) were measured to be Å and Å, respectively, yielding , when the calibration of these indices of Beers et al. (1999) was employed. A second, longer exposure medium-resolution spectrum was taken in May 2004 with the Double Beam Spectrograph at the SSO 2.3 m telescope. Measurements of KP Å and HP2 Å refined the previously derived metallicity to . The color and HP2 value of HE 13272326 appeared to be similar to that of CS 22876–032, which was the most metal-poor dwarf known at that time (: Norris et al. 2000). This suggested that the effective temperatures of the two stars were very similar; further comparison indicated that the metallicity of HE 13272326 might indeed be lower than that of CS 22876–032.
We have been conducting an observing program to measure chemical abundance patterns of ultra metal-poor stars with Subaru/HDS (P.I.: Aoki) since semester S03B (2003). HE 13272326 became a high-priority target during 2004. For comparison purposes, high-resolution data were also obtained for the well-studied, extremely metal-poor dwarf G 6412222We note that this star was re-identified among the bright HES candidates as very metal-poor, and had been designated HE 1337+0012., which has temperature and gravity similar to those of HE 13272326.
2.2 High-resolution spectroscopy
High-resolution spectra of HE 13272326 were obtained with Subaru/HDS during four nights in May and June 2004 using three different settings, covering a total wavelength range of 3050–6800 Å. Comparison spectra of G 6412 were obtained with two settings, covering 3050–5250 Å. Details of the observations are listed in Table 1. The slit width was 0.6 arcsec, yielding a resolving power of . CCD on-chip binning (2 x 2 pixels) was applied.
After bias subtraction and multiplication by the gain factor, the spectra were reduced independently by the first two authors in slightly different ways. W.A. used IRAF333IRAF is distributed by the National Optical Astronomy Observatories, which is operated by the Association of Universities for Research in Astronomy, Inc. under cooperative agreement with the National Science Foundation. procedures, while A.F. used Figaro (Shortridge, 1993). The main difference was that W.A. co-added the individual exposures for a given setting by summing extracted, wavelength-calibrated, and Doppler-corrected spectra. Cosmic-ray hits in the two dimensional CCD images were removed as described in Aoki et al. (2005). A.F., however, computed the median of the frames to account for cosmic ray removal before extracting the orders.
After order merging, it was noticed that the final spectrum reduced by W.A. exceeded the quality of the spectrum reduced by A.F., presumably due to the different methods of co-adding the individual observations. The of W.A.’s spectrum is 20/1 at 3150 Å, 160/1 at 4000 Å and 170/1 at 6700 Å. The is highest (260/1) at 4600 Å, because this wavelength was covered by all three setups. The corresponding values for the spectrum of G 6412 are 50/1 at 3150 Å, 220/1 at 4000 Å, and 270/1 (highest) at 4600 Å. Hence, we decided to mainly work with the better, higher spectrum but to keep using the spectrum reduced by A.F. for consistency checks on our measurements, as originally intended. In the following, telluric absorption at redder wavelengths was corrected only for the spectrum with higher by using the spectrum of a standard star, HD 114376 (B7 III), obtained with the same setup employed for HE 13272326. We note that the superiority of one spectrum is the reason why only the strongest lines could be measured in the spectrum by A.F., and that no upper limits for elements were intended to be derived from that spectrum.
Examples of several spectral regions of the higher spectrum are shown in Fig. 1, together with those of G 6412 and the Sun. This figure includes the Fe I line at 3860 Å detected in HE 13272326, which is much weaker than in G 6412.
2.3 Line identification and measurements of equivalent widths
In the spectrum of HE 13272326 only a very small number of atomic lines is seen, while a number of weak CH and NH molecular lines appear, as reported in Frebel et al. (2005). We systematically searched for atomic lines known to be relatively strong in other metal-poor stars, referring to previous studies in the literature. For iron-peak elements (Ti to Zn), for which a large number of absorption lines are usually detected even in extremely metal-poor stars, we listed the strongest lines measured for G 6412, and carefully looked for them in the spectrum of HE 13272326. As a result, we found a total of 23 lines, among which 17 are used to determine the final abundances (see § 4).
Equivalent widths of the absorption lines of HE 13272326 were measured by fitting Gaussian profiles. Where possible, measurements were made independently by W.A. and A.F. in their reduced spectra. The two sets of values were found to agree within the measurement uncertainties (see Table HE 13272326, an unevolved star with . I. A Comprehensive Abundance Analysis11affiliation: Based on data collected with the Subaru Telescope, which is operated by the National Astronomical Observatory of Japan.). For each line, we adopt the average of the two measurements when the lines are detected in both sets of the spectra. Otherwise, the equivalent widths measured by W.A are used. We note that the Na I lines, which are relatively strong in this object, were measured only in the spectrum reduced by W.A., who applied a correction for the contamination of telluric absorption. The results are listed in Table HE 13272326, an unevolved star with . I. A Comprehensive Abundance Analysis11affiliation: Based on data collected with the Subaru Telescope, which is operated by the National Astronomical Observatory of Japan..
Upper limits on the equivalent widths for several elements that are not detected in our spectrum were estimated using the formula of Norris et al. (2001) for the S/N ratio at the wavelength of each line. The upper limits on the equivalent widths given in Table HE 13272326, an unevolved star with . I. A Comprehensive Abundance Analysis11affiliation: Based on data collected with the Subaru Telescope, which is operated by the National Astronomical Observatory of Japan. are 3 values. For undetected species we give data for the line that provides the lowest upper limit on the abundance.
2.4 Line widths
The widths of several lines were investigated in order to check if HE 13272326 has anomalously high rotational velocity or macroturbulence, which is related to the discussion of the Li abundance (§ 5.5). In the spectrum of HE 13272326, only two Mg I lines (5172 and 5183 Å) are useful for this purpose: all other lines are too weak, or show blends with CH or Balmer lines. The FWHMs of these two lines were measured by fitting a Gaussian profile for HE 13272326 and G 6412, and are given together with equivalent widths in Table 3.
Line broadening by macroturbulence and/or rotation, along with the instrumental broadening, were also estimated by using synthetic spectra. For these measurements, we calculated synthetic spectra of the Mg lines using model atmospheres having the stellar parameters determined in the abundance analysis (see the next section), and searched for the minimum in the fitting of synthetic spectra to the observed one. A Gaussian profile was assumed for the broadening, including instrumental effects. Although the rotation and macroturbulence produce profiles that differ from a Gaussian, this approach provides a first approximation to line broadening by these external effects. The free parameters in the procedure are the Mg abundance, wavelength shift, and the Gaussian broadening. Results are given in Table 3, where the values corrected for the instrumental broadening are presented. For HE 13272326, two possible solutions of the stellar parameters (“dwarf” and “subgiant” cases) were derived (see § 3.2). The difference between the two cases is negligible ( km s-1). While the FWHMs of the lines in G 6412 are larger than those in HE 13272326, the Gaussian broadening is smaller in G 6412 because of the difference of the line strengths: the equivalent widths of the lines in G 6412 are approximately three times larger than those in HE 13272326. The result of these measurements is discussed in § 5.5, comparing with the line widths of other extremely metal-poor, main-sequence stars.
2.5 Radial velocity measurements
Heliocentric radial velocities were measured for the high-resolution spectra obtained at four different epochs. Since the number of atomic lines detected in HE 13272326 is quite limited, the measurements are based only on several Mg I lines at 3830 Å and 5170 Å. Results are given in Table 1. Measurements were also made of G 64–12 for comparison, using the same absorption features as for HE 13272326. Although the random error of these measurements cannot be evaluated because of the small number of lines, a typical error for similar quality spectra using the same technique is 0.2–0.3 km s-1 (e.g. Aoki et al. 2005). Assuming a possible systematic error due to the instability of the instrument to be 0.5 km s-1, the total measurement error is 0.8–1.0 km s-1.
No clear variation of the heliocentric radial velocity was found for HE 13272326 from May 2004 to June 2005. The value derived from the low resolution spectrum of the ESO 3.6 m telescope is km s-1, while the medium resolution spectrum of the SSO 2.3 m telescope provides km s-1. These agree with the results from the Subaru spectra (63.8 km s-1) within the errors, although the constraint on binarity is not strong. Further monitoring of radial velocity is required to investigate this question.
G 6412 also shows no variation of its heliocentric radial velocity. This has been measured by Latham et al. (2002) for 33 epochs covering 13 years, and shows no clear variation. Our value (443.7 km s-1) agrees, within the errors, with the average of their measurements (442.51 km s-1).
2.6 Interstellar absorption
Significant interstellar absorption features arising from Ca and Na are found in the spectra of HE 13272326. Fig. 2 shows the features of the Ca II K and Na I D lines. The VPFIT code (Carswell et al., 1987) was used to derive the column density (), radial velocity (), and Doppler parameter (). We note that the fit was made simultaneously for both Na I D1 and D2 lines ( Å and Å, respectively).
The results are presented in Tables 4 and 5. The radial velocity structure of the interstellar components 1 – 4 of both elements agrees well with each other. The remaining components deviate because the components 5 – 7 of Na I D lines seem to be affected by a terrestrial Na I D emission. We note that, in Fig. 2, the components 1, 3, and 5 of the Na I D1 line show a slight discrepancy at the core where the fit appears less deep compared to the observation. This may be due to a slight saturation of these components of the D2 line.
The study of interstellar features in our data provides a chance to derive constraints on the distance of the star. According to Figure 3 of Hobbs (1974), the lower limit on the distance of HE 13272326 might be estimated to be about 500 pc, based on the Na column density listed in Table 5 (the constraint from the Ca absorption feature is weaker). This result should be taken into consideration in the determination of gravity of this object (see §3.2).
2.7 Photometry
photometry of HE 13272326 and G 6412 was obtained with the 2 m MAGNUM telescope (Yoshii et al., 2003) on 2004 June 23 and 25 (UTC). Both stars were observed at similar airmass () or observed twice to derive the airmass gradients (). The transformation of the instrumental magnitudes for HE 13272326 to values on the Johnson-Kron-Cousins system was made differentially with respect to G 6412, by adopting the magnitudes provided by Landolt (1992)444Note that G 6412 is identical to SA105–815. for the latter. We repeat these values and their errors in Table 6, where we also list the results for HE 13272326, together with photometry from the Two Micron All Sky Survey (2MASS)5552MASS is a joint project of the University of Massachusetts and the Infrared Processing and Analysis Center/California Institute of Technology, funded by the National Aeronautics and Space Administration and the U.S. National Science Foundation. All-Sky Catalog of Point Sources (Cutri et al., 2003).
photometry of HE 1327-2326 was also obtained with the WIYN 3.5m telescope using the OPTIC detector (Howell et al., 2003) on the photometric night of June 8, 2004. Landolt standards were taken immediately before and after the object data, bracketing both in UT and airmass. Aperture photometry was performed on the object and all standard stars. After examining the data, it was decided to use only those standard stars that appeared in the same quadrand (and amplifier) as the target star, thus avoiding any possible systematic calibration errors. This left us with a total of (9, 13, 14) standard stars for () respectively, and left us with RMS fits to the standards that were less than 0.02 in all cases. Unfortunately, the blue standard that we targeted did not fall on the correct amplifier. The bluest remaining standard has of about 0.5, which is slightly redder even than our object. The results are given in Table 6.
photometry of the stars G 6412 and HE 13272326 was also obtained, during the night of 2005, May 22 (UTC), using the CTIO 0.9 m telescope. Landolt standards were obtained during the course of the night, bracketing the range of colors of these two stars. Aperture photometry was performed on the program stars and the standards, and final solutions for the calibrations were carried out in the usual manner. Additional details of the observing procedures can be found in Beers et al. (2005, in preparation). The results are also given in Table 6.
The agreement between the MAGNUM and WIYN measurements is excellent. While the agreement of and values between MAGNUM and CTIO measurements is excellent, small discrepancies () are found for others. However, if the values of HE 13272326 are determined differentially with respect to G 6412 ones, as are done for MAGNUM data, the agreement with MAGNUM results is also excellent for all bands. We adopted the MAGNUM and 2MASS photometry in the determination of effective temperatures (§3.1).
3 STELLAR PARAMETERS
3.1 Effective temperature
The effective temperature () of HE 13272326 was estimated with three different methods. A summary of the results can be found in Table 7.
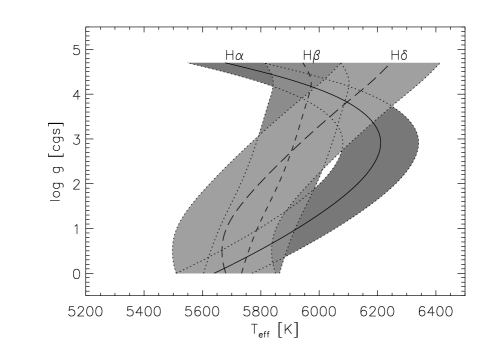
First, we employed profile analysis of H–H, following Barklem et al. (2002). Mixing-length parameters and were employed. Fig. 3 shows the results of the analyses for H, H, and H. Although two solutions at and 0.4 are found from this figure666In this paper values of are given in cgs units., the case of lower gravity is excluded for the reasons described in the next subsection. The results are given in Table 7. We note that a significant theoretical uncertainty arises from the treatment of convection in the model atmospheres, as can be seen from the fact that, for example, choosing and yields 80 K higher temperatures for HE 13272326.
Secondly, we made use of another purely spectroscopic indicator, the H index HP2. The calibration by Ryan et al. (1999) suggests K for G 6412, and K for HE 13272326. A calibration of the HP2 index (Beers et al. 2005, in preparation) which is tied to the scale of Alonso et al. (1996) yields temperatures higher by K and K, respectively.
Thirdly, we derived effective temperatures for HE 13272326 and G 6412 from broadband photometry. Three independent reddening estimates are available for HE 13272326: the maps of Burstein & Heiles (1982) yield ; those of Schlegel et al. (1998) yield . (The maps of Schlegel et al. (1998) yield for G 6412, while those of Burstein & Heiles (1982) yield 0.00.) Finally, Munari & Zwitter (1997) provide empirical relations between the strength of the interstellar absorption of Na I D2 and . The equivalent width of each component of the Na I D2 line by interstellar medium (ISM) was measured as reported in § 2.6, and the corresponding was estimated, using this empirical relations, to obtain the total value of for HE 13272326. The equivalent width of a single component of the Na I D2 line was measured to be 19.2 mÅ for G 6412, which yields . We adopt the Schlegel et al. reddening. The value for HE 13272326 differs by only mag from the average of the three available estimates. The weak interstellar Na I D2 line in G 6412 suggests that the adopted reddening for G 6412 is possibly overestimated.
We adopted the color- relations of Alonso et al. (1996), which are given for Johnson filters and the Telescopio Carlos Sanchez (TCS) filter. In order to apply their relation to our study, our measurements on the Johnson-Kron-Cousins system and the magnitude from 2MASS were transformed to their system.
The transformations of Bessell (1983) were used to convert the Johnson-Kron-Cousins and colors to the Johnson system, while dereddened 2MASS colors and equation (1c) of Ramírez & Meléndez (2004) were used to transform the 2MASS magnitudes to TCS values. Values of the four colour indices are listed in the second and third columns of Table 7.
We note that for stars with significant reddening, it is important to deredden the observed magnitudes before applying the transformations, and not vice versa. This is necessary because transformations between photometric systems provide estimates of ratios of integrated fluxes in wavelength ranges that are (partly) unobserved, based on ratios of observed integrated fluxes. The transformations have been established by means of spectral energy distributions of nearby, (almost) unreddened stars (see e.g. Bessell, 1983). Since reddening affects the spectral energy distribution of a star differently from a change of that would lead to the same observed color, the transformation is valid only for one particular reddening – the value for the stars that were used to establish the transformation (i.e. ). In the case of for HE 13272326, changing the order of dereddening and applying the relevant transformation leads to a difference of 0.018 mag, and a which is 28 K lower777The color provides a temperature estimate that is 154 K lower. We have chosen not to employ this color in our estimate of .. Although this result is significantly smaller than the errors introduced by the uncertainty of the reddening, it is systematic and should therefore be avoided.
Ryan et al. (1999) note that the empirical color- relations provided by Alonso et al. (1996) show an unphysical metallicity dependence at low [Fe/H]. In their Figure 5 it can be seen that the effect becomes significant at . Therefore, we use their scales for in our estimates of for HE 13272326 and G 6412.
The –color calibrations of Houdashelt et al. (2000) provide 6390 K and 6590 K (averages) for HE 13272326 and G 6412, respectively, which are systematically higher than those derived from Alonso et al. (1996). This trend was also found by Cohen et al. (2002) for their dwarf and subgiant stars. We note that the of G 6412 is outside the range of the Houdashelt et al. (2000) calibration (4000–6500 K). Given that the Houdashelt et al. (2000) scale is better calibrated for relatively cooler stars, we adopt here the calibration of Alonso et al. (1996).
The averages of the effective temperatures derived from the four above-mentioned colors yield K for HE 13272326 and K for G 6412. The uncertainty of the reddening of HE 13272326 of about 0.02 mag dominates the error in ; it is K. However, the excellent agreement of the above mentioned effective temperature with K determined with the HP2 index confirms the reddening adopted for this star. The slightly higher derived from colors for G 6412 than from the HP2 index suggests, again, that its reddening might have been slightly overestimated. We adopted the average of the values derived from the HP2 index and colors for G 6412. The resulting values are given in Table 8. It should be noted that the difference of between HE 13272326 and G 6412 estimated by any method in Table 7 is 200–300 K. Although there remain some uncertainties in the determination of , the abundance results of HE 13272326 relative to those of G 6412 are very robust.
3.2 Surface gravity
The small number of absorption lines detected in the spectrum of HE 13272326 makes the determination of its surface gravity a challenge. In particular, the absence of Fe II lines prevents the use of the Fe I/Fe II ionization equilibrium. One Ca I line and two Ca II lines are detected, but the Ca abundances computed with the lines of these two species disagree by dex for , and dex for (see below), so that the ionization equilibrium could only be reached for unreasonably high surface gravities. A discrepancy of the Ca abundances from the Ca I and Ca II of the same order was found for HE 01075240 (Christlieb et al., 2004b). We consider it likely that this is caused by non-LTE effects operating on both species (Korn & Mashonkina, 2005).
A strong constraint on comes from the proper motion of HE 13272326, which is listed in the third Yale/San Juan Southern Proper Motion Catalog (SPM3; Girard et al., 2004) as entry #4266486 with arcsec yr-1 and arcsec yr-1. From the requirement that the transverse velocity of the star must not be larger than the Galactic escape velocity, which we assume to be 500 km s-1, it follows that , resulting in . Inspection of a 12 Gyr isochrone for (Kim et al., 2002) yields that HE 13272326 is either a subgiant (), or a main sequence star ().
From the colors listed in Houdashelt et al. (2000), it may be seen that at K and , the color changes with , and can therefore be used as a gravity indicator. In the relevant parameter range, . Since HE 13272326 is 0.047 mag bluer in than G 6412, the gravity of the former star should be dex higher. That is, it should be located farther down the main sequence. Although the effective temperature scale of Houdashelt et al. (2000) was not adopted in the present study the estimate of the gravity differences between HE 13272326 and G 6412 obtained from their relations is still meaningful.
On the other hand, the relative strengths of the Balmer lines may also be used to constrain (see Christlieb et al., 2004b, for a description of the method). The best agreement among the effective temperatures derived from H–H is reached at and , respectively (Fig. 3). As mentioned above, the low gravity solution is ruled out by the measured proper motion, leaving the subgiant solution. Apart from the better agreement among the results from the individual Balmer lines, the profiles match the observations better if a subgiant gravity is assumed, rather than the main sequence value of .
Finally, we attempted to use survey volume and detection probability arguments to decide whether HE 13272326 is a subgiant or a main sequence star. From the isochrones of Kim et al. (2002), for [Fe/H] and age = 12 Gyr we read that the absolute visual magnitudes for a star with K (and ) on the main sequence and on the subgiant branch are and , respectively. It follows that the survey volume for subgiants with K in a flux-limited survey is 24 times larger than for main sequence stars of the same . One may also use the data of Kim et al. (2002) to determine the relative numbers of subgiants and dwarfs expected in a complete sample: assuming their mass function defined by x = 1.35 (i.e. Salpeter) we find that for the expected ratio of dwarfs to subgiants is 30. Combination of the relative number of stars in the subgiant and main sequence evolutionary state with the ratio of survey volumes then yields that the probabilities of HE 13272326 being a dwarf or a subgiant are roughly equal.
We have thus carried out our abundance analysis for both gravities inferred from the isochrones of Kim et al. (2002): and . As shown below, the two assumptions yield very similar results for the chemical abundances. We note that the distances estimated from the above gravities are 1.4 kpc (subgiant case) and 0.47 kpc (dwarf case). Neither possibility can be excluded by the constraint from the interstellar absorption.
Recent studies for G 6412 yield a gravity of (e.g. Akerman et al., 2004). Assuming it to lie on the main sequence, we estimated the gravity to be from the above isochrone. The LTE iron abundance derived from Fe II lines adopting this gravity is slightly higher than that from Fe I lines (see next section and Table 9). This discrepancy could, however, be explained by NLTE effects for the Fe I lines (e.g. Thévenin & Idiart, 1999; Korn et al., 2003), rather than errors in the gravity estimate.
3.3 Microturbulence
Apart from the lines of hydrogen, the only strong features in the spectrum of HE 13272326 are the H and K lines of Ca II. However, no weak Ca II line is detected, and it is therefore impossible to adjust the microturbulent velocity in the usual way by requiring that no trend of the abundance of a given species is seen with line strength. That said, given the general line weakness, the choice of does not significantly influence the results of our abundance analysis for all but one species. The exception, of course, is Ca II, the abundance of which exhibits a strong dependence on of almost 0.4 dex per km s-1. Therefore, well-justified values for should be chosen for the analysis of this species.
We determine empirically by averaging over values obtained by Cohen et al. (2004) for very metal-poor subgiants and main sequence stars with effective temperatures similar to that of HE 13272326. In selecting stars for this exercise, we take into account that Cohen et al. (2004) adopt the scale of Houdashelt et al. (2000), which is K higher than the scale we adopt here, and accept stars with K from their sample. We thus obtain km s-1 for , and km s-1 for .
The value of for G 6412 was determined from 59 Fe I lines by requiring no dependence of the derived abundances on line strengths. The result is 1.6 km s-1. This value agrees very well with that adopted for HE 13272326.
4 ABUNDANCE ANALYSIS
In this section we report on our model atmosphere abundance analyses for HE 13272326 and G 6412. Table 9 provides the abundances derived by W.A. using model atmospheres of Kurucz (1993b), along with those obtained by A.F. using MARCS models (see below) reported in Frebel et al. (2005). The agreement between the analyses is fairly good in general. We first compare the model atmospheres of the two grids (§ 4.1). In §§ 4.2–4.6 the details of the abundance analyses and results, along with error estimates, are discussed. Abundances are determined for gravities corresponding to the main sequence and subgiant cases discussed above.
4.1 Model atmospheres
Fig. 4 shows the thermal structures of model atmospheres used in the analysis. In this figure, the temperature is shown as a function of the gas pressure, and the points where the optical depth at 5000 Å is 1.0 and 0.1 are presented. We obtained the ’Kurucz’ models for K and and 4.5 by interpolating the grid for [Fe/H], which was calculated using an overshooting approximation (Castelli et al., 1997) for the scaled solar abundances. The MARCS models (e.g. Gustafsson et al., 1975) were calculated using the latest version of the code (Gustafsson et al., in preparation) for [Fe/H] assuming the enhancements of C ([C/Fe]=+2.0) and alpha elements ([/Fe]=+0.5). Comparison of the models in Fig. 4 depicts that the thermal structures agree well in general, even though the assumed carbon abundances are significantly different. Since carbon-bearing molecules like CH and CN are not strongly represented in this object because of its high temperature ( K), enhanced carbon and nitrogen do not provide important sources of opacity. The difference in the thermal structure in internal regions () would be due to the differences in the treatment of convection between the two model calculations.
4.2 Iron
Seven Fe I lines are seen in our spectrum of HE 13272326. Three of them are blended with Balmer lines, and only four were used to determine the final Fe abundance of this object. The two lines at 3581.2 Å and 3859.9 Å are clearly detected (see Fig. 1 for an illustration); they have strengths in the range 5–7 mÅ. Two further lines at 4045.8 Å and 3820.4 Å are barely detected. Using only these four lines we derive iron abundances of and for the subgiant and main sequence gravities, respectively.
The equivalent widths of the other three lines (3737.1, 3745.6, and 3758.2 Å), given in Table HE 13272326, an unevolved star with . I. A Comprehensive Abundance Analysis11affiliation: Based on data collected with the Subaru Telescope, which is operated by the National Astronomical Observatory of Japan., were measured by regarding the wing profile of Balmer lines as a pseudo-continuum. This simple assumption would be justified by the fact that the higher order Balmer lines are formed in very deep atmospheric layers, while the Fe I lines with low excitation potential are formed in relatively higher layers. The result of the analysis including these three lines (i.e. using all seven lines detected) gives an iron abundance higher by 0.05 dex than the result from the four lines. This difference is smaller than the random error of Fe abundance (see below). We note that a spectrum synthesis for Fe and Balmer lines was not attempted, because of the difficulty in estimating the real continuum.
As a check of the reality of the Fe I line detections, we computed predicted strengths for an extensive list of Fe I lines for . Though the line at 3719.9 Å is predicted to be strong enough to be detectable, this line is not clearly detected because the spectrum is severely disturbed by a cosmic ray hit at this wavelength.
Numerous CH lines exist in the spectrum of HE 13272326, as seen in our Fig. 5 as well as in Figure 1 of Frebel et al. (2005). It is important to note that our spectrum synthesis calculations, which include CH lines, confirmed that none of the Fe I lines we use are blended with CH lines of measurable strength.
The random error in the Fe abundance was estimated for 1 errors of the equivalent width measurements, determined using the formula of Norris et al. (2001) for individual Fe I lines. The derived value is given in Table 10. Errors in [Fe/H] due to uncertainties in the atmospheric parameters were estimated for changes of K, dex, and km s-1, as given in Table 10. The root-sum-square value of these four sources is adopted as the final abundance error. The random error of the observational measurement and that arising from the effective temperature estimate are the dominant sources of uncertainty in the Fe abundance determination from Fe I lines.
We adopt (Fe) dex as the NLTE correction for the iron abundance determined from Fe I lines, based on the studies by Korn et al. (2003), Gratton et al. (1999), Thévenin & Idiart (1999), and Collet & Asplund (2005, in preparation), as discussed by Asplund et al. (2005a).
A significant 3D effect on the formation of Fe lines is also expected. Calculations including this effect results in lower Fe abundance, and the effect is significant in particular in metal-poor stars (Asplund et al., 1999). However, the direction of the correction for this effect is opposite to that for an NLTE one. A full analysis including both 3D and NLTE effects is required to estimate the uncertainties of our analysis by neglecting these effects.
The upper limit of the Fe abundance estimated from the Fe II 5018.5 Å line is one order of magnitude higher than the Fe abundance determined from neutral lines. This upper limit is too high to usefully constrain the gravity from the Fe I/Fe II ionization balance.
4.3 C, N, and O
The carbon abundance was measured with spectrum synthesis calculations of weak lines of the A–X and B–X systems of CH, as well as the G band at Å (see Fig. 5). The line list of this molecule was produced using molecular constants provided by Zachwieja (1995) and Kȩpa et al. (1996), and -values of Brown (1987). The spectrum synthesis using this list and the solar model atmosphere by Holweger & Müller (1974) reproduces the solar carbon abundance ((C)=8.55) derived by Grevesse et al. (1996) . In this paper, however, we adopt the solar carbon abundance ((C)=8.39) determined by Asplund et al. (2005b). The (C) values in Table 9 are the carbon abundances corrected for this revision of the solar abundance. The C abundances determined from the different features of CH agree to better than dex. The C–X system of CH at 3140 Å is also detected, but is not used to determine the C abundance because of the low quality of the spectrum at this wavelength.
No 13CH line is detected in the HE 13272326 spectrum. The limit on the carbon isotope ratio (12C/13C) was estimated from the CH molecular features around 4220 Å, where the line positions of the 13CH band were calculated using the molecular constants of Zachwieja (1997). Fig. 6 compares the observed spectrum with synthetic ones calculated assuming 12C/13C=3, 5, and 10. From this comparison we estimate the lower limit of the 12C/13C to be 5. This is a limit if a S/N ratio of 200/1 is adopted. In order to obtain a tighter lower limit of this isotope ratio, a higher quality spectrum is needed. The lower limit estimated in the present analysis, however, is already higher than the equilibrium value of the CNO cycle (12C/13C=3–4). This could be an important constraint on models seeking to explain the origin of the large enhancement of C and N in this object.
The NH band at Å is detected in our spectrum (Fig. 7). We first calculated the synthetic spectrum of this feature using the line list provided by Kurucz (1993a) and the solar model (Holweger & Müller, 1974), and found that to fit the solar spectrum requires a nitrogen abundance lower by 0.4 dex than that of Asplund et al. (2005a). We therefore systematically reduced the values in Kurucz’s NH line lists by 0.4 dex in the present work.888We also attempted the analysis using an NH line list kindly provided by A. Ecuvillon that was used in previous work (Ecuvillon et al., 2004). We found the solar spectrum of the NH band is well reproduced by the line data, while the feature of HE 13272326 was not. Further investigation of the line data is desired for future analysis for high-quality spectra.
Spectrum synthesis (see Fig. 7) yields for and for . Unfortunately, the uncertainty of the continuum estimate is rather large, as can be seen in Fig. 7. This is an important source of error in the N abundance determination.
From the comparison of synthetic spectra with the observed one (Figures 5 and 7), we estimate a fitting error of 0.1 and 0.2 dex for CH and NH bands, respectively. The systematic errors related to atmospheric parameters, estimated by the same method as for Fe described in § 4.2, are given in Table 10. The final total errors of C and N abundances are 0.24 and 0.30 dex, respectively.
Significant 3D effects on CH and NH lines are expected (Asplund 2004; Asplund et al. 2005a). The corrections for the C and N abundances from these molecular features are estimated to be – dex depending on the lines used for the analysis, and they are not compensated by NLTE effects. Since we adjusted the gf-values to fit the CH and NH features in the solar spectrum, these corrections would be partially compensated. However, the 3D effect in metal-deficient stars is more significant than in metal-rich ones. We here point out that systematic errors due to the 3D effect might be included in our 1D analysis, in addition to the uncertainties mentioned above.
From the absence of UV-OH lines, we determine an upper limit for the oxygen abundance of for the subgiant stellar parameters, and for the main sequence parameters in Frebel et al. (2005). We did not repeat the analysis for OH lines in this work, and adopt the results of Frebel et al. (2005) here.
Because no clear features from the above molecules are found in our spectrum of G 6412, we did not attempt to measure its C, N, and O abundances. For comparison purposes, the abundances determined by previous studies are given in Table 9. It should be noted that while the N abundance was estimated from the NH molecular features by Israelian et al. (2004), those of C and O were determined from C I and O I lines in the near infrared by Akerman et al. (2004). G 6412 shows no clear excess of C and O compared with values found in other extremely metal-poor stars, while a large overabundance of N is found.
4.4 Elements from Na () to Zn ()
The Na abundance of HE 13272326 was measured from the Na I D lines. The contamination by telluric lines was removed by using the spectrum of a rapidly rotating early-type star, and is not a significant source of error. The difference in abundance derived using different model atmospheres (Kurucz and MARCS models), is largest (0.14 and 0.11 dex for subgiant and dwarf cases, respectively) among the elements analyzed here. The reason for this relatively large discrepancy is unclear.
The Na I D lines are known to be severely affected by departures from LTE. We adopted the NLTE correction of dex estimated by Takeda et al. (2003). A large overabundance of Na is found in HE 13272326 ([Na/Fe]), even after the NLTE correction. For G 6412 [Na/Fe] has also been estimated from the Na I D lines by Aoki et al. (2005, in preparation) using a very high S/N spectrum obtained with Subaru/HDS. The Na abundance of this star exhibits a rather large underabundance (the NLTE corrected value is [Na/Fe]) compared with other extremely metal-poor stars (e.g. five stars with [Fe/H] studied by Cayrel et al. 2004 have [Na/Fe] , after the NLTE correction of dex, on average).
The Mg triplets at 3820 Å and 5170 Å are clearly detected in the HE 13272326 spectrum (Fig. 8). Since two lines of the former system blend with a Balmer line (H9), only the remaining four are used in the abundance analysis. The NLTE effect is estimated not to be large ( dex: e.g. Gehren et al. 2004). One sees that Mg also exhibits a large overabundance ([Mg/Fe]) in HE 13272326, while that of G 6412 ([Mg/Fe]) is typical of values found in other extremely metal-poor stars (e.g. Cohen et al., 2004).
The Al abundance was determined from the doublet line of Al I at 3961 Å. (Although the other component of this doublet at 3944 Å is clearly detected, it is blended with CH lines. Spectrum synthesis for the 3944 Å line, including CH features, provides a consistent result with that from the standard analysis of that at 3961 Å.) A significant NLTE effect is known for this Al I line ( dex: e.g. Baumüller et al. 1997; Gehren et al. 2004). The Al abundance of G 6412 was also determined, yielding [Al/Fe] = (LTE), which is typical for extremely metal-poor objects (e.g. Cohen et al., 2004). The [Al/Fe] value (LTE) of HE 13272326 is approximately 1.7 dex higher than that of G 6412. This large excess of Al is discussed in detail in §5.
The Ca II K line of HE 13272326 is clearly separated from the complex interstellar absorption feature, as shown in Figure 1 of Frebel et al. (2005), while the Ca II H line at 3968 Å blends with a Balmer line (H). The Ca abundance derived from the K line shows a large excess in HE 13272326 ([Ca/Fe]). By way of contrast, the very weak absorption of Ca I 4226 Å (Fig. 9) yields a relatively low abundance ([Ca/Fe]). The large difference between the abundances derived from these two species suggests significant NLTE effects, and further investigation of the weak feature of Ca I, as well as NLTE effects, is required to solve this discrepancy. We adopt the average of the Ca abundances determined from the two species in the following discussion. The Ca abundance of G 6412 was estimated from six Ca I lines including the 4226 Å feature. These six lines give a consistent result within the errors. The [Ca/Fe] value of this star is similar to those found in other extremely metal-poor stars (e.g. Cohen et al., 2004).
The Ti abundance of HE 13272326 was determined from two weak Ti II lines in the near-UV range. The relatively low quality of the spectrum in this wavelength range leads to a rather large abundance uncertainty: the estimated random error is 0.17 dex. Two other Ti II lines at 3759.3 and 3961.3 Å are detected, though they exist in the wings of Balmer lines. As for the Fe I lines, we applied our analysis to the equivalent widths of these lines measured assuming the wing profile of the Balmer lines as a pseudo-continuum for comparison purposes. The abundance derived from these two lines is 0.29 dex higher than that from the two lines in the near-UV range. This size of discrepancy might be reasonable, given the uncertainties of abundance determination from both line sets. The derived Ti abundance values ([Ti/Fe]=+0.5 to +0.7) show some excess of Ti with respect to Fe, but not as large as those of the lighter elements (e.g. Mg). In the near-UV spectrum of G 6412, a number of Ti II lines are detected; the derived Ti abundance shows a small excess.
The abundance errors for the above elements were estimated in the same manner as for Fe (Table 10). The errors due to the uncertainties in equivalent width measurements dominate the final errors of Ca and Ti, because of the weakness of the lines and the limited S/N of the UV spectrum.
The iron-group elements Cr, Mn, Co and Ni, as well as Zn, are not detected in HE 13272326, although we attempted to search for lines which are found in other metal-poor stars, as mentioned in § 2.3. The 3 upper limits on the abundances for these elements are given in Table 9. In general, these upper limits, except for that of Ni, are too high to usefully constrain any nucleosynthesis models. The limit for Ni might have some significance for the supernova models proposed to explain the iron-deficient stars (e.g. Umeda & Nomoto, 2003). A higher quality UV spectrum is needed to determine the abundances of Ni and other elements, or to provide tighter upper limits.
4.5 Neutron-capture elements
The Sr II resonance lines at 4077 Å and 4215 Å are clearly detected in both HE 13272326 and G 6412 (see Fig. 10). Although the Ba II resonance lines are also relatively strong in extremely metal-poor stars, including G 6412, they are not seen in the spectrum of HE 13272326, in spite of the spectrum having its highest ratio at these wavelengths. The 3 upper limit on the Ba abundance in HE 13272326 was estimated from the 4554 Å line, leading to a lower limit of the Sr/Ba ratio that plays an important role in constraining the origin of neutron-capture elements (§ 5.6). No other neutron-capture element is detected in HE 13272326, and no useful upper limit is derived from our spectrum.
4.6 Lithium
We do not detect the Li I doublet at 6707 Å in HE 13272326. The detection formula of Norris et al. (2001) yields a -level limit of 6.9 mÅ, from which we derive an upper limit for the Li abundance of . This can be seen in Fig. 11, where comparisons of synthetic spectra adopting and 1.7, respectively, with the observed spectrum are shown. The non-detection of Li in this object is in strong contrast with the value expected from the Spite plateau.
G 6412 is known to share the Li abundance of the Spite plateau. In Table 9 we provide the value determined by Aoki et al. (2005, in preparation).
5 Chemical abundance characteristics
We now review the elemental abundances of HE 13272326 and discuss their implications, by comparing our results with those of other extremely metal-poor stars. Fig. 12 shows the values of [X/H] as a function of atomic number for HE 13272326 and HE 01075240. For this illustration we have used the results for the subgiant case for HE 13272326 including NLTE corrections, which we have also applied to the abundances of HE 01075240 as reported by Christlieb et al. (2004b). For comparison purposes the chemical abundance patterns of the average of extremely metal-poor stars with [Fe/H], and those of the carbon-rich objects CS 22949–037 and CS 29498–043 (Depagne et al. 2002; Aoki et al. 2004) are shown by lines with open and filled circles, respectively.
5.1 Fe abundance
The most remarkable result of this investigation is the low Fe abundance of HE 13272326. The NLTE-corrected value of [Fe/H] is more than one order of magnitude lower than the Fe abundances of previously known metal-poor dwarfs and subgiants (e.g. CS 22876–032 with [Fe/H] ; Norris et al. 2000). The Fe abundance of HE 13272326 is even lower, by 0.2 dex, than that of HE 01075240, a giant with an outstandingly low Fe abundance compared to that of other low-metallicity stars. Taking into account the unavoidable errors in the determination of Fe values in both of these stars, HE 13272326 and HE 01075240 should be regarded to have similar Fe abundances, well-separated in [Fe/H] from all other known stars.
The stars with the lowest iron abundances, other than HE 13272326 and HE 01075240, have [Fe/H] (e.g. Cayrel et al., 2004)999The iron abundance of CD determined by Cayrel et al. (2004) is [Fe/H], i.e. slightly lower than (e.g. Norris et al., 2001). This depends, however, on the atmospheric parameters adopted in the analysis. Here, we regard the iron abundance of this star to be [Fe/H] in order to simplify the discussion.. Quite recently the iron abundance of the dwarf carbon star G 77–61 was redetermined to be [Fe/H] (Plez & Cohen, 2005). Thus, there exists at least a one dex gap between the two most iron-deficient stars (HE 13272326 and HE 01075240) and all others. This is an unexpected result, differing significantly from models of the metallicity distribution function reported before the discovery of HE 01075240 in 2001. For instance, the model of Tsujimoto et al. (1999), which explains well the metallicity distribution function for stars with [Fe/H], predicts a continuously, and more rapidly, decreasing trend for the fraction of stars in the lower [Fe/H] range. The existence of two stars with [Fe/H], along with the absence of stars with [Fe/H], suggests that some unidentified mechanism has worked to produce the observed iron-abundance distribution.
5.2 C overabundance
Another similarity between HE 13272326 and HE 01075240 is their large overabundance of carbon ([C/Fe]). Fig. 13 shows the carbon abundance ratios as a function of [Fe/H] for very metal-poor stars, including the above two. The high [C/Fe] values together with the low Fe abundance clearly distinguish these two stars from all others. It should be noted, however, that there exist two extremely metal-poor ([Fe/H] to ) stars with large overabundances of carbon (CS 22949–037 and CS 29498–043). The relationship with these carbon-rich objects will be discussed in the next subsection.
It should be noted that the C overabundance of HE 13272326 was not known at the point of sample selection. Although the overabundance of C relative to Fe is very large, as a result of its high effective temperature molecular features are not strong in this object. The excess of C was only recognized, for the first time, from the high-resolution Subaru spectrum. This was also the case for HE 01075240, the other HMP star with [Fe/H]; the carbon richness of this star was first appreciated only when it was observed at moderate spectral resolution. One may therefore exclude the possibility that our recognition of the strong carbon overabundance in either of these stars results from a selection bias. Both were selected as metal-poor candidates based solely on the weak Ca II K lines in their objective-prism spectra.
5.3 Excesses of Na, Mg and Al
Remarkable differences are found in the abundance patterns of HE 13272326 and HE 01075240 for the elements Mg and Al. While the abundance ratios of Mg and Al in HE 01075240 are not high ([Mg/Fe] and [Al/Fe], Christlieb et al. 2004) and similar to those of stars with [Fe/H], HE 13272326 exhibits clear excesses (see Table 9). Fig. 12 demonstrates that the abundance ratios in HE 13272326 gradually decrease with increasing atomic number from C to Fe.
Fig. 14 shows [Mg/Fe] as a function of [Fe/H] for extremely metal-poor stars, including these two objects. One sees that HE 13272326 shares its Mg overabundance with the carbon-enhanced, metal-poor stars CS 22949–037 (McWilliam et al. 1995; Norris et al. 2001; Depagne et al. 2002) and CS 29498–043 (Aoki et al., 2002a, 2004), in contrast with the value for HE 01075240. The high Mg/Fe ratios in these objects can be interpreted as a result of nucleosynthesis by supernovae that have ejected only small amounts of material from the vicinity of the iron core (Tsujimoto & Shigeyama, 2003; Umeda & Nomoto, 2003). If HE 13272326 is related to these carbon-rich, extremely metal-poor stars, a similar explanation might be applied to HE 13272326, as well as to HE 01075240 (see § 6.2).
The Al/Mg ratio of HE 13272326 ([Al/Mg], assuming LTE) is significantly higher than the values found in other extremely metal-poor giants ([Al/Mg] in LTE, e.g. Cayrel et al. 2004, Honda et al. 2004). While measurements of Al abundances have been made only for a small number of extremely metal-poor dwarfs, the [Al/Mg] value of G 6412 (: Table 9) and of CS 22876–032 (, Norris et al. 2000) are clearly lower than that of HE 13272326. The above comparisons suggest, therefore, that the relatively high Al/Mg ratio of this object is not the result of a difference in NLTE effects between giants and dwarfs, in spite of the large NLTE effects (0.6 dex) expected for Al.
The excess of Al might be related to that of another odd-numbered element, Na. The [Na/Mg] value for HE 13272326, without NLTE correction, is , much higher than that of G 6412 ([Na/Mg]) and those found in extremely metal-poor giants ([Na/Mg], Cayrel et al. 2004). HE 01075240 has a similarly high Na/Mg ratio ([Na/Mg], Christlieb et al. 2004b). Na overabundances are also found in the carbon-enhanced, extremely metal-poor stars CS 22949–037 and CS 29498–043, which also exhibit large overabundances of Mg and Al. Their [Na/Mg] values (, Cayrel et al. 2004, Aoki et al. 2004) are significantly higher than those found in other extremely metal-poor giants, though not as high as that of HE 13272326.
5.4 N and O abundances
The N abundance of HE 13272326 is nearly two orders of magnitude higher than that of HE 01075240. This was determined from the NH molecular band at 3360 Å for HE 13272326, while the CN molecular band at 3880 Å was used for HE 01075240 (Christlieb et al., 2004b). Although possible systematic differences in N abundances determined from these two different features has been advocated (e.g. Spite et al., 2005), the suggested systematic difference is small compared to the extremely large N overabundances of these two stars.
The high N abundance of HE 13272326 cannot be explained by internal processes, including CN-cycling and mixing, since it is either a subgiant or main-sequence object. The lower limit of the 12C/13C ratio (), which is higher than the equilibrium value obtained from the CN cycle, also supports this conjecture, though the constraint from the carbon isotope ratio is still weak. While mixing effects might occur in the giant HE 01075240, its low 13C content (Christlieb et al., 2004b) suggests it is also not significantly affected by internal processes. The large overabundance of N in HE 13272326 (and possibly in HE 01075240) thus require an extrinsic origin. We note further that the excesses of N might be related to the large excesses of the odd-numbered elements Na and Al.
The constraint on the O abundance ([O/Fe] to ) is still weak. If the C/O ratio of HE 01075240 is assumed, [O/Fe] of HE 13272326 would be +2.4. Taking the enhancement of Mg into account, however, the expected O abundance for HE 13272326 might be higher. Since the abundance of O is key to discriminating between scenarios to explain the abundance pattern of this object, further investigations for OH molecular lines in the UV range are urgently required.
5.5 Li depletion
One quite unexpected result of our investigation is the non-detection of Li in HE 13272326. The upper limit on its Li abundance is (Li). This is clearly lower than the values found in metal-poor main sequence or subgiant stars with similar effective temperatures ( K). For instance, Ryan et al. (1999) determined Li abundances of (Li) to 2.2 for 22 main-sequence turnoff stars with [Fe/H] and 6050 K K. The dependence of the Li abundance on metallicity found by Ryan et al. (1999) is represented as (Li)[Fe/H]. A simple extrapolation to [Fe/H] (the LTE value) results in (Li), although there is at present no physical reason for such an extrapolation.
The Li abundance of the previously most metal-poor dwarf CS 22876–032 is (Li) (Norris et al., 2000). Even if HE 13272326 is a subgiant, no significant depletion of Li is expected, given the result that a cooler metal-poor subgiant, HD 140283 ( K), has (Li) (e.g., Ford et al., 2002).
The Li abundances measured for these very metal-poor dwarfs are lower than the primordial Li abundance expected from standard Big Bang Nucleosynthesis models if one adopts the baryon density estimated from the Wilkinson Microwave Anisotropy Probe (WMAP; Spergel et al., 2003). The explanations for this discrepancy are still controversial (e.g. Coc et al., 2004), and no clear solution has yet been obtained. This problem is beyond the scope of the present work, although it clearly remains important to pursue. The question to be addressed here is the discrepancy between the Li abundance of HE 13272326 and other extremely metal-poor stars with similar effective temperatures.
“Li-depleted” stars are known to exist among metal-poor, main-sequence stars, although the number fraction of such stars is quite small: about 5%. Ryan et al. (2002) investigated in detail four “Li-depleted” halo stars, which are main-sequence turnoff stars that are extremely deficient in Li. They found three of them to exhibit substantial line broadening, which they attributed to stellar rotation ( km s-1). They hypothesized that the high rotational velocity is caused by mass and angular momentum transfer across a binary system from an initially more massive donor, which has also affected the surface Li abundance of the star currently being observed.
The line widths of HE 13272326, and of G 6412, for comparison purposes, were
reported in § 2.4. The FWHM of HE 13272326 is 9.2 km s-1, on
average, for equivalent widths of 20–30 mÅ. The FWHM of lines of similar
strength in Li-normal stars studied by Ryan et al. (2002) is 9 km s-1
(Figure 1 of their paper). The spectral resolution of our spectra
() is slightly higher than those of Ryan et al. (2002)
( or 50,000). Given the effects of the difference in resolution,
which are 0.8–1.8 km s-1 for line widths of 9.2 km s-1, the
line broadening of HE 13272326 might be slightly larger than those of “Li-normal”
stars. This is, however, within the scatter of the line widths of
“Li-normal” stars. Indeed, the FWHM of the Mg lines measured for the
“Li-normal” star G 6412 (9.8 km s-1 at equivalent widths of
78–93 mÅ, see Table 3) is also slightly larger than those in
“Li-normal” stars studied by Ryan et al. (2002), if the difference of
spectral resolution is taken into account.
It should be noted that this result relies on the measurements for only two
Mg lines. In order to derive a definitive conclusion, estimates from higher
quality spectra and/or a larger number of lines are strongly desired.
Our conclusion here is that no clear excess broadening by rotation or macroturbulence, with respect to “Li-normal” stars, is found in HE 13272326, and the cause for the lower Li abundance of this star than those of other metal-poor main-sequence stars or warm subgiants has not yet been identified. It has to be remarked, however, that none of the other metal-poor main-sequence stars has such large overabundances of C and N, so it is far from obvious that we should expect HE 13272326 to have the same abundance of such a fragile element like Li.
5.6 Neutron-capture elements
Among elements heavier than the iron group, only Sr is detected in HE 13272326. Singly-ionized Sr has strong resonance doublet lines in the blue region, which enable one to measure its abundance in very metal-poor stars. While the Sr/Fe ratio of HE 13272326 is remarkably high ([Sr/Fe] ), given its low Fe abundance, the Sr abundance ((Sr)) itself falls within the large dispersion of Sr abundances ((Sr) to 0) found in very metal-poor stars (e.g., Figure 6 of Aoki et al. 2005). We note that the upper limit of Sr abundance for HE 01075240 ((Sr), [Sr/Fe]) is significantly lower than the value found here for HE 13272326. The large scatter of Sr/Fe found in very metal-poor stars suggests that the origin of this neutron-capture element is quite different from that of Fe in the early Galaxy. The excess of Sr in the Fe-deficient star HE 13272326 supports this suggestion.
Singly-ionized Ba also has strong resonance lines, at 4554 Å and 4934 Å, which are not seen in the spectrum of HE 13272326. The upper limit on the Ba abundance estimated from the Ba II 4554 Å line is [Ba/Fe]. This limit is weak, given that most extremely metal-poor stars with [Fe/H] have [Ba/Fe] (e.g. McWilliam 1998; Honda et al. 2004). The limit for the Sr/Ba ratio ([Sr/Ba]), however, provides an important constraint on the origin of neutron-capture elements in this object. The value of Sr/Ba produced by the main s-process at low metallicity is known to be very low ([Sr/Ba]) (e.g. Aoki et al., 2002b). This is interpreted as the result of a deficiency of seed nuclei with respect to neutrons that are expected to be provided from 13C()16O, independent of metallicity. Hence, the main s-process is unlikely to have been responsible for the Sr in HE 13272326. The weak s-process, which was introduced to explain the light s-process nuclei () in solar-system material, produces Sr with essentially no Ba. Massive, core He-burning stars are regarded as the astrophysical sites of this process. Theoretical calculations, however, suggest that it is inefficient at low metallicity, because the neutron source expected for the process, 22Ne()25Mg, has a strong metallicity dependence (e.g. Prantzos et al., 1990).
The Sr/Ba ratio produced by the r-process is best estimated from the value observed in the so-called r-II stars, stars with very large enhancements of r-process nuclei with respect to other metals: [Sr/Ba] in CS 22892–052 (Sneden et al., 2003), in CS 31082–001 (Hill et al., 2002), and in CS 29497–004 (Christlieb et al., 2004a). Although the Sr/Ba ratios in other metal-poor stars exhibit a large scatter, the concordance of the ratio in these three stars suggests that the value produced by the r-process is [Sr/Ba] to . This value is not inconsistent with the lower limit of [Sr/Ba] in HE 13272326. Therefore, it is at least feasible that the Sr in HE 13272326 might have originated from the r-process. Type II supernovae are the most promising sites for this process, although other possibilities have also been proposed (Truran et al., 2002, and references therein). For the purpose of further discussion we refer to the r-process that yields heavy neutron-capture elements as the “main r-process”.
Another possible process has recently been proposed to account for the production of light neutron-capture elements in the early Galaxy. There exists a number of metal-poor stars with high Sr/Ba abundance ratios that cannot be explained by the r-process mentioned above (McWilliam 1998; Honda et al. 2004). Aoki et al. (2005) showed that such stars are particularly evident at extremely low metallicity ([Fe/H]). They also demonstrated that the weak s-process cannot explain the abundance ratio of Y/Zr of these objects. To explain these stars, a process that has provided light neutron-capture elements, including Sr, with little (or no) heavy neutron-capture elements, is required. Although the site and mechanism of this process are still unknown, its characteristics have been studied by Truran et al. (2002), Travaglio et al. (2004), and Aoki et al. (2005). In order to identify the origin of Sr in HE 13272326, a stronger constraint on the Ba abundance is necessary. If the Ba abundance is found to be half that of the upper limit determined by the present work, the main r-process will be excluded as the source of Sr in HE 13272326. Further information on other neutron-capture elements would also be useful. The spectral features of elements other than Sr and Ba, however, are expected to be very weak, and extremely high-quality data will be required in order to detect them.
We note that the Ba abundance of G 6412 ([Ba/Fe]) is significantly higher than that of stars with similar extremely low metallicity ([Fe/H], Aoki et al. 2005). Moreover, the Sr/Ba ratio of this object ([Sr/Ba]) is clearly higher than expected from the main r-process (). These facts suggest a unique history of enrichment of neutron-capture elements in this object.
6 Interpretations of the chemical abundance patterns in HMP stars
HE 13272326 shares important chemical abundance characteristics with HE 01075240, (extreme deficiency of iron-group elements and large overabundance of carbon), coupled with significant differences. Several scenarios have been proposed to explain the abundance pattern of HE 01075240 following its discovery by Christlieb et al. (2002). Perhaps the most interesting question is whether this object was an initially metal-free, low-mass population III star, or an extreme population II one. From this point of view, the scenarios proposed for HE 01075240 might be classified into two groups. One is to assume that it was initially metal-free, and the accretion of a small amount of metals from the ISM provided the iron-group elements currently observed at its surface (Yoshii, 1981). In this case, an additional source is required to explain its high abundances of C, N, and O (Christlieb et al., 2002; Bessell et al., 2004). The other is to assume supernova(e), whose progenitor(s) might be first-generation massive stars, which have provided small amounts of iron-group elements together with large quantities of C, N, and O.
The discovery of HE 13272326 provides new constraints on these models, if we assume that the abundance patterns of these two stars have a common origin. The challenge is that the important differences between the two stars have to be explained self-consistently. The differences are (1) their evolutionary status, (2) the abundance ratios of N, Na, Mg and Al with respect to Fe, and (3) the abundance ratio of Sr. The non-detection of Li in HE 13272326 is another constraint that is not available from HE 01075240 because of its evolutionary status.
6.1 Population III scenarios
We first discuss the possibility that these objects were formed from a metal-free cloud of gas. In this case, the large overabundances of C and N need to be explained by sources other than accretion from the ISM. Self-enrichment of these elements in HE 01075240 was discussed as one possibility (e.g. Shigeyama et al., 2003). The evolutionary status of HE 13272326 (subgiant or main sequence), however, clearly excludes this hypothesis. Self-enrichment of C and N is also unlikely in HE 01075240 (Weiss et al., 2004; Picardi et al., 2004), because of its high C/N and 12C/13C ratios (Christlieb et al., 2004b).
A remaining possibility is mass transfer in a binary system where the primary star provides the secondary with C and N when the former was in its AGB phase of evolution. After the mass transfer, the primary star evolved to become a faint white dwarf, and only the secondary is currently observable. Suda et al. (2004) discussed this possibility in considerable detail. According to their calculations of nucleosynthesis in AGB stars, the excess of O and Na found in HE 01075240 is the result of 13C()16O and neutron-capture starting from 20Ne, following the 16OO reactions. The large overabundances of Mg and Al in HE 13272326 also need to be explained as the contribution from AGB stars. Suda et al. (2004) demonstrated possible production of these elements by neutron-capture processes such as those involving Na. Further calculations are needed to investigate whether such processes can explain the abundance pattern of elements from C to Al in HE 13272326, especially its C/N ratio. It should also be noted that these neutron-capture processes primarily yield heavy Mg isotopes (25Mg and 26Mg), while 24Mg is produced by type II supernovae. Unfortunately, the isotope fractions of Mg are not measurable for these objects, since no MgH feature has yet been detected.
The scenario of mass transfer from an AGB star has the potential to explain the non-detection of Li in HE 13272326, because it is expected to be depleted in most of evolved stars (see, however, Iwamoto et al. (2004) for possible Li enhancement in the N-enhanced AGB stars). Indeed, this is the explanation for Li-depleted main-sequence stars proposed by Ryan et al. (2002), although no signature of rapid rotation or binarity is found in HE 13272326. On the other hand, the high Sr abundance cannot be explained as a result of AGB nucleosynthesis. As seen in § 5.6, the s-process expected in metal-poor AGB stars produces low Sr/Ba ratios, which are inconsistent with the lower limit to the Sr/Ba ratio in HE 13272326. Another explanation is therefore required for the observed Sr abundance in this object.
Since the evolutionary status of HE 13272326 and HE 01075240 is quite different, the depths of their surface convection zones should be significantly different (presumably by more than two orders of magnitude). Therefore, if their surfaces had been similarly contaminated by the ISM, the Fe abundance of HE 01075240 would be expected to be much lower than that of HE 13272326. Their comparable Fe abundances disagree with this expectation. The problem, however, might perhaps be understood if mass transfer in a binary system is assumed, in which the surfaces of HE 01075240 and HE 13272326 preserve material transferred from AGB companions. Here, the Fe abundance ratio is primarily determined by the dilution of Fe accreted from the ISM in AGB stars rather than in the stars we are currently observing. This requires that the accretion from the ISM would be significant enough to pollute the whole envelope of the AGB donor. Accretion from the ISM was also investigated by Suda et al. (2004), who estimated the effect inside the star forming region to be significant.
Some recent theoretical studies (Bromm & Larson, 2004, and references therein) on early star formation predict the formation of exclusively massive and/or super-massive stars from primordial clouds. Others suggest the possibility of low-mass star formation (e.g. Nakamura & Umemura, 2001). The confirmation of HE 13272326 and HE 01075240 as low-mass population III objects would clearly have a great impact on this discussion.
6.2 Population II scenarios
We now discuss the possibility that HE 13272326 and HE 01075240 were born from material polluted by first-generation supernovae. If this scenario pertains, then these objects should be considered extreme examples of population II stars. Their abundance patterns, however, are radically different from those found in most stars with [Fe/H], and therefore require “special” models of progenitor supernovae.
Umeda & Nomoto (2003) proposed a supernova model involving two additional parameters – mixing after explosive nucleosynthesis and subsequent fallback onto the presumed collapsed remnant. Such a mixing was actually observed in SN 1987A and found to take place in the simulation of Rayleigh-Taylor instabilities during the explosion (see Nomoto et al., 1994, for a review). Unusually large fallback can result in small yields of metals other than C, N, and O. Mixing, postulated to occur before the fallback, transfers a small amount of iron-peak elements into the upper layers, which are ejected by the explosion. By tuning these two parameters, their model for a zero-metal 25M⊙ progenitor successfully explains the large overabundances of light elements and the deficiency of heavy elements found in HE 01075240. Since the small yield of Fe indicates that only a small amount of 56Ni is synthesized and thus the radioactive energy input from the decay of 56Ni into 56Co and 56Fe to power the supernova light curve tail is small. Thus such models are sometimes referred to as “faint supernovae” (Nomoto et al., 2003). Umeda & Nomoto (2003) suggested that the two parameters (mixing and fallback) might represent the phenomena occurring in jet-induced aspherical supernova explosions (see also Umeda & Nomoto, 2005).
One advantage of this model is that the observed differences in the Mg/Fe ratios between HE 13272326 and HE 01075240 are easily explained by very small variations of these parameters. Indeed, Iwamoto et al. (2005) quite recently showed that a small difference in the explosion energy causes a difference in the fallback mass, which results in large differences of abundance ratios of Na, Mg, and Al with respect to Fe, and succeeded to explain the abundance pattern of HE 13272326. This idea had also been already applied by Umeda & Nomoto (2003) to the carbon-enhanced stars CS 22949–037 and CS 29498–043, which exhibit overabundances of -elements along with C, N, and O (Norris et al., 2001; Depagne et al., 2002; Aoki et al., 2004). The discovery of HE 13272326 supports the connection between HE 01075240 and these carbon-enhanced stars. The excess of odd-numbered elements is not simply explained by supernova models. However, Iwamoto et al. (2005) showed that these can be explained by including the effect of overshooting in the convective carbon-burning shell in the progenitor models.
Another advantage of the model is that such faint supernovae provide large amounts of light elements, which could be efficient cooling sources in the formation of second-generation low-mass stars (Umeda & Nomoto, 2003). It should be appreciated that HE 13272326 and HE 01075240, their deficiency of iron-group elements notwithstanding, have relatively high “total metallicities”, because of their carbon excesses. Bromm & Loeb (2003) showed that the carbon abundance of HE 01075240 is sufficient to initiate low-mass star formation.
The excesses of C, N, and O are also expected in the yields from the rotating, massive stars. Meynet et al. (2005) quite recently reported the effect of rotation on their model calculations for 60 stars with [Fe/H]. They predict heavy mass loss for the rotating stars, and the large enhancements of C, N, and O in the winds. Moderate excesses of Na and Al are also found. The excesses of these elements, in particular of N, Na and Al, at least qualitatively explain the abundance characteristics found in HE 13272326 and HE 01075240.
A critical unexplained problem is the excess of Sr found in HE 13272326. Production of neutron-capture elements is not included in the Umeda & Nomoto (2003) models, or other supernova models. One possibility might be the r-process occurring in accretion disks or jets expected in anisotropic supernovae models including rotation (e.g. Fujimoto et al., 2004; Surman & McLaughlin, 2005). Another possibility is a so-called “weak” r-process, which might occur in a neutron star wind before the neutron star collapses into a black hole due to fallback (Wanajo & Ishimaru, 2005). A second no less enigmatic difficulty is the Li depletion in HE 13272326, for which no clear understanding is provided by the population II scenario. That said, an ad hoc explanation might be provided by internal rotation effects not reflected in our spectra (e.g. Pinsonneault et al., 1999), because of aspect effects.
6.3 Further constraints expected from future observations
Our tentative conclusion is that the abundance patterns of HE 13272326 and HE 01075240 can be explained by either the “faint supernova” model, or by binary mass transfer along with accretion of metals from the ISM. In order to obtain further constraints on these models, the following observational data for HE 13272326 would be very useful:
Strömgren photometry: In order to constrain the evolutionary status, the Strömgren uvby- photometry would be very useful (e.g. Nissen & Schuster, 1991).
Fe lines: Since the number of detected Fe I lines is still small, a search for more lines, in particular those in the near-UV range, would provide a more accurate measurement of the Fe abundance. Though detections of Fe II lines will be very difficult, because of their expected weakness, a stronger upper limit for these lines would be useful to provide further constraints on gravity from the ionization balance technique.
O abundance: Given the abundance pattern of HE 13272326, a large excess of O is expected. The abundance measurement for this element is key to constraining the nucleosynthesis models of supernovae and AGB stars. Further observations of OH lines in the near-UV region and of the near infrared O I triplet will provide a stronger constraint on the [O/Fe], as discussed in §5.4.
Ba abundance: The abundance ratio of Sr/Ba, or its lower limit, is essential for an understanding of the origin of the overabundance of Sr in this object, and to discriminate between proposed nucleosynthesis models (see §5.6). Further observations of the Ba II resonance lines at 4554 Å and 4934 Å will yield a stronger constraint on the Ba abundance.
Li abundance: Although the position of Li below the Spite plateau value in this object is already clear, determination of its abundance, or at least a stronger upper limit, will be useful for understanding the reason for its apparent depletion101010While not emphasized in the present work, Li abundances for additional dwarfs having [Fe/H] as low as that of HE 13272326 are needed to examine the possible cosmological implications of the present result..
Measurements of line widths: In order to constrain the reason for the Li-depletion, accurate measurements of line widths and shapes are important (see § 5.5). For this purpose, measurements for a larger number of lines than that used in the present work, from high S/N ratio spectra, are required.
Radial velocity monitoring: This is a key for examining scenarios involving mass transfer across a binary system. Suda et al. (2004) estimated that a long orbital period is sufficient to explain the mass transfer required for the abundance patterns of light elements in HE 01075240. A long term monitoring program with high accuracy will be necessary to examine this model for HE 13272326.
7 Implications for future surveys for ultra metal-poor stars
The discovery of HE 13272326 and HE 01075240 provide important lessons for future searches for HMP stars with . Given that the search for such objects is (presently) based on the detection of the Ca II K line, it is worthwhile to examine the complications that exist for the application of this technique to stars at such extreme abundances. In the moderate-resolution follow-up spectrum of HE 01075240, features at the position of the Ca II K line yielded only an upper limit for its iron abundance of . High-resolution spectra obtained later revealed that, at medium-resolution (FWHM 2 Å, ), the Ca II K line is blended with a CH line, which would have resulted in an erroneous identification of the Ca II K line and a considerable overestimate of the star’s iron abundance, had it been cooler and/or its C abundance higher.
In the case of HE 13272326, contamination of the Ca II K line by interstellar absorption, which cannot be resolved from the intrinsic Ca II K line at moderate spectral resolution, and the Ca overabundance of about dex (from the Ca II K line) led to an overestimate of [Fe/H] by as much as 1.5 dex. The Ca overabundance is relevant here, because in the calibration of the Ca II K index KP of Beers et al. (1999), it is implicitly assumed that for . While this assumption is justified for the vast majority of metal-poor stars found in surveys such as the HES, it can lead to overestimates of [Fe/H] for the lowest metallicity stars, because they may have larger overabundances of Ca. Furthermore, the rarity of stars at results in a severe shortage of calibration objects at the lowest abundances, resulting in potentially large uncertainties in the KP-based [Fe/H] measurement in this metallicity range.
For these reasons, spectra with higher resolution (e.g. ) are needed for reliable [Fe/H] estimates of objects having , in order to identify stars among them with .
8 Summary and concluding remarks
A comprehensive abundance analysis has been carried out for HE 13272326, the most iron-deficient star known, using the high resolution spectrum obtained with Subaru/HDS. Our analyses revealed that (1) the NLTE corrected iron abundance is [Fe/H] , slightly lower than that of HE 01075240, and more than 1 dex lower than those of all other metal-poor stars; (2) carbon shows a significant overabundance ([C/Fe]), similar to HE 01075240; (3) light elements (Na, Mg and Al) show moderate enhancements, while N has a remarkable overabundance ([N/Fe]); (4) the light neutron-capture element Sr also shows an enhancement ([Sr/Fe]); (5) the upper limit of Li abundance ((Li)) is below the value of Spite plateau. No significant change in radial velocity has been found in our monitoring in the past year.
The combination of extremely high carbon abundance with outstandingly low iron abundance in HE 13272326 and HE 01075240 clearly distinguishes these two objects from other metal-poor stars. Several models to explain such carbon-enhanced, iron-deficient stars have been proposed. The important differences of abundance patterns from N to Al, as well as of Sr abundances, between HE 13272326 and HE 01075240 provide new constraints on models of nucleosynthesis processes in the first generation objects that were responsible for metal enrichment at the earliest times.
In order to give stronger constraints on these models, further abundance studies for HE 13272326 would be very useful. In particular, determination of Li, O, and Ba abundances, or stronger upper limits, are urgently needed. To address these issues, a new high resolution spectrum has been taken with VLT/UVES (Frebel et al., in preparation). Further monitoring of radial velocities of HE 13272326, as well as of HE 01075240, to investigate their binarity, will also provide important information for the understanding of origins of the peculiar abundance patterns of these objects.
In order to obtain a comprehensive picture of nucleosynthesis and star formation in the early Universe, extensive abundance studies for a larger sample of ultra metal-poor stars are required. In particular, the apparent metallicity gap between [Fe/H] and found in the present sample should be confirmed.
References
- Akerman et al. (2004) Akerman, C. J., Carigi, L., Nissen, P. E., Pettini, M., & Asplund, M. 2004, A&A, 414, 931
- Ali & Griem (1966) Ali, A., & Griem, H. 1966, Phys. Rev., 144, 366
- Alonso et al. (1996) Alonso, A., Arribas, S., & Martínez-Roger, C. 1996, A&A, 313, 873
- Aoki et al. (2005) Aoki, W., Honda, S., Beers, T. C., Kajino, T., Ando, H., Norris, J. E., Ryan, S. G., Izumiura, H., Sadakane, K., & Takada-Hidai, M. 2005, ApJ, in press (astro-ph/0503032)
- Aoki et al. (2002a) Aoki, W., Norris, J. E., Ryan, S. G., Beers, T. C., & Ando, H. 2002a, ApJ, 576, L141
- Aoki et al. (2004) Aoki, W., Norris, J. E., Ryan, S. G., Beers, T. C., Christlieb, N., Tsangarides, S., & Ando, H. 2004, ApJ, 608, 971
- Aoki et al. (2002b) Aoki, W., Ryan, S. G., Norris, J. E., Beers, T. C., Ando, H., & Tsangarides, S. 2002b, ApJ, 580, 1149
- Asplund et al. (2005b) Asplund, M., Grevesse, N., Sauval, A. J., Allende Prieto, C., & Blomme, R. 2005b, A&A, 431, 693
- Asplund et al. (2005a) Asplund, M., Grevesse, N., & Sauval, A. J. 2005a, ASP Conf. Ser. 336: Cosmic Abundances as Records of Stellar Evolution and Nucleosynthesis, Ed, T. G. Barnes & F. N. Bash, 25
- Asplund et al. (1999) Asplund, M., Nordlund, Å., Trampedach, R., & Stein, R. F. 1999, A&A, 346, L17
- Asplund (2004) Asplund, M. 2004, Mem. S. A. It., 75, 300
- Barklem et al. (2000) Barklem, P. S., Piskunov, N., & O’Mara, B. J. 2000, A&A, 363, 1091
- Barklem et al. (2002) Barklem, P. S., Stempels, H. C., Allende Prieto, C., Kochukhov, O. P., Piskunov, N., & O’Mara, B. J. 2002, A&A, 385, 951
- Baumüller & Gehren (1997) Baumüller, D., & Gehren, T. 1997, A&A, 325, 1088
- Beers (1999) Beers, T. C. 1999, in ASP Conf. Ser., Vol. 165, The Third Stromlo Symposium: The Galactic Halo, ed. B. Gibson, T. Axelrod, & M. Putman, 202
- Beers & Christlieb (2005) Beers, T. C., & Christlieb, N. 2005, ARA&A, in press
- Beers et al. (1985) Beers, T. C., Preston, G. W., & Shectman, S. A. 1985, AJ, 90, 2089
- Beers et al. (1992) —. 1992, AJ, 103, 1987
- Beers et al. (1999) Beers, T. C., Rossi, S., Norris, J. E., Ryan, S. G., & Shefler, T. 1999, AJ, 117, 981
- Bessell (1983) Bessell, M. S. 1983, PASP, 95, 480
- Bessell et al. (2004) Bessell, M., Christlieb, N., & Gustafsson, B. 2004, ApJ, 612, L61
- Blackwell et al. (1989) Blackwell, D. E., Booth, A. J., Petford, A. D., & Laming, J. M. 1989, MNRAS, 236, 235
- Bromm & Larson (2004) Bromm, V., & Larson, R. B. 2004, ARA&A, 42, 79
- Bromm & Loeb (2003) Bromm, V., & Loeb, A. 2003, Nature, 425, 812
- Brown (1987) Brown, J. A. 1987, ApJ, 317, 701
- Burstein & Heiles (1982) Burstein, D., & Heiles, C. 1982, AJ, 87, 1165
- Carswell et al. (1987) Carswell, R. F., Webb, J. K., Baldwin, J. A., & Atwood, B. 1987, ApJ, 319, 709
- Castelli et al. (1997) Castelli, F., Gratton, R. G., & Kurucz, R. L. 1997, A&A, 318, 841
- Cayrel et al. (2004) Cayrel, R., et al. 2004, A&A, 416, 1117
- Christlieb (2003) Christlieb, N. 2003, Rev. Mod. Astron., 16, 191, astro-ph/0308016
- Christlieb et al. (2004a) Christlieb, N. et al. 2004a, A&A, 428, 1027
- Christlieb et al. (2002) Christlieb, N., Bessell, M. S., Beers, T. C., Gustafsson, B., Korn, A. J., Barklem, P. S., Karlsson, T., Mizuno-Wiedner, M., & Rossi, S. 2002, Nature, 419, 904
- Christlieb et al. (2004b) Christlieb, N., Gustafsson, B., Korn, A. J., Barklem, P. S., Beers, T. C., Bessell, M. S., Karlsson, T., & Mizuno-Wiedner, M. 2004b, ApJ, 603, 708
- Coc et al. (2004) Coc, A., Vangioni-Flam, E., Descouvemont, P., Adahchour, A., & Angulo, C. 2004, ApJ, 600, 544
- Cohen et al. (2002) Cohen, J. G., Christlieb, N., Beers, T. C., Gratton, R., & Carretta, E. 2002, AJ, 124, 470
- Cohen et al. (2004) Cohen, J. G., Christlieb, N., McWilliam, A., Shectman, S., Thompson, I., Wasserburg, G. J., Ivans, I., Dehn, M., Karlsson, T., & Melendez, J. 2004, ApJ, 612, 1107
- Cutri et al. (2003) Cutri, R. et al. 2003, 2MASS All-Sky Catalog of Point Sources, Tech. rep., Infrared Processing and Analysis Center, vizieR Online Data Catalog II/2246
- Depagne et al. (2002) Depagne, E., Hill, V., Spite, M., Spite, F., Plez, B., Beers, T. C., Barbuy, B., Cayrel, R., Andersen, J., Bonifacio, P., François, P., Nordström, B., & Primas, F. 2002, A&A, 390, 187
- Ecuvillon et al. (2004) Ecuvillon, A., Israelian, G., Santos, N. C., Mayor, M., García López, R. J., & Randich, S. 2004, A&A, 418, 703
- Ford et al. (2002) Ford, A., Jeffries, R. D., Smalley, B., Ryan, S. G., Aoki, W., Kawanomoto, S., James, D. J., & Barnes, J. R. 2002, A&A, 393, 617
- François et al. (2003) François, P., Depagne, E., Hill, V., Spite, M., Spite, F., Plez, B., Beers, T., Barbuy, B., Cayrel, R., Andersen, J., Bonifacio, P., Molaro, P., Nordström, B., & Primas, F. 2003, A&A, 403, 1105
- Frebel et al. (2005) Frebel, A. et al. 2005, Nature, 434, 871
- Fuhr et al. (1988) Fuhr, J. R., Martin, G. A., & Wiese, W. L. 1988, J. Phys. Chem. Ref. Data, 17, Suppl. 4
- Fujimoto et al. (2004) Fujimoto, S., Hashimoto, M., Arai, K., Matsuba, R. 2004, ApJ, .614, 847
- Gehren et al. (2004) Gehren, T., Liang, Y. C., Shi, J. R., Zhang, H. W., & Zhao, G. 2004, A&A, 413, 1045
- Girard et al. (2004) Girard, T. M., Dinescu, D. I., van Altena, W. F., Platais, I., Monet, D. G., & López, C. E. 2004, AJ, 127, 3060
- Gratton et al. (1999) Gratton, R. G., Carretta, E., Eriksson, K., & Gustafsson, G. 1999, A&A, 350, 955
- Grevesse et al. (1981) Grevesse, N., Biemont, E., Lowe, R. M., & Hannaford, P. 1981, Liege International Astrophysical Colloquia, 23, 211
- Grevesse et al. (1996) Grevesse, N., Noels, A., & Sauval, A. J. 1996, ASP Conf. Ser., 99, Cosmic Abundances, ed. S. S. Holt & G. Sonneborn (Cambridge Univ. Press), 117
- Gustafsson et al. (1975) Gustafsson, B., Bell, R. A., Eriksson, K., & Nordlund, A. 1975, A&A, 42, 407
- Heger & Woosley (2002) Heger, A., & Woosley, S. 2002, ApJ, 567, 532
- Hill et al. (2002) Hill, V., et al. 2002, A&A, 387, 560
- Hobbs (1974) Hobbs, L. M. 1974, ApJ, 191, 381
- Holweger & Müller (1974) Holweger, H., & Müller, E. A. 1974, Solar Physics, 39, 19
- Honda et al. (2004) Honda, S., Aoki, W., Kajino, T., Ando, H., Beers, T. C., Izumiura, H., Sadakane, K., & Takada-Hidai, M. 2004, ApJ, 607, 474
- Houdashelt et al. (2000) Houdashelt, M. L., Bell, R. A., & Sweigart, A. V. 2000, AJ, 119, 1448
- Howell et al. (2003) Howell, S. B., Everett, M. E., Tonry, J. L., Pickles, A., Dain, C. 2003, PASP, 115, 1340
- Israelian et al. (2004) Israelian, G., Ecuvillon, A., Rebolo, R., García-López, R., Bonifacio, P., & Molaro, P. 2004, A&A, 421, 649
- Iwamoto et al. (2004) Iwamoto, N., Kajino, T., Mathews, G. J., Fujimoto, M. Y., & Aoki, W. 2005, 602, 377
- Iwamoto et al. (2005) Iwamoto, N., Umeda, H., Tominaga, N., Nomoto, K., & Maeda, K. 2005, Science, 309, 451
- Kȩpa et al. (1996) Kȩpa, R., Para, A., Rytel, M., & Zachwieja, M. 1996, J. Mol. Spectrosc., 178, 189
- Kerkhoff et al. (1980) Kerkhoff, H., Schmidt, M., & Zimmermann, P. 1980, Z. Phys. A., 298, 249
- Kim et al. (2002) Kim, Y., Demarque, P., Yi, S., & Alexander, D. R. 2002, ApJS, 143, 499
- Korn & Mashonkina (2005) Korn, A. J., & Mashonkina, L. 2005, ASP Conf. Ser., IAU symposium 228, From Lithium to Uranium: Elemental tracers of early cosmic evolution, in press
- Korn et al. (2003) Korn, A. J., Shi, J., & Gehren, T. 2003, A&A, 407, 691
- Kupka et al. (1999) Kupka, F., Piskunov, N., Ryabchikova, T. A., Stempels, H. C., & Weiss, W. W. 1999, A&AS, 138, 119
- Kurucz (1993a) Kurucz, R. L. 1993a, Diatomic Molecular Data for Opacity Calculations. Kurucz CD-ROM No. 15. Cambridge, Mass (CD-ROM 15)
- Kurucz (1993b) Kurucz, R. L. 1993b, CD-ROM 13, ATLAS9 Stellar Atmospheres Programs and 2 km/s Grid (Cambridge: Smithsonian Astrophys. Obs.)
- Landolt (1992) Landolt, A. U. 1992, AJ, 104, 340
- Latham et al. (2002) Latham, D. W., Stefanik, R. P., Torres, G., Davis, R. J., Mazeh, T., Carney, B. W., Laird, J. B., & Morse, J. A. 2002, AJ, 124, 1144
- Limongi et al. (2003) Limongi, M., Chieffi, A., & Bonifacio, P. 2003, ApJ, 594, L123
- McWilliam (1998) McWilliam, A. 1998, AJ, 115, 1640
- McWilliam et al. (1995) McWilliam, A., Preston, G. W., Sneden, C., & Searle, L. 1995, AJ, 109, 2757
- Meynet et al. (2005) Meynet, G., Ekström, S., & Maeder, A. 2005, A&A, in press
- Morton (1991) Morton, D. C. 1991, ApJS, 77, 119
- Munari & Zwitter (1997) Munari, U., & Zwitter, T. 1997, A&A, 318, 269
- Nakamura & Umemura (2001) Nakamura, F., & Umemura, M. 2001, ApJ, 548, 19
- Nissen & Schuster (1991) Nissen, P. E., & Schuster, W. J. 1991, A&A, 251, 457
- Noguchi et al. (2002) Noguchi, K., Aoki, W., Kawanomoto, S. et al. 2002, PASJ, 54, 855
- Nomoto et al. (1994) Nomoto, K., Shigeyama, T., Kumagai, S., Yamaoka, H., and Suzuki, T. 1994, in Supernovae, Les Houches Session LIV, ed. S.A. Bludman, R. Mochkovitch, & J. Zinn-Justin (Amsterdam: North-Holland), 489
- Nomoto et al. (2003) Nomoto, K., Maeda, K., Umeda, H., Ohkubo, T., Deng, J., & Mazzali, P. 2003, in IAU Symposium 212, A Massive Star Odyssey, from Main Sequence to Supernova, eds. K.A. van der Hucht, A. Herrero, & C. Esteban (San Francisco: ASP), 395.
- Norris et al. (2000) Norris, J. E., Beers, T. C., & Ryan, S. G. 2000, ApJ, 540, 456
- Norris et al. (2001) Norris, J. E., Ryan, S. G., & Beers, T. C. 2001, ApJ, 561, 1034
- O’Brian et al. (1991) O’Brian, T. R., Wickliffe, M. E., Lawler, J. E., Whaling, W., & Brault, J. W. 1991, J. Opt. Soc. Am. B, 8, 1185
- Picardi et al. (2004) Picardi, I., Chieffi, A., Limongi, M., Pisanti, O., Miele, G., Mangano, G., & Imbriani, G. 2004, ApJ, 609, 1035
- Pinsonneault et al. (1999) Pinsonneault, M. H., Walker, T. P., Steigman, G., & Narayanan, V. K. 1999, ApJ, 527, 180
- Plez & Cohen (2005) Plez, B., & Cohen, J. G. 2005, A&A, 434, 1117
- Prantzos et al. (1990) Prantzos, N., Hashimoto, M., & Nomoto, K. 1990, A&A, 234, 211
- Ramírez & Meléndez (2004) Ramírez, I., & Meléndez, J. 2004, ApJ, 609, 417
- Ryan et al. (2002) Ryan, S. G., Gregory, S. G., Kolb, U., Beers, T. C., & Kajino, T. 2002, ApJ, 571, 501
- Ryan et al. (1999) Ryan, S. G., Norris, J. E., & Beers, T. C. 1999, ApJ, 523, 654
- Schlegel et al. (1998) Schlegel, D. J., Finkbeiner, D. P., & Davis, M. 1998, ApJ, 500, 525
- Shigeyama et al. (2003) Shigeyama, T., Tsujimoto, T., & Yoshii, Y. 2003, ApJ, 586, L57
- Shortridge (1993) Shortridge, K. 1993, in ASP Conf. Ser. 52: Astronomical Data Analysis Software and Systems II, 219
- Sneden et al. (2003) Sneden, C., et al. 2003, ApJ, 591, 936
- Spergel et al. (2003) Spergel, et al. 2003, ApJS, 148, 175
- Spite et al. (2005) Spite, M., et al. 2005, A&A, 430, 655
- Stehlé & Hutcheon (1999) Stehlé, C., & Hutcheon, R. 1999, A&AS, 140, 93
- Suda et al. (2004) Suda, T., Aikawa, M., Machida, M. N., Fujimoto, M. Y., & Iben, I. J. 2004, ApJ, 611, 476
- Surman & McLaughlin (2005) Surman, R., McLaughlin, G. C. 2005, ApJ, 618, 397
- Takeda et al. (2003) Takeda, Y., Zhao, G., Takada-Hidai, M., Chen, Y.-Q., Saito, Y.-J., & Zhang, H.-W. 2003, ChJAA, 3, 316
- Thévenin & Idiart (1999) Thévenin, F., & Idiart, T. P. 1999, ApJ, 521, 753
- Travaglio et al. (2004) Travaglio, C., Gallino, R., Arnone, E., Cowan, J., Jordan, F., & Sneden, C. 2004, ApJ, 601, 864
- Truran et al. (2002) Truran, J. W., Cowan, J. J., Pilachowski, C. A., & Sneden, C. 2002, PASP, 114, 1293
- Tsujimoto & Shigeyama (2003) Tsujimoto, T., & Shigeyama, T. 2003, ApJ, 584, L87
- Tsujimoto et al. (1999) Tsujimoto, T., Shigeyama, T., & Yoshii, Y. 1999, ApJ, 519, L63
- Umeda & Nomoto (2003) Umeda, H., & Nomoto, K. 2003, Nature, 422, 871
- Umeda & Nomoto (2005) Umeda, H., & Nomoto, K. 2005, ApJ, 619, 427
- Vidal et al. (1973) Vidal, C. R., Cooper, J., & Smith, E. W. 1973, ApJS, 25, 37
- Wanajo & Ishimaru (2005) Wanajo, S., & Ishimaru, Y. 2005, ASP Conf. Ser., IAU symposium 228, From Lithium to Uranium: Elemental tracers of early cosmic evolution, in press
- Weiss et al. (2004) Weiss, A. R., Schlattl, H., Salaris, M., & Cassisi, S. 2004, A&A, 422, 217
- Wiese & Martin (1980) Wiese, W. L., & Martin, G. A. 1980, NSRDS-NBS, 68
- Wisotzki et al. (2000) Wisotzki, L., Christlieb, N., Bade, N., Beckmann, V., Köhler, T., Vanelle, C., & Reimers, D. 2000, A&A, 358, 77
- Yoshii (1981) Yoshii, Y. 1981, A&A, 97, 280
- Yoshii et al. (2003) Yoshii, Y., Kobayashi, Y., & Minezaki, T. 2003, BAAS, 202, 38.03
- Zachwieja (1995) Zachwieja, M. 1995, J. Mol. Spectrosc., 170, 285
- Zachwieja (1997) —. 1997, J. Mol. Spectrosc., 182, 18
| Target | UTaaAt beginning of observation | Setting | Notes | ||
|---|---|---|---|---|---|
| (min) | km s-1 | ||||
| HE 13272326 | 2004 May 30, 7:04 | 4030–6800 Å | 30 | Close to the moon | |
| HE 13272326 | 2004 May 31, 6:17 | 4030–6800 Å | 150 | 63.88 | Used for abundance analysis |
| HE 13272326 | 2004 June 2, 5:43 | 3550–5250 Å | 240 | 63.50 | Used for abundance analysis |
| HE 13272326 | 2004 June 27, 6:03 | 3000–4600 Å | 150 | 63.64 | Used for abundance analysis |
| HE 13272326 | 2005 Feb. 27, 12:48 | 4030–6800 Å | 30 | 63.62 | |
| HE 13272326 | 2005 June 17, 5:46 | 4030–6800 Å | 15 | 63.45 | |
| G 6412 | 2004 June 2, 9:52 | 3550–5250 Å | 20 | 443.84 | HE 13370012 |
| G 6412 | 2004 June 27, 8:42 | 3000–4600 Å | 60 | 443.67 | HE 13370012 |
| W.A. | A.F. | Adopted | ||||||
|---|---|---|---|---|---|---|---|---|
| Ion | (Å) | (eV) | (dex) | (mÅ) | (mÅ) | (mÅ) | (mÅ) | Refs. |
| Na I | 1 | |||||||
| Na I | 1 | |||||||
| Mg I | 1 | |||||||
| Mg I | 1 | |||||||
| Mg I | 1 | |||||||
| Mg I | 1 | |||||||
| Al I | 2 | |||||||
| Ca I | 2 | |||||||
| Ca II | 1 | |||||||
| Ti II | 1 | |||||||
| Ti II | 1 | |||||||
| Ti II | 3 | |||||||
| Ti II | 3 | |||||||
| Fe I | 4 | |||||||
| Fe I | 4 | |||||||
| Fe I | 4 | |||||||
| Fe I | 4 | |||||||
| Fe I | 4 | |||||||
| Fe I | 5 | |||||||
| Fe I | 4 | |||||||
| Sr II | 6 | |||||||
| Sr II | 6 | |||||||
| Cr I | 3 | |||||||
| Mn I | 3 | |||||||
| Fe II | 4 | |||||||
| Co I | 4 | |||||||
| Ni I | 7 | |||||||
| Zn I | 8 | |||||||
| Ba II | 1 | |||||||
| HE 13272326 | G 6412 | |||||||
|---|---|---|---|---|---|---|---|---|
| Wλ | FWHM | (km s-1) | Wλ | FWHM | ||||
| mÅ | km s-1 | dwarf | subgiant | mÅ | km s-1 | km s-1 | ||
| Mg I 5172 Å | 22.3 | 9.45 | 6.22 | 6.31 | 78.6 | 9.62 | 4.65 | |
| Mg I 5183 Å | 30.5 | 8.91 | 5.43 | 5.52 | 92.8 | 10.07 | 4.56 | |
| Component | WaaA total equivalent width of 179.5 m Å is measured from a direct integration between 3932.27 and 3933.40 Å. | Remark | Corresponding | ||||||
|---|---|---|---|---|---|---|---|---|---|
| (cm-2) | (km/s) | (km/s) | (m Å) | Na I D component | |||||
| 1 | 11.6593 | 0.0620 | 33.2 | 0.6 | 3.40 | 0.77 | 38.8 | Gaussian fitting | 1 |
| 2 | 11.4444 | 0.1431 | 26.3 | 0.9 | 3.48 | 0.60 | 19.1 | Direct integral | 2 |
| 3 | 11.5587 | 0.0540 | 17.6 | 0.3 | 3.44 | 0.55 | 32.6 | Gaussian fitting | 3 |
| 4 | 10.9804 | 0.5561 | 8.9 | 2.7 | 4.72 | 5.63 | 17.4 | Direct integral for component 4 and 5 | 4 |
| 5 | 11.3510 | 0.4160 | 1.3 | 1.8 | 6.06 | 4.74 | 5 | ||
| 6 | 11.8168 | 0.0917 | 11.2 | 0.9 | 6.21 | 0.28 | 64.2 | Gaussian fitting | 5 |
| 7 | 11.0830 | 0.0258 | 29.8 | 0.3 | 3.92 | 0.37 | 11.6 | Gaussian fitting | 6+7 |
| Component | aaThe velocity was measured with a simultaneous fitting for both lines. | WD2bbA total equivalent width of 312.8 m Å is measured from a direct integration between 5888.35 and 5889.54 Å(features 1–5) and between 5887.88 and 5888.27 Å(features 6–7). | WD1 | Remark | Corresponding | |||||
|---|---|---|---|---|---|---|---|---|---|---|
| (cm-2) | (km/s) | (km/s) | (m Å) | Ca II K component | ||||||
| 1 | 11.8212 | 0.1493 | 32.6 | 0.6 | 2.80 | 0.93 | 108.3 | 79.9 | Direct integral for compoment 1 and 2 | 1 |
| 2 | 11.3985 | 0.6202 | 26.6 | 3.9 | 4.76 | 5.21 | 2 | |||
| 3 | 11.5795 | 0.1426 | 17.6 | 0.9 | 2.85 | 0.56 | 61.4 | 39.2 | Gaussian fitting | 3 |
| 4 | 10.8796 | 0.1873 | 8.6 | 1.8 | 3.79 | 2.00 | 14.5 | 13.1 | Gaussian fitting | 4 |
| 5 | 11.9590 | 0.0140 | 7.0 | 0.0 | 4.72 | 0.20 | 128.3 | 77.1 | Direct integral | 5+6 |
| 6 | 10.4562 | 1.2197 | 27.4 | 8.1 | 2.67 | 13.56 | 5.7 | 3.6 | Gaussian fitting for D2 ccA direct integral was applied to the component 6 and 7 of the D1 line. | 7 |
| 7 | 10.8254 | 0.5790 | 34.6 | 5.4 | 3.91 | 2.77 | 14.6 | Gaussian fitting for D2 ccA direct integral was applied to the component 6 and 7 of the D1 line. | 7 | |
| Star | (mag) | (mag) | (mag) | (mag) | (mag) | (mag) | (mag) | (mag) |
|---|---|---|---|---|---|---|---|---|
| HE 13272326aa measurements obtained differentially to G 6412 with the MAGNUM telescope. measurements are from 2MASS. These values were used to estimate the effective temperature. | 13.787 | 14.016 | 13.535 | 13.211 | 12.854 | 12.357 | 12.068 | 11.986 |
| 0.007 | 0.005 | 0.004 | 0.003 | 0.003 | 0.023 | 0.023 | 0.021 | |
| HE 13272326bb measurements with the WIYN telescope. | 14.01 | 13.53 | 13.20 | |||||
| 0.04 | 0.02 | 0.06 | ||||||
| HE 13272326cc measurements with the CTIO telescope. | 13.761 | 13.966 | 13.526 | 13.156 | 12.803 | |||
| 0.019 | 0.008 | 0.018 | 0.013 | 0.021 | ||||
| G 6412dd is from Landolt (1992); from 2MASS. | 11.601 | 11.838 | 11.453 | 11.186 | 10.893 | 10.509 | 10.268 | 10.208 |
| 0.0044 | 0.0034 | 0.0016 | 0.0021 | 0.0022 | 0.024 | 0.023 | 0.021 | |
| G 6412cc measurements with the CTIO telescope. | 11.599 | 11.769 | 11.442 | 11.156 | 10.859 | |||
| 0.021 | 0.015 | 0.009 | 0.006 | 0.007 |
| Value | Derived | ||||||
|---|---|---|---|---|---|---|---|
| Measured | HE 13272326 | G 6412 | HE 13272326 | G 6412 | |||
| quantity | (K) | (K) | (K) | Notes | |||
| H–H | STEHLEBPO; aaComputations of Stark broadening by Stehlé & Hutcheon (1999) and self-broadening by Barklem et al. (2000) were employed for the analysis. The values for HE 13272326 and G 6412 adopted in this analysis are given. | ||||||
| H–H | STEHLEBPO; aaComputations of Stark broadening by Stehlé & Hutcheon (1999) and self-broadening by Barklem et al. (2000) were employed for the analysis. The values for HE 13272326 and G 6412 adopted in this analysis are given. | ||||||
| H–H | VCSAG; bbKorn (2004; private communication). Computations of Stark broadening by Vidal et al. (1973) and self-broadening by Ali & Griem (1966) were employed for the analysis. The value for HE 13272326 adopted in this analysis is given. | ||||||
| HP2 | Å | Å | Ryan et al. (1999) | ||||
| HP2 | Å | Å | Beers et al. (2005, in preparation) | ||||
| 0.403 mag | 0.357 mag | Alonso et al. (1996) ccIsraelian et al. (2004); | |||||
| 0.413 mag | 0.376 mag | Alonso et al. (1996) ccIsraelian et al. (2004); | |||||
| 0.726 mag | 0.658 mag | Alonso et al. (1996) ccIsraelian et al. (2004); | |||||
| 1.323 mag | 1.166 mag | Alonso et al. (1996) ccIsraelian et al. (2004); | |||||
| Average | |||||||
| Parameter | HE 13272326 | G 6412 | |
|---|---|---|---|
| Subgiant | Dwarf | ||
| K | K | 6390 K | |
| (cgs) | 4.38 | ||
| [Fe/H] | |||
| km s-1 | km s-1 | km s-1 | |
| HE 13272326 | G 6412 | |||||||||||||||||
|---|---|---|---|---|---|---|---|---|---|---|---|---|---|---|---|---|---|---|
| Subgiant | Dwarf | |||||||||||||||||
| El. | Ion | [X/H] | [X/Fe] | aaFrebel et al. (2005) | [X/H] | [X/Fe] | aaFrebel et al. (2005) | [X/H] | [X/Fe] | Notes | ||||||||
| C | CH | 3 | 6.90 | 6.64 | 5.68bbTheir calibration scale for was used. | Synth. of CH | ||||||||||||
| N | NH | 1 | 6.68 | 6.36 | 6.15ccIsraelian et al. (2004); | Synth. of NH | ||||||||||||
| O | OH | 1 | 6.34bbNear infrared measurements by Akerman et al. (2004); | Synth. of OH | ||||||||||||||
| Li | 1 | 1 | 1 | 2.30ddAoki et al. (2005, in preparation) | Synthesis | |||||||||||||
| Na | 1 | 2 | 2.92 | 2.95 | 1 | 2.10ddAoki et al. (2005, in preparation) | ||||||||||||
| 2.72 | 2.75 | 1.90 | non-LTE: | |||||||||||||||
| Mg | 1 | 4 | 3.57 | 3.57 | 5 | |||||||||||||
| 3.67 | 3.67 | non-LTE: | ||||||||||||||||
| Al | 1 | 1 | 2.05 | 2.01 | 1 | |||||||||||||
| 2.65 | 2.61 | non-LTE: | ||||||||||||||||
| Ca | 2 | 1 | 1.57 | 1.45 | ||||||||||||||
| Ca | 1 | 1 | 0.95 | 0.94 | 6 | |||||||||||||
| Ti | 2 | 2 | 0.03 | 58 | ||||||||||||||
| Fe | 1 | 4 | 1.83 | 1.80 | 59 | |||||||||||||
| Fe | 1 | 4 | 2.03 | 2.00 | non-LTE: | |||||||||||||
| Sr | 2 | 2 | 2 | |||||||||||||||
| Sr | 2 | 2 | 2 | non-LTE: | ||||||||||||||
| Cr | 1 | 3 | ||||||||||||||||
| Mn | 1 | 3 | ||||||||||||||||
| Fe | 2 | 3 | ||||||||||||||||
| Co | 1 | 12 | ||||||||||||||||
| Ni | 1 | 24 | ||||||||||||||||
| Zn | 1 | |||||||||||||||||
| Ba | 2 | 1 | 2 | |||||||||||||||
| Ba | 2 | 1 | 2 | non-LTE: | ||||||||||||||
| Species | random | r.s.s. | |||
|---|---|---|---|---|---|
| +100 K | +0.3 dex | +0.3 km s-1 | |||
| C (CH) | 0.1 | 0.20 | -0.10 | 0.00 | 0.24 |
| N (NH) | 0.2 | 0.20 | -0.10 | 0.00 | 0.30 |
| Na I | 0.04 | 0.07 | -0.01 | -0.02 | 0.08 |
| Mg I | 0.02 | 0.06 | 0.00 | -0.01 | 0.07 |
| Al I | 0.03 | 0.08 | 0.00 | -0.01 | 0.09 |
| Ca I | 0.15 | 0.08 | 0.00 | 0.00 | 0.17 |
| Ti II | 0.17 | 0.07 | 0.08 | -0.01 | 0.20 |
| Fe I | 0.11 | 0.10 | 0.00 | 0.00 | 0.15 |
| Sr II | 0.06 | 0.06 | 0.09 | 0.00 | 0.13 |