The Knotty Question of the Jet of PKS B1421-490
Abstract
We report the discovery of unusually strong optical and X-ray emission associated with a knot in the radio jet of PKS B1421-490. The knot is the brightest feature observed beyond the radio band, with knot/core flux ratios 300 and 3.7 at optical and X-ray frequencies. We interpret the extreme optical output of the knot as synchrotron emission. The nature of the X-ray emission is unclear. We consider a second synchrotron component, inverse Compton emission from a relativistic, decelerating jet, and the possibility that this feature is a chance superposition of an unusual BL Lac object.
Subject headings:
galaxies: jets — quasars: individual (PKS B1421-490 (catalog ))1. Introduction
We have observed PKS B1421-490 (Ekers, 1969) as part of our Chandra survey of flat-spectrum radio sources with extended structure (Marshall et al., 2005). A component at , –49°13′500 (J2000.0) accounts for 93% of the 8.6 GHz flux density; the remaining emission extends 12″ to the south west (Lovell, 1997). Gelbord & Marshall (2005) discovered an optical counterpart with at the position of the radio peak. We estimate the redshift to be by comparing the and colors (0.46 and 0.30, respectively, after dereddening) with a sample of SDSS quasars (Richards et al., 2002). An exceptionally bright optical feature () is coincident with a weak component in the extended radio structure 59 from the radio peak. Here we discuss this enigmatic feature in detail.
We adopt , , , and , such that 1″ corresponds to 8.0 kpc at the source. We define the power law spectral index by . All uncertainties are 1- and limits are 2-.
2. Observations
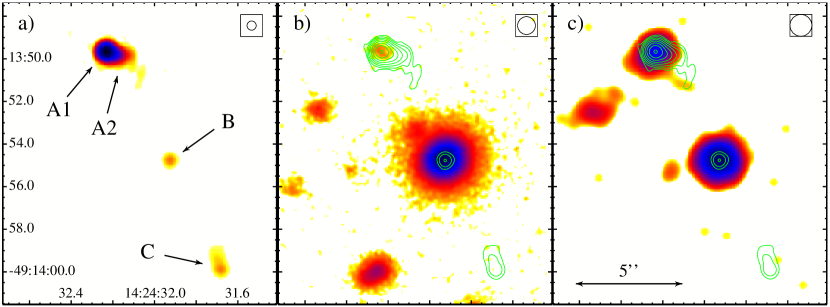
We observed PKS B1421-490 with the Australia Telescope Compact Array (ATCA) at 4.86 and 8.64 GHz on 2002 February 4 and at 17.73 and 20.16 GHz on 2004 May 9. The Magellan Instant Camera (MagIC) was used for imaging in the SDSS , , and filters on 2003 April 26–27, and the Inamori Magellan Areal Camera and Spectrograph (IMACS) was used to obtain a spectrum spanning 4100–7250 Å during twilight on 2004 February 27. X-ray data were obtained on 2004 January 16 using the Chandra ACIS-S CCD. Imaging data are presented in Fig. 1 and flux density () measurements in Tab. 1.
| Frequency | aaAt 18 and 20 GHz, region A is resolved into A1 and A2. The tabulated flux densities refer to A1; and 550 mJy at 18 and 20 GHz, respectively. At other frequencies the values blend regions A1 and A2. | ||
|---|---|---|---|
| (Hz) | (mJy) | (mJy) | (mJy) |
The radio structure exhibits three main emitting regions (A, B, C on Fig. 1a) spanning 12″ along position angle east of north. The 18 and 20 GHz maps resolve region A into a point source and a jet-like extension (A1 and A2, respectively). A2 has FWHM of 056 by 016, extending westward from A1 (°) before bending toward regions B and C. (Hereafter, unless A1 or A2 are specified, “region A” will refer to blends or the explicit sum of these two subregions.) At 2.3 GHz Preston et al. (1989) report that A1 contains two VLBI components with 30 mas diameters separated by 55 mas roughly along the direction to A2. An 8.425 GHz VLBI snapshot taken with the Long Baseline Array (LBA) on 2004 April 16 shows a 20 mas jet with °, but formally sets an upper limit of 24 mas on the size of this feature within A1, with Jy. A1 has a flatter radio spectrum than A2. Since it includes some extended flux from the base of A2 and certainly blends the VLBI structures, there is likely to be a component within A1 with a flat or inverted radio spectrum.
Region B lies 59 from A1 in . It is the weakest of the labeled radio features, with only 0.4% of the overall flux density of region A at 20 GHz. The 18 and 20 GHz data show it to be resolved (the deconvolved FWHM is by with the major axis in deg.). At 4.8 GHz C is sufficiently extended to contaminate region B.
Region C is well resolved, reaching its peak brightness at its southernmost end, 115 from A1 at . It has a steep spectrum ( between 8.6 and 20 GHz), in contrast to the flat spectra of A and B ( and ).
Above Hz (Fig. 1b & c), B is the brightest component and C is undetected. The / flux ratios are 3.7 in the X-ray band and 300 in the optical, contrasting with at 8.6 GHz. Both A and B are unresolved, with FWHM upper limits of at Hz, and and (respectively) at Hz. The spectral energy distribution (SED) of A appears to steepen in the optical band (), while that of B remains flat (). Details of the optical data are given by Gelbord & Marshall (2005).
The X-ray spectra of components A and B are both well described by absorbed power laws. We use the maximum likelihood method to fit models to the 0.5–7.0 keV spectra. For component B we find and a neutral gas column of , consistent with the predicted from Galactic H I measurements (; Dickey & Lockman, 1990). For region A we obtain after fixing .
An unidentified optical and X-ray source (CXOU J142432.5-491352) lies 41 SE of A1. It has flux densities of , , and Jy in the , , and bands, respectively, and nJy at 1 keV. The density of background X-ray sources at least this bright (, assuming and Galactic ) is about 100 per square degree (Rosati et al., 2002; Moretti et al., 2003), so the likelihood of finding one within 10″ of at least one of our 30 survey targets observed to date is 7%. The low Galactic latitude of 1421-490 () increases the likelihood that this is an unrelated source. A weak optical source lies NE of B (, , and with no extinction correction). It lacks any radio or X-ray counterpart and is consistent with a point source, hence is likely to be a foreground star in this crowded field. We do not discuss either object further.
3. Deciphering the morphology
We suggest that region C is a terminal hot spot due to its extended radio structure and steep spectrum. The knotty question is whether we have a core at A with a one-sided jet extending through B to C or a symmetric system with a core at B between hot spots at A and C. The radio spectral indices do not provide guidance because both A and B have flat spectra typical of self-absorbed quasar cores. The detection of a compact, high brightness temperature VLBI source with apparent core-jet morphology coincident with A1 is suggestive but not conclusive: a hot spot could contain a compact component, although it would be exceptional for it to have core-jet structure and to provide so much (35%) of the 8.5 GHz flux density. The lack of a VLBI source at B is likewise not significant because B would not have been detected by extant observations. For now we adopt the one-sided jet scenario, guided by the VLBI source at A1. This choice may need to be reconsidered as new data become available. However, we note that , consistent with a core/inner jet interpretation.
One other possibility warrants consideration: that A and B are cores in separate systems. In comparison with other jet knot-core pairs, the B/A X-ray flux ratio is atypical and the optical ratio unprecedented. Given that X-ray sources with have a density of 1.0 per square degree (Moretti et al., 2003), the chance of finding such a source 10″ from any of the systems so far observed in our jet survey is if we neglect the possibility of clustering. Thus it is unlikely that A and B are unrelated.
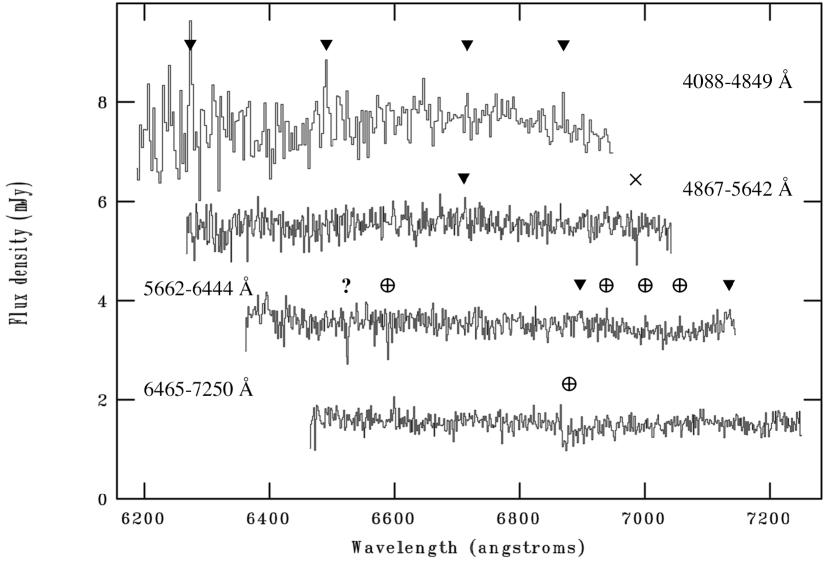
We obtained an optical spectrum (Fig. 2) to test whether B is an interloper. Only one tentative feature, an absorption line at 5825Å, exceeds the local RMS. A redshift limit of is required by the absence of a Lyman forest at Å. The lack of strong spectral features rules out identification with common objects such as normal stars, galaxies and most types of AGN, and is consistent with non-thermal emission from a jet knot. The only remaining candidates are DC white dwarfs (WDs) and BL Lac objects. The former can be dismissed immediately as these cool WDs are neither radio nor X-ray sources and are generally bluer (, Kleinman et al., 2004, e.g.,, whereas B has ). Moreover, photographic plates from the Yale/San Juan Southern Proper Motion survey (SPM; Girard et al., 2004) limit the proper motion of B to 8 mas yr-1 (D. I. Dinescu 2004, private communication); with a distance 150 pc (based upon the brightest known DC WDs; McCook & Sion, 1999) the tangential motion is limited to whereas WDs typically have (Sion et al., 1988).
If B is a BL Lac, then it is highly unusual. Its index is typical of X-ray-selected BL Lacs, but and ( and , respectively111Evaluated with the upper limit at 4.8 GHz and extrapolated values at 2500 Å and 2 keV to facilitate comparison with Rector et al., 2000.) are exceptional, making B an outlier when compared to published samples (Worrall et al., 1999; Rector et al., 2000; Landt et al., 2001). However, other methods of selection may broaden the distribution of indices— e.g., the optically-selected, radio-quiet BL Lac candidate discovered by Londish et al. (2004). BL Lac objects typically vary in the optical by a magnitude or more on time scales of years, but catalogs and archival data222The USNO-A2.0 (Monet et al., 1998), USNO-B1.0 (Monet et al., 2003) and HST GSC 2.2 (http://www-gsss.stsci.edu/gsc/GSChome.htm) catalogs, and the SPM survey (D. I. Dinescu 2004, private communication). show over 35 yr and on time scales up to 27 yr. Finally, BL Lacs with comparable X-ray fluxes are rare: the chance of having one within 10″ of any of our 30 Chandra targets is (Wolter et al., 1991; Krautter et al., 1999; Henry et al., 2001); finding one aligned with a radio jet is even less likely. Thus, while we cannot completely rule out a BL Lac interloper, we favor an association of B with PKS B1421-490.
The multiwavelength properties of feature B are unlike those of any other known jet knot. Its optical apparent magnitude is second only to knot HST-1 of M87 despite lying at a much greater distance. HST-1 has a comparable X-ray / ratio, but its optical ratio is 3, compared to 300 for knot B (Marshall et al., 2002; Harris et al., 2003).
4. Interpreting the spectra


The core SED can be modeled as emission from the parsec-scale base of the jet. The spectral index of A1 between 17.7 and 20.2 GHz is 0.5, roughly consistent with strong-shock acceleration models. A synchrotron self-Compton (SSC) model with an equipartition magnetic field () is plausible for the core as long as there is relativistic boosting towards the observer. For example, Fig. 3 shows a model of a jet with bulk motion of at 2.9° to the line of sight, radius 0.5 mas (4 pc), electron number spectrum index , , , and an energy-loss break by 1.0 at . Such a model gives a reasonable description of the SED with mG. Without relativistic beaming SSC models with predict an X-ray flux higher.
For region B we also use synchrotron emission to model the radio-to-optical flux. The flat spectrum and apparent turn-over at low radio frequencies might suggest self-absorption in a series of small-scale components. This is often the case in cores but not large-scale jets. While there could be a self-absorbed region within the kpc-scale knot if the magnetic field is sufficiently high (mG), we prefer instead an optically thin model. Without beaming, a model consisting of a sphere of radius 005 (0.4 kpc), with mG, , , , and , yields a reasonable fit (Fig. 3), although it violates the limit and it is difficult to reproduce unless above . An unusually high () would provide a better compromise between the flat 8.6–20 GHz radio spectrum and the low 4.8 GHz flux density, although the physical mechanism would be uncertain; would be little changed. The flatness of the optical spectrum suggests that the electron distribution would be better modelled as multiple components with a distribution of values. The radiative lifetime of the optically-emitting electrons is only of order 40 years, implying distributed electron acceleration across the knot. Smaller electron Lorentz factors apply if the source size is reduced.
The greater difficulty is to explain the X-ray emission. Unlike the core, the relatively larger angular size and lower radio luminosity of the knot means that SSC is not effective unless most of the radio emission is from embedded regions smaller than we adopt for the core. The observed flux is too low to be a simple continuation of the optical synchrotron and too flat to be the plunging high-energy tail of this component. Synchrotron X-ray emission requires a second population of electrons extending to with . The resulting emission extrapolates well below the fluxes measured at lower frequencies, thus is unconstrained. In situ acceleration is required to sustain this population as the cooling time is much shorter than the light-crossing time of the region.
Inverse Compton (IC) models likewise have problems reproducing the knot X-ray emission. IC scattering of the cosmic microwave background (IC-CMB; Tavecchio et al., 2000; Celotti, Ghisellini, & Chiaberge, 2001) for requires a bulk Lorentz factor to boost the X-ray output by 8 orders of magnitude. This is inconsistent with our expectation that the knot should be less boosted than the core, especially after a bend in the jet as between A2 and B. A higher assumed redshift would ease this constraint, since (Harris & Krawczynski, 2002), but even at we require . This limit could be reduced to if magnetic fields significantly below are considered.
A decelerating jet model (Georganopoulos & Kazanas, 2003) with a lower and can provide a qualitatively correct SED. A , mG flow oriented 2.9° from our line of sight that decelerates to semi-relativistic velocities within the kpc volume of knot B reproduces the optical flux with a strongly Doppler-boosted synchrotron peak and provides X-rays through IC scattering of photons from the slowed, downstream portion of the jet.
Both IC models require abundant electrons to produce X-rays. These electrons can be in a second population (this time at low energies), or part of the synchrotron-emitting population if is much lower than the assumed value of . A low would require the knot to contain unusually compact, self-absorbed sub-regions to avoid producing an order of magnitude more radio flux than observed.
5. Conclusions
We have chosen to interpret PKS B1421-490 as a flat spectrum radio source with a one-sided jet and a unique knot at B. The optically-dominated spectral energy distribution of feature B can be explained by two models. Both invoke a synchrotron component for the radio-to-optical continuum, but one attributes the X-ray flux to synchrotron emission from a second electron population while the other involves inverse Compton scattering by a relativistic, decelerating jet. Alternative interpretations that currently cannot be ruled out include a symmetric system with a core at B and knots at A and C, and either an interaction, or a chance alignment, of PKS B1421-490 and an unrelated (and unusual) optically-dominated, radio-quiet BL Lac.
Deeper optical spectroscopy is urgently needed to measure the redshift of A and provide a high S/N spectrum to better identify B. Observations in the mm, sub-mm, IR and far-UV bands would fill in the SED, thereby providing strong constraints for models of the emission processes. Feature B is a good target for optical polarimetry, which could help confirm whether it is dominated by synchrotron jet emission. Finally, we look forward to an upcoming long Chandra observation that will allow a more detailed X-ray study and a deep VLBI mapping that will test the core-jet structure at A1 and possibly identify compact emission regions within B.
References
- Celotti et al. (2001) Celotti, A., Ghisellini, G., & Chiaberge, M. 2001, MNRAS, 321, L1
- Cutri et al. (2003) Cutri, R. M., et al. 2003, VizieR Online Data Catalog, 2246, 0, (2MASS All-Sky Catalog)
- Dickey & Lockman (1990) Dickey, J. M., & Lockman, F. J. 1990, ARA&A, 28, 215
- Ekers (1969) Ekers, J. A. 1969, Au. J. of Phys. Astrophys. Supp., 7, 3
- Gelbord & Marshall (2005) Gelbord, J. M., & Marshall, H. L. 2005, in prep.
- Georganopoulos & Kazanas (2003) Georganopoulos, M., & Kazanas, D. 2003, ApJ, 589, L5
- Girard et al. (2004) Girard, T. M., Dinescu, D. I., van Altena, W. F., Platais, I., Monet, D. G., & López, C. E. 2004, AJ, 127, 3060
- Harris et al. (2003) Harris, D. E., Biretta, J. A., Junor, W., Perlman, E. S., Sparks, W. B., & Wilson, A. S. 2003, ApJ, 586, L41
- Harris & Krawczynski (2002) Harris, D. E., & Krawczynski, H. 2002, ApJ, 565, 244
- Henry et al. (2001) Henry, J. P., Gioia, I. M., Mullis, C. R., Voges, W., Briel, U. G., Böhringer, H., & Huchra, J. P. 2001, ApJ, 553, L109
- Kleinman et al. (2004) Kleinman, S. J., et al. 2004, ApJ, 607, 426
- Krautter et al. (1999) Krautter, J., et al. 1999, A&A, 350, 743
- Landt et al. (2001) Landt, H., Padovani, P., Perlman, E. S., Giommi, P., Bignall, H., & Tzioumis, A. 2001, MNRAS, 323, 757
- Londish et al. (2004) Londish, D., Heidt, J., Boyle, B. J., Croom, S. M., & Kedziora-Chudczer, L. 2004, MNRAS, 352, 903
- Lovell (1997) Lovell, J. E. J. 1997, PhD thesis, University of Tasmania
- Marshall et al. (2002) Marshall, H. L., Miller, B. P., Davis, D. S., Perlman, E. S., Wise, M., Canizares, C. R., & Harris, D. E. 2002, ApJ, 564, 683
- Marshall et al. (2005) Marshall, H. L., et al. 2005, ApJS, 156, 13
- McCook & Sion (1999) McCook, G. P., & Sion, E. M. 1999, ApJS, 121, 1
- Monet et al. (1998) Monet, D. B. A., et al. 1998, The USNO-A2.0 Catalogue (Washington, DC: U.S. Naval Observatory)
- Monet et al. (2003) Monet, D. G., et al. 2003, AJ, 125, 984
- Moretti et al. (2003) Moretti, A., Campana, S., Lazzati, D., & Tagliaferri, G. 2003, ApJ, 588, 696
- Preston et al. (1989) Preston, R. A., et al. 1989, AJ, 98, 1
- Rector et al. (2000) Rector, T. A., Stocke, J. T., Perlman, E. S., Morris, S. L., & Gioia, I. M. 2000, AJ, 120, 1626
- Richards et al. (2002) Richards, G. T., et al. 2002, AJ, 123, 2945
- Rosati et al. (2002) Rosati, P., et al. 2002, ApJ, 566, 667
- Schlegel et al. (1998) Schlegel, D. J., Finkbeiner, D. P., & Davis, M. 1998, ApJ, 500, 525
- Sion et al. (1988) Sion, E. M., Fritz, M. L., McMullin, J. P., & Lallo, M. D. 1988, AJ, 96, 251
- Tavecchio et al. (2000) Tavecchio, F., Maraschi, L., Sambruna, R. M., & Urry, C. M. 2000, ApJ, 544, L23
- Wolter et al. (1991) Wolter, A., Gioia, I. M., Maccacaro, T., Morris, S. L., & Stocke, J. T. 1991, ApJ, 369, 314
- Worrall et al. (1999) Worrall, D. M., Birkinshaw, M., Remillard, R. A., Prestwich, A., Tucker, W. H., & Tananbaum, H. 1999, ApJ, 516, 163