Chandra and Hubble Study of a New Transient X-ray Source in M31
Abstract
We present X-ray and optical observations of a new transient X-ray source in M31 first detected 23-May-2004 at R.A.=00:43:09.940 , Dec.=41:23:32.49 . The X-ray lightcurve shows two peaks separated by several months, reminiscent of many Galactic X-ray novae. The location and X-ray spectrum of the source suggest it is a low mass X-ray binary (LMXB). Follow-up HST ACS observations of the location both during and after the outburst provide a high-confidence detection of variability for one star within the X-ray position error ellipse. This star has mag, and there is only a 1% chance of finding such a variable in the error ellipse. We consider this star a good candidate for the optical counterpart of the X-ray source. The luminosity of this candidate provides a prediction for the orbital period of the system of 2.3 days.
1 Introduction
X-ray and optical investigations of bright transient Galactic low-mass X-ray binaries (LMXBs), known as X-ray novae (XRNe), have shown these sources to be some of the best stellar-mass black hole candidates known (McClintock & Remillard, 2004, and references therein). During outburst, some of these objects are bright enough in X-rays ( erg s-1) to be easily detected in nearby galaxies, and each new X-ray transient source found is a potential gem for studies of black hole and accretion physics.
Over the past several years, we have undertaken a monitoring program of the nearby spiral galaxy M31 to search for new transient X-ray sources with Chandra and HST. Through this program, and the searches done by other groups using XMM-Newton, dozens of new transient sources have been found (e.g. Williams et al., 2004; Di Stefano et al., 2004; Kong et al., 2002; Trudolyubov et al., 2001; Osborne et al., 2001; Williams et al. in preparation).
While the discovery of new XRN candidates is exciting, most of the X-ray transient sources detected in M31 so far have no known optical counterparts, making their classification and orbital parameters difficult to constrain. Our coordinated HST program has provided several of the first optical counterpart candidates for these transient X-ray sources, likely to be XRNe (Williams et al., 2005a, b, c, 2004). Knowledge of the optical counterparts begins the process of constraining the orbital periods of the binaries. As more X-ray/optical systems are found, we will be able to study the orbital period distribution for XRNe in M31. This distribution is one of the fundamental observable parameters for this class of objects that any viable model of their evolution must be able to reproduce.
This paper describes our discovery and follow-up study of a new transient X-ray source in M31 detected by Chandra in observations spanning from 23-May-2004 through 04-Oct-2004. In addition, we describe our efforts to determine the optical counterpart of the source using HST. Section 2 describes the data obtained and the methods used to process them. Section 3 provides our results. Section 4 discusses the implications of the results, including a prediction of the orbital period of the LMXB, and §5 gives our conclusions.
2 Data
2.1 X-ray
We obtained six observations with the Chandra ACIS-I between December 2003 and December 2004 relevant to this study. The observation identification numbers, dates, pointings, roll angles, and exposure times of these observations are given in Table 1. Although the observations were taken for 5 ks each, the effective exposure was reduced by 20% because the data were taken in “alternating readout mode” in order to avoid pileup for any bright transient source.
These observations were all reduced using the software package CIAO v3.1 with the CALDB v2.28. We created exposure maps for the images using the task merge_all,111http://cxc.harvard.edu/ciao/ahelp/merge_all.html and we found and measured positions and fluxes of the sources in the images using the CIAO task wavdetect.222http://cxc.harvard.edu/ciao3.0/download/doc/detect_html_manual/Manual.html Each data set detected sources down to (0.3–10 keV) fluxes of 610-6 photons cm-2 s-1 or 0.3–10 keV luminosities of 1036 erg s-1 for a typical X-ray binary system in M31.
We aligned the coordinate system of the X-ray images with the optical images of the Local Group Survey (LGS; Massey et al., 2001). The positions of X-ray sources with known globular cluster counterparts were aligned with the globular cluster centers in the LGS images using the IRAF333IRAF is distributed by the National Optical Astronomy Observatory, which is operated by the Association of Universities for Research in Astronomy, Inc., under cooperative agreement with the National Science Foundation. task ccmap. The errors of this alignment were typically 0.1′′. The precise alignment errors for the observations used to determine the X-ray error circle are given in Table 3.
We checked the positions of all of the sources we detected in each observation with those of previously cataloged X-ray sources in M31 and with the Simbad444http://simbad.u-strasbg.fr/ database. Herein we focus on one bright source that did not appear in any previous catalogs. This position also had no cataloged source in Simbad within 10′′. We name this source CXOM31 J004309.9+412332, according to the IAU-approved naming convention described in Kong et al. (2002) and r3-127 according to the short naming scheme described in Williams et al. (2004). This position is s 4.8′ east and 7.4′ north of the M31 nucleus, on the outskirts of the M31 bulge.
We measured the position errors for r3-127 using the IRAF task imcentroid. These errors were affected by the size of the Chandra point spread function 9′ off-axis and were 1′′ for the brightest detections. The precise values for these errors are provided in Table 3. Upper-limits to the X-ray flux at this position in observations 4680 and 4723 were measured by determining the flux necessary to produce a detection 3- above the background flux.
Finally, we extracted the X-ray spectrum of r3-127 from observations 4682 and 4721 using the CIAO task psextract,555http://cxc.harvard.edu/ciao/ahelp/psextract.html binning the spectrum in energy so that each bin contained 10 counts. We then fit each spectrum using CIAO 3.1/Sherpa, trying both a power-law model with absorption and a disk blackbody model with absorption. The spectrum did not contain enough counts to constrain the foreground absorption. We therefore fixed the absorption to the typical Galactic foreground value (61020 cm-2). This value allowed good fits for both model types. Results are given in Table 4 and discussed in § 3.
2.2 Optical
We obtained two sets of observations of the position of r3-127 using the HST ACS. Each data set was obtained in a single orbit and was observed through the F435W ( equivalent) filter using the standard 4-point box dither pattern to allow for optimal spatial resolution. Each data set was observed with a total exposure time of 2200 seconds. The first of these data sets was obtained 02-Nov-2004, while the X-ray source was likely still active. The second was obtained 01-Jan-2005, after the source had faded below our Chandra detection limit (1036 erg s-1).
Each data set was combined into a final, high-resolution photometric image using the PyRAF666PyRAF is a product of the Space Telescope Science Institute, which is operated by AURA for NASA. task multidrizzle,777multidrizzle is a product of the Space Telescope Science Institute, which is operated by AURA for NASA. http://stsdas.stsci.edu/pydrizzle/multidrizzle which has been optimized to process ACS imaging data. The task removes cosmic ray events and geometric distortions, and it drizzles the dithered frames together into a final, high-resolution, photometric image.
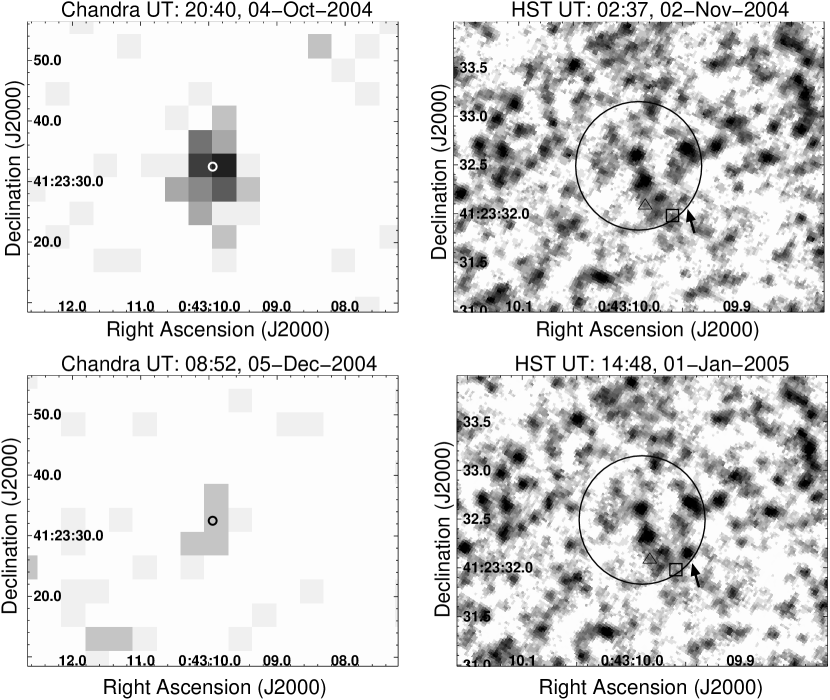
We aligned the final images to the LGS coordinate system with ccmap using stars common to both data sets. The stars positions in both the LGS and ACS images were determined with imcentroid. The resulting alignment had rms errors of 0.03′′ (less than 1 ACS pixel). The ACS images, independently aligned with the LGS coordinate system, are shown in Figure 1. Resolved stellar photometry was then performed on the relevant sections of the final images with DAOPHOT II and ALLSTAR (Stetson et al., 1990). The count rates measured from our images were converted to VEGA magnitudes using the conversion techniques provided in the ACS Data Handbook888http://www.stsci.edu/hst/acs/documents/handbooks/DataHandbookv2/ACS_longdhbcover.html.
3 Results
3.1 X-ray
Source r3-127 was clearly detected 4 times by our monitoring program. These observations provided a lightcurve, precise positional constraints, and X-ray spectral measurements.
The X-ray lightcurve of r3-127 is shown in Figure 2, and the measured fluxes and hardness ratios are provided in Table 2. Observations before the first detection allowed reliable upper limits to the X-ray flux from that position to be measured. Our final observation yielded a marginal detection with a signal-to-noise of 2. We treated this measurement as a detection keeping in mind that if it was spurious the high end of the error range gives the 3 upper-limit of the flux during the final observation (2004-December-05). The lightcurve is complex, including a double-peak, as has been observed for several Galactic XRNe (see lightcurves in McClintock & Remillard, 2004). There was a factor of 3 drop in flux followed by a factor of 4 recovery between the May and October observations. The brightest detection was the second peak, with a flux of (7.40.8) 10-5 photons cm-2 s-1.
The source faded by at least a factor of eight in the 55 days after the second peak. The 3 flux upper limit for the 2004-December-05 observation (910-6 ph cm-2 s-1) yields an -folding decay time after the second peak of 1 month. If the 2 detection of (6310-6 ph cm-2 s-1 in the 2004-December-05 observation is real, then the -folding decay time was 22 days. This decay was faster than that observed after the first peak, where the flux decayed by a factor of 2.8 in 55 days, exhibiting an -folding decay time of 54 days.
Although r3-127 was 9′ off-axis, the Chandra images provided a precise source position. We measured the position in the two brightest detections. Table 3 shows the significant sources of error in this measurement. These were the alignment errors, determined by ccmap, and the position errors, determined by imcentroid. We added these errors in quadrature for each measurement. Then we took the weighted mean R.A. and Dec. to obtain our final position and position error of the source in the LGS coordinate system, which we used to plot the 1 error ellipses shown in Figure 1. The final X-ray position and errors were R.A = 0:43:09.940 0.65′′ and Dec. = 41:23:32.49 0.66′′. At the distance of M31 (780 kpc), the semi-major axis of the error ellipse is 2.5 pc.
The two brightest detections contained sufficient counts to perform fits to the X-ray spectrum of r3-127. The results of the fits are given in Table 4. They show that, while the spectrum was well-fitted by both the absorbed disk blackbody and the absorbed power-law models, it was better fitted by the absorbed disk blackbody with an absorption-corrected 0.3–7 keV luminosity of 1.11037 erg s-1 at the time of the brightest detection. The spectrum was soft, and it may have become softer during the decay. This softening can be seen in the hardness ratios, as HR1 declined from 0.60.2 at the first detection to 0.00.4 during the decay. There is also a hint that the second peak may have been softer than the first in both the hardness ratios and the spectral fits (see Tables 2 and 4). These soft spectra are typical of Galactic LMXBs, especially those systems that contain a black hole primary (e.g. Tanaka & Lewin, 1995; Church & Balucińska-Church, 2001; McClintock & Remillard, 2004).
Concisely, the X-ray lightcurve of r3-127 was complex, having at least two peaks. The position was measured from the Chandra images with 0.7′′ precision, and the spectral fits provided an estimate of the peak absorption-corrected 0.3–7 keV luminosity reached on 04-Oct-2004 of 1.11037 erg s-1.
3.2 Optical
The two HST ACS images of the position of r3-127 are shown in Figure 1 adjacent to the most contemporaneous Chandra ACIS I images available. These data reveal one bright variable source in the southwest part of the error ellipse. By analyzing the completeness of our photometry and carefully examining all potential variable stars, we were able to justify focusing on this bright variable as the most likely optical counterpart of r3-127.
The completeness of our photometry in the two epochs was determined by comparing the DAOPHOT results from the two epochs of HST data. Figure 3 shows the results of a completeness analysis of the ACS data in the region within 3′′ of the X-ray position of r3-127. The solid histogram shows the percentage of stars that were detected in the first epoch and not in the second epoch, as a function of magnitude. The dotted histogram shows the percentage of stars that were detected in the second epoch and not in the first epoch, as a function of magnitude. The completeness begins to fall off at , so that our confidence in the photometry also begins to decrease at this magnitude. The completeness falls below 50% at . We therefore took to be our limiting magnitude, assigning as the upper-limit to all non-detections.
A search for variable stars in the error ellipse of r3-127 was then performed. There were 10 stars detected inside the error ellipse by our DAOPHOT analysis of the first epoch that were more than 4 brighter than and changed in brightness by 4 by the second epoch. Seven of the variable candidates were fainter than during the first epoch, and they were not detected in the second epoch, likely due to completeness. We therefore removed these 7 stars from the pool of variables and possible counterparts.
Two of the other three candidate variable stars had in at least one epoch. At these faint magnitudes the photometry, like the completeness, was likely significantly affected by crowding issues (see Figure 3). Such faint stars are more likely to be blended with stars of similar brightness, which could change the photometry by 0.7 mag.
One of these two variable candidates, marked with the triangles in Figure 1, was in the first epoch and in the second. It showed only a 4.5 increase in brightness between epochs with mag. As the variability was not highly significant and the photometry likely affected by crowding, we removed this star from the pool of possible counterparts.
The other faint variable candidate, marked with the boxes in Figure 1, showed a 4.9 drop in brightness between epochs as measured by DAOPHOT. The star was in the first epoch and in the second, making it the brightest star that varied in concert with the X-ray flux. However, the star only faded by mag, and its photometry could be significantly affected by crowding. We therefore removed it from the pool of possible counterparts.
The only optical variable candidate left in the r3-127 error ellipse, marked with the arrow in Figure 1, is clearly seen by visual inspection of the two images. This candidate was in the first epoch and in the second epoch. This star exhibited a change in brightness of 0.980.07 mag. It varied with 13 significance, clearly separating itself from the other candidate variables, which all showed variations of 5. The large difference in significance distinguished this variable from the other candidates, making it our strongest candidate counterpart for r3-127.
Succinctly, three stars inside the r3-127 error ellipse had statistically significant (4) brightness changes not easily attributable to completeness limitations. Two of these stars were removed as counterpart candidates of r3-127 because they had comparable brightness changes only slightly above threshold (4.5–4.9 ) and their photometry was likely significantly affected by crowding. The only remaining candidate (shown by the arrow in Figure 1) showed variability of much higher significance than any other star in the error ellipse. This candidate is therefore our strongest counterpart candidate for r3-127 and the only candidate that will be considered for the remainder of the paper.
4 Discussion
Since most Galactic bright transient X-ray sources are either HMXBs or LMXBs, it is likely that r3-127 is one of these types of sources. Our X-ray and optical data suggest that it is an LMXB. If r3-127 is an LMXB and our candidate counterpart is correct, our data can be used to predict the orbital period of the binary.
The brightest stars in the error ellipse of r3-127 have . Assuming a distance modulus of M31 of 24.47 (780 kpc; Williams, 2003) and typical foreground extinction toward M31 of , these stars have M. This absolute magnitude is fainter than high-mass O and B stars which are the typical secondaries of high-mass X-ray binaries (HMXBs). Therefore both the faintness of any potential optical counterpart and the X-ray spectrum (see § 3) suggest that r3-127 is an LMXB.
The candidate counterpart was bright when our X-ray data suggest the source was faint, which is unexpected but does not rule the star out as the optical counterpart of r3-127. Such high-amplitude variables at these magnitudes in 2-epoch ACS photometry of M31 have a density of 27 arcmin-2 (Williams, 2005). As our error circle covers only 3.810-4 arcmin2, there is only a 1% probability of such a variable randomly falling in our error circle.
In addition, the lightcurve of r3-127 (see Figure 2) did not exhibit a simple monotonic decay over one to several months. At the very least, r3-127 exhibited a double-peak reminiscent of XTE 1550-564 (Jain et al., 2001b). The low sample rate of our lightcurve and the differing decay times of the peaks highlight the possibility that r3-127 was exhibiting fast flaring, as has been seen in some Galactic transient events such as, for example, GRO 1655-40 (see Fig. 1 of Remillard et al., 1999) and GRS 1915+105 (see Fig. 1 of Rau et al., 2003).
If the X-ray lightcurve was complex, it is not so surprising that the candidate counterpart did not vary as expected. For example, in XRN XTE J1550-564 the optical “reflare” was brighter than the optical flux during the initial X-ray outburst by more than half a magnitude (Jain et al., 2001b). Another flaring event in this source exhibited a secondary peak in the optical that was not observed in X-rays at all (Jain et al., 2001a).
Source r3-127 could be a good candidate for such a reflare as the observed 0.3–7 keV luminosity of the XRN (1.11037 erg s-1) is only 10% of the Eddington luminosity of a neutron star and only 1% of the Eddington luminosity of a typical stellar-mass black hole. These numbers suggest that only a small fraction of the mass of the disk was consumed by the outburst, allowing the potential for another accretion event that could have resulted in a high optical flux in the second epoch of ACS data. All of these arguments point to our candidate, the most clearly variable star in the r3-127 error ellipse, as the most likely optical counterpart to r3-127.
With a strong candidate counterpart, we can predict the orbital period of r3-127. There is an empirical relation between the X-ray luminosity, optical luminosity, and orbital period of Galactic LMXBs during outburst (van Paradijs & McClintock, 1994). The relation suggests that outbursts that are fainter in the optical have smaller accretion disks due to closer binary separation. Therefore the fainter the optical counterpart, the shorter the orbital period of the binary.
More recently studied LMXBs have also been found to fit this relation. Williams et al. (2005a) applied the relation to the brightest observed X-ray and optical luminosities in a single outburst for several recently-discovered transient LMXBs. For example, the brightest optical and X-ray luminosities observed for 4U 1543-47 during the 1983 outburst were applied to the relation regardless of the specific timing of the observations. In most cases, the sources followed the relation. Furthermore, (Williams et al., 2005c) performed detailed checks of the application of the relation when applied to optical and X-ray observations separated by weeks. For example, the photometry for A0620-00 from Esin et al. (2000) and for XTE J1550-564 from Jain et al. (2001b) provided period predictions that were correct within the (rather substantial) errors. The X-ray and optical luminosities of r3-127 therefore provide a rough prediction of the orbital period of the binary system.
The apparent complexity of the X-ray and optical lightcurves of r3-127 adds uncertainty to our application of the van Paradijs & McClintock (1994) relation, as we do not have precisely simultaneous X-ray and optical observations. On the other hand, the uncertainty introduced by the non-simultaneous nature of our measurements is small compared to the dynamic range of the relation. The relation holds over 8 optical magnitudes and 3 orders of magnitude in X-ray luminosity, and the optical variability between observations of the counterpart candidate is only 1 mag. Additionally, the intensity of both peaks in X-ray flux overlapped at the 1 level. Therefore, even considering the complexity of the lightcurve and possibility of fast flaring, the brightest observed optical and X-ray luminosities can provide a reasonable orbital period prediction.
Applying the van Paradijs & McClintock (1994) relation requires measurements of the optical and X-ray luminosity during outburst. Assuming the same foreground absorption we used for the X-ray spectral fits, and applying the conversion of Predehl & Schmitt (1995), the optical extinction toward r3-127 is . In addition, the mean color of LMXBs in the Liu et al. (2001) catalog is -0.090.14. Correcting for the extinction, color, and distance to r3-127, the brightest measured MV for the counterpart candidate (), was M. The brightest observed 0.3–7 keV luminosity of r3-127, according to our best-fitting X-ray spectral model, was LX=1.11037 erg s-1. These optical and X-ray luminosities yield an orbital period prediction of days including the errors of the relation. The final errors change to days if the errors in the empirical relation are not taken into account.
Succinctly, the data show that r3-127 is not likely an HMXB, and therefore it is likely an LMXB. In addition, the complex X-ray lightcurve makes the possibility of a complex optical lightcurve more likely, suggesting the bright variable star could be the optical counterpart even though it did not fade between observations. Considering the complex nature of the lightcurve, the highest X-ray and optical luminosity measurements provide our best prediction for the orbital period of the system: days. This range is consistent with the periods of many Galactic LMXB transient systems.
5 Conclusions
We have discovered a new bright transient X-ray source in M31 at R.A.=00:43:09.940 , Dec.=41:23:32.49 . We have named the source CXOM31 J004309.9+412332 and given it the shorter name of r3-127. This source was active for at least 5 months during 2004, but it has not been seen before or since, even in surveys with limiting fluxes nearly a factor of 100 fainter than our brightest detection of r3-127. The observed X-ray lightcurve was double-peaked, hinting that this source may be of a similar nature to some Galactic XRNe with complex lightcurves like XTE J1550-564 or GRO J1655-40 (McClintock & Remillard, 2004).
The X-ray spectrum of the source was soft, as is typical for LMXBs. It was well-fitted by both absorbed power-law and absorbed disk blackbody models, although the absorbed disk blackbody fits were somewhat better. The spectrum appeared marginally softer during the second half of the 5-month outburst. The best fit model had an inner disk temperature of 0.8 keV and an absorption-corrected 0.3–7 keV peak luminosity of 1.11037 erg s-1 on 04-Oct-2004.
Coordinated HST ACS observations of the position of r3-127 revealed no stars brighter that M, confirming r3-127 is not an HMXB. The observations also detected one variable star at high confidence within the error ellipse of the X-ray outburst. This star is the strongest candidate counterpart of the X-ray transient source. The counterpart candidate brightened when our data suggest the X-ray source was faint, but the complexity of the lightcurve suggests such optical variations are reasonable. The highest optical and X-ray luminosity measurements yield a prediction for the orbital period of r3-127 of 2.3 days. This predicted period range is large, and it includes the periods of many Galactic LMXB transient systems.
The location and outburst date of r3-127, along with those of the other transient sources followed with HST in 2004 (s1-86, r2-70, and r2-71; Williams et al., 2005a, b, c, respectively), are consistent with the spatial distribution and rate of transients measured in Williams et al. (2004). We continue to find 1 new transient source each month, and about half of them are in the bulge (within 7′ of the nucleus). None of these recent events has appeared in a cluster or shown a high-mass secondary, suggesting that the outbursts are not associated with star formation.
Support for this work was provided by NASA through grant number GO-9087 from the Space Telescope Science Institute and through grant number GO-3103X from the Chandra X-Ray Center. MRG acknowledges support from NASA LTSA grant NAG5-10889. JEM acknowledges support from NASA ADP grant NNG-05GB31G.
References
- Church & Balucińska-Church (2001) Church, M. J., & Balucińska-Church, M. 2001, A&A, 369, 915
- Di Stefano et al. (2004) Di Stefano, R., et al. 2004, ApJ, 610, 247
- Esin et al. (2000) Esin, A. A., Kuulkers, E., McClintock, J. E., & Narayan, R. 2000, ApJ, 532, 1069
- Jain et al. (2001a) Jain, R. K., Bailyn, C. D., Orosz, J. A., McClintock, J. E., & Remillard, R. A. 2001a, ApJ, 554, L181
- Jain et al. (2001b) Jain, R. K., Bailyn, C. D., Orosz, J. A., McClintock, J. E., Sobczak, G. J., & Remillard, R. A. 2001b, ApJ, 546, 1086
- Kong et al. (2002) Kong, A. K. H., Garcia, M. R., Primini, F. A., Murray, S. S., Di Stefano, R., & McClintock, J. E. 2002, ApJ, 577, 738
- Liu et al. (2001) Liu, Q. Z., van Paradijs, J., & van den Heuvel, E. P. J. 2001, A&A, 368, 1021
- Massey et al. (2001) Massey, P., Hodge, P. W., Holmes, S., Jacoby, G., King, N. L., Olsen, K., Saha, A., & Smith, C. 2001, in American Astronomical Society Meeting, Vol. 199, 13005
- McClintock & Remillard (2004) McClintock, J. E., & Remillard, R. A. 2004, in Compact Stellar X-ray Sources (astro-ph/0306213)
- Osborne et al. (2001) Osborne, J. P., et al. 2001, A&A, 378, 800
- Predehl & Schmitt (1995) Predehl, P., & Schmitt, J. H. M. M. 1995, A&A, 293, 889
- Rau et al. (2003) Rau, A., Greiner, J., & McCollough, M. L. 2003, ApJ, 590, L37
- Remillard et al. (1999) Remillard, R. A., Morgan, E. H., McClintock, J. E., Bailyn, C. D., & Orosz, J. A. 1999, ApJ, 522, 397
- Stetson et al. (1990) Stetson, P. B., Davis, L. E., & Crabtree, D. R. 1990, in ASP Conf. Ser. 8: CCDs in astronomy, 289
- Tanaka & Lewin (1995) Tanaka, Y., & Lewin, W. H. G. 1995, in X-ray binaries (Cambridge Astrophysics Series, Cambridge, MA: Cambridge University Press, —c1995, edited by Lewin, Walter H.G.; Van Paradijs, Jan; Van den Heuvel, Edward P.J.)
- Trudolyubov et al. (2001) Trudolyubov, S. P., Borozdin, K. N., & Priedhorsky, W. C. 2001, ApJ, 563, L119
- van Paradijs & McClintock (1994) van Paradijs, J., & McClintock, J. E. 1994, A&A, 290, 133
- Williams (2003) Williams, B. F. 2003, MNRAS, 340, 143
- Williams (2005) Williams, B. F. 2005, AJ, submitted
- Williams et al. (2004) Williams, B. F., Garcia, M. R., Kong, A. K. H., Primini, F. A., King, A. R., Di Stefano, R., & Murray, S. S. 2004, ApJ, 609, 735
- Williams et al. (2005a) Williams, B. F., Garcia, M. R., Kong, A. K. H., Primini, F. A., & Murray, S. S. 2005a, ApJ, accepted
- Williams et al. (2005b) Williams, B. F., Garcia, M. R., McClintock, J. E., Kong, A. K. H., Primini, F. A., & Murray, S. S. 2005b, ApJ, 628, 382
- Williams et al. (2005c) Williams, B. F., Garcia, M. R., Primini, F. A., McClintock, J. E., & Murray, S. S. 2005c, ApJ, accepted
| ObsID | Date | R.A. (J2000) | Dec. (J2000) | Roll (deg.) | Exp. (ks) |
|---|---|---|---|---|---|
| 4680 | 27-Dec-2003 | 00 42 44.4 | 41 16 08.3 | 285.12 | 4.2 |
| 4682 | 23-May-2004 | 00 42 44.4 | 41 16 08.3 | 79.99 | 3.9 |
| 4719 | 17-Jul-2004 | 00 42 44.3 | 41 16 08.4 | 116.83 | 4.1 |
| 4720 | 02-Sep-2004 | 00 42 44.3 | 41 16 08.4 | 144.80 | 4.1 |
| 4721 | 04-Oct-2004 | 00 42 44.3 | 41 16 08.4 | 180.55 | 4.1 |
| 4723 | 05-Dec-2004 | 00 42 50.0 | 41 17 15.0 | 269.81 | 4.0 |
| Date | Counts | FluxaaThe exposure corrected 0.3–10 keV flux in units of 10-5 photons cm-2 s-1 | HR1bbHardness ratio calculated by taking the ratio of M-S/M+S, where S is the number of counts from 0.3–1 keV and M is the number of counts from 1–2 keV. | HR2ccHardness ratio calculated by taking the ratio of H-S/H+S, where S is the number of counts from 0.3–1 keV and H is the number of counts from 2–7 keV. | |
|---|---|---|---|---|---|
| 23-May-2004 | 60 | 5.70.8 | 0.610.20 | 0.240.27 | |
| 17-Jul-2004 | 22 | 2.10.5 | 0.600.28 | 0.210.34 | |
| 02-Sep-2004 | 14 | 1.80.5 | 0.010.40 | -0.200.48 | |
| 04-Oct-2004 | 82 | 7.40.8 | 0.350.14 | -0.140.18 | |
| 05-Dec-2004 | 6 | 0.60.3 | 0.310.43 | -1.11.3 |
| ObsID | R.A. (J2000) | aaThe alignment error between the X-ray coordinate system and the optical coordinate system from the LGS, determined by ccmap. (′′) | bbThe position error for the source determined by imcentroid. (′′) | ccThe total error for the position, determined by adding the alignment and position errors in quadrature. (′′) | Dec. (J2000) | (′′) | (′′) | (′′) | |
|---|---|---|---|---|---|---|---|---|---|
| 4682 | 0:43:10.067 | 0.09 | 1.31 | 1.31 | 41:23:32.73 | 0.12 | 0.95 | 0.96 | |
| 4721 | 0:43:09.899 | 0.14 | 0.74 | 0.75 | 41:23:32.27 | 0.11 | 0.91 | 0.92 | |
| Mean | 0:43:09.940 | 0.65 | 41:23:32.49 | 0.66 |
| Date | Model | Norm.aaNormalization parameter for the model. For the power-law model the units are photons keV-1 cm2 s-1 at 1 keV; for the disk blackbody model the parameter is the quantity ((Rin/km)/(D/10 kpc))2 cos(). Where is the inclination angle of the accretion disk to the line of sight, is the distance to the source, and is the radius of the inner edge of the accretion disk. | ParameterbbThe final parameter in the model fit. For power-law models, this is the photon index of the spectrum. For disk blackbody models, this is the temperature () in keV of the inner edge of the accretion disk. | ccProbability, based on statistics, that the observed spectrum is a sample obtained from a source with an intrinsic spectrum equivalent to the model.The absorption-corrected 0.3–7 keV luminosity of the source in units of 1036 erg s-1. | LXddfootnotemark: | |
|---|---|---|---|---|---|---|
| 23-May-2004 | disk blackbody | 0.0100.009 | 0.90.2 | 3.10/4 | 0.54 | 10 |
| 23-May-2004 | power-law | (3.20.6)10-5 | 1.90.3 | 6.31/4 | 0.18 | 12 |
| 04-Oct-2004 | disk blackbody | 0.0220.016 | 0.80.1 | 4.28/5 | 0.51 | 11 |
| 04-Oct-2004 | power-law | (4.30.6)10-5 | 2.00.2 | 4.42/5 | 0.49 | 16 |