XMM-Newton Observation of Diffuse Gas and LMXBs in the Elliptical Galaxy NGC 4649 (M60)
Abstract
We present an XMM-Newton X-ray observation of the X-ray bright E2 elliptical galaxy NGC 4649. In addition to bright diffuse emission, we resolve 158 discrete sources, 50 of which are likely to be low-mass X-ray binaries (LMXBs) associated with NGC 4649. We find evidence for variability in three sources between this observation and a previous Chandra observation. Additionally, we detect five sources that were not detected with Chandra despite its better detection limit, suggesting that these sources have since brightened. The total X-ray spectrum of the resolved sources is well-fit by a hard power-law, while the diffuse spectrum requires a hard and a soft component, presumably due to the relatively soft diffuse gas and the harder unresolved sources. A deprojection of the diffuse emission revealed a radial temperature gradient that is hot in the center, drops to a minimum at about 20-50″ (1.6-4.1 kpc), and rises again in the outer regions. The diffuse emission appears to require a two-temperature model with heavy element abundance ratios that differ from the solar values. We have verified the existence of faint radial features extending out from the core of NGC 4649 that had previously been seen with Chandra. The fingers are morphologically similar to radial features seen in hydrodynamic simulations of cooling flows in elliptical galaxies, and although their other properties do not match the predictions of the particular simulations used we conclude that the radial fingers might be due to convective motions of hot outflowing gas and cooler inflowing gas. We also find evidence for a longer, previously undetected filament that extends to the northeastern edge of NGC 4649. The diffuse gas in the region of the filament appears to have a lower temperature and may also have a higher abundance as compared to nearby regions. There also appears to be an excess of X-ray sources along the filament, though the excess is not statistically significant. We conclude that the filament may be the result of a tidal interaction, possibly with NGC 4647, though more work is necessary to verify this conclusion.
1 Introduction
By now it has been well established that the X-ray emission from early-type galaxies has several components. These galaxies can roughly be grouped into two categories based on the ratio of the X-ray to optical luminosity : the X-ray bright galaxies which have large values of , and the X-ray faint galaxies which have small values of . In the X-ray bright elliptical and S0 galaxies, the X-ray emission is dominated by thermal emission from interstellar gas at a temperature of keV. The spectra of their X-ray faint counterparts tend to require two components: a soft thermal component with keV, and a hard component which has been fit as either thermal bremsstrahlung with keV or a power-law (Fabbiano, Kim, & Trinchieri 1994; Matsumoto et al. 1997; Allen, di Matteo, & Fabian 2000; Blanton, Sarazin, & Irwin 2001). The luminosity of the hard component varies roughly proportional to the optical luminosity, suggesting that the origin of this component is low-mass X-ray binaries (LMXBs) similar to those seen in our own Galaxy (Trinchieri & Fabbiano 1985). The high spatial resolution of the modern X-ray observatories Chandra and XMM-Newton has allowed much of the hard component to be resolved into individual sources, thereby demonstrating that this hard component is indeed from individual sources (e.g., Sarazin, Irwin, & Bregman 2000, 2001).
In this paper, we present the results of a XMM-Newton observation of the X-ray bright elliptical galaxy NGC 4649 (M60). This is an E2 elliptical galaxy in the Virgo cluster. NGC 4649 has a close companion galaxy NGC 4647, which is an Sc galaxy. This pair of galaxies is also referred to as Arp 116 or VV 206. With a third more distant galaxy, this pair forms a group of galaxies WBL 421 (White et al. 1999). NGC 4647 was the host of the Type-I supernova SN1979a (Barbon et al. 1984).
We previously observed NGC 4649 with the ACIS S3 detector on the Chandra X-ray Observatory (Randall, Sarazin, & Irwin 2004, hereafter Paper I). We detected 165 discrete X-ray sources with fluxes determined at significance, most of which are likely to be low-mass X-ray binaries (LMXBs) associated with NGC 4649. The luminosity function of the resolved sources was fit by a broken power-law with a break luminosity of ergs s-1. We argued that the break luminosity might separate black hole binaries (at higher luminosities) from predominantly neutron star binaries at lower luminosities. The cumulative X-ray spectrum of the resolved point sources was fit by a hard power-law model. The dominant X-ray emission from NGC 4649 is from diffuse hot gas. The Chandra image showed several interesting possible structures in the X-ray gas, including radial “fingers” extending from the center of the galaxy. We suggested that these fingers, if confirmed, might be due to convective motions of the hot interstellar gas, as predicted in some simulations of elliptical galaxies (Kritsuk, Böhringer, & Müller 1998). We also detected a 5″ (0.41 kpc) long “bar” feature at the center of the Chandra image, which we suggested was due to a shock, perhaps driven by an undetected low-luminosity active galactic nucleus (AGN).
Subsequently, we observed NGC 4649 with XMM-Newton. The purposes of this observation included obtaining more detailed X-ray spectral information on the gas and X-ray binaries, and studying the structures in the hot ISM. We adopt a distance for NGC 4649 of 16.8 Mpc, based on the method of surface brightness fluctuations (Tonry et al. 2001). This is the same distance assumed for out analysis of the Chandra observation, and is consistent with the corrected recession velocity distance in Faber et al. (1989) if the Hubble constant is 79 km s-1 Mpc-1. Unless otherwise noted, all uncertainties quoted are at the 90% confidence level.
2 Observation and Data Reduction
NGC 4649 was observed on 2001 January 2 for 53,867 s with the thin filter in place and with each EPIC instrument in full frame mode. The pointing was determined such that the galaxy was centered on the MOS instruments so that it was not on a node boundary for these instruments. The analysis in this paper will be based on data from all three EPIC instruments: EMOS1, EMOS2, and EPN. For the MOS instruments, only events with patterns 0 through 12 (corresponding to single, double, triple, and quadruple pixel events) were kept, and for the PN only patterns 0 through 4 (for single and double pixel events) were kept. We excluded bad pixels, pixels next to bad pixels, bad columns, and columns next to bad columns or chip node boundaries. The exposures for the MOS and PN instruments were 51,348 s and 48,951 s respectively.
Due to their high orbits, Chandra and XMM-Newton experience periods of high background (“background flares”). An inspection of the binned light curves from each EPIC instrument showed that our data were affected by a few strong flares. To remove them, we first excluded periods most obviously affected by flares. The resulting data were further filtered such that only bins with counts within 2- of the mean were kept. This excluded periods of background flares and data drop-outs. The remaining exposure times were about 45,800 s and 40,800 s for the MOS and PN instruments respectively.
The PN camera is known to be susceptible to detecting a significant number of photons during the readout of the chip. These out-of-time events were clearly visible in the uncorrected raw image from the PN camera. Fortunately, the Science Analysis Software (sas111See http://xmm.vilspa.esa.es/external/xmm_sw_cal/sas_frame.shtml .) package provides the script epchain, which can be used to produce a statistical description of out-of-time events. The resulting out-of-time image was scaled by 6%, which is appropriate for full frame observing mode222http://xmm.vilspa.esa.es/external/xmm_user_support/documentation/sas_usg/USG/index.html, and subtracted from the raw PN image. This appeared to remove all of the obvious artifacts associated with out-of-time events.
Three of the X-ray sources detected have optical counterparts listed in the U.S. Naval Observatory (USNO) B1.0 optical catalog (Monet et al. 2003). The X-ray and optical position all agree to better than 3″. Thus, we believe that the absolute positions derived from the X-ray observations are typically accurate to within 3″.
3 X-Ray Image
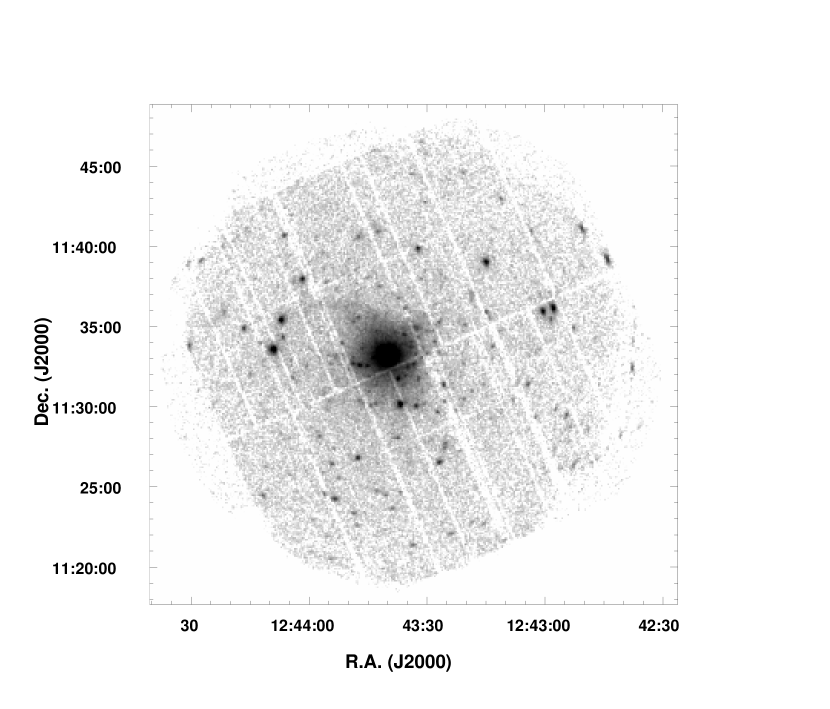
The raw X-ray image is shown in Figure 1 for the cleaned exposure in the 0.3–12.0 keV band. The images from the three EPIC cameras have been superimposed. The sky background has not been subtracted from this image, nor has the exposure map been applied. This image has been smoothed with a 2-pixel gaussian to make the point sources more visible. Many discrete sources are evident. Also visible is bright diffuse emission at the center of the galaxy, which swamps emission from discrete sources in that region. Additionally, there appears to be a faint filament of diffuse emission extending from the northeast of NGC 4649 and curving to the east. This feature is discussed further in § 7.
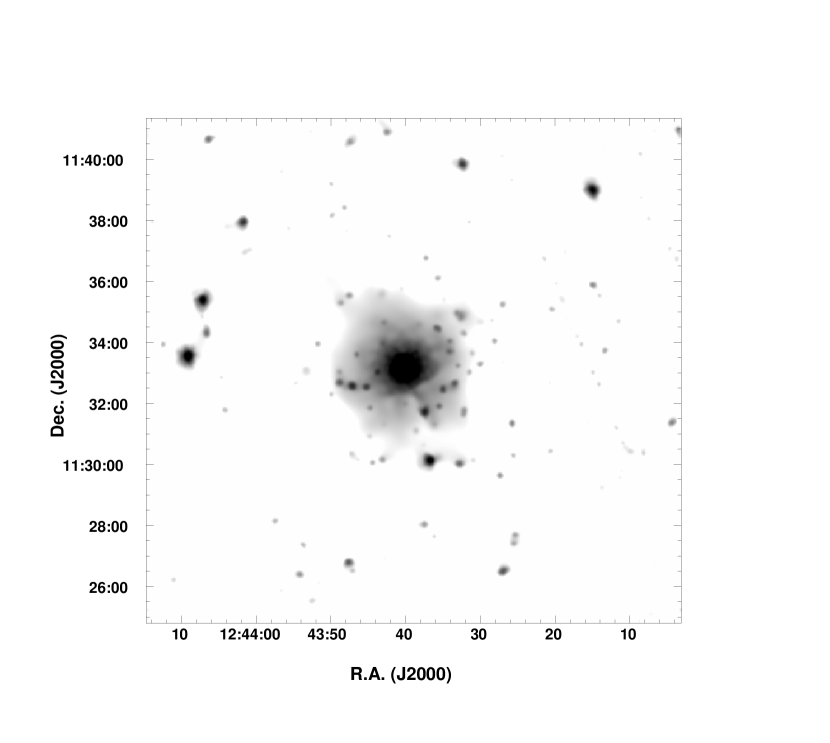
In order to image the fainter, more diffuse emission, we adaptively smoothed the central region of Figure 1 to a minimum signal-to-noise ratio of 3 per smoothing beam. The resulting image is shown in Figure 2. The image was corrected for exposure and background. This image shows rather extended diffuse emission from NGC 4649 as well as the point sources. In addition to some extended features in the outer parts of the galaxy, the image appears to show faint radial “fingers” of emission reaching out from the center of NGC 4649 similar to those seen in the smoothed Chandra image, which are discussed further in § 6.1.
4 Resolved Sources
4.1 Detections
We opted to use the ciao333See http://asc.harvard.edu/ciao/. wavelet detection program wavdetect to determine the discrete source population. Sources were confirmed with a local cell detection algorithm implemented by the sas routine eboxdetect. Source detection was performed in four energy bands: 0.3–1.0 keV, 1.0–2.0 keV, 2.0–12.0 keV, and 0.3–12.0 keV; data from all cameras were used simultaneously to allow for the detection of faint sources. The detection significance threshold was set such that 1 false source (due to statistical fluctuations in the background) would be detected. Since wavedetect cannot correct for XMM-Newton’s PSF, the determined count rates were unreliable, although the detection process itself was unaffected. We therefore ran the sas routine emldetect on the source list generated by wavdetect, which uses a maximum-likelihood algorithm to determine source extent and count rate (at the time, also allowing the source positions to vary was not supported) and can properly account for the PSF. Thus, the final source fluxes have been corrected for exposure and the instrumental PSF. We used the sas task esplinemap to generate background maps to be used by emldetect. This task removes specified source regions from the input image and performs a spline fit to the remaining data to interpolate across source regions and generate a background map. It should be noted that it was necessary to remove Src. 1 from the list of sources to be cut out of the background, since this source is not a resolved source but a detection of the peak in the diffuse emission. Masking this source when generating a background map caused the background to be significantly underestimated for regions just outside the region of the central source. Additionally, we found it necessary to increase the minimum detection likelihood of sources that were removed from the background map above the typical value for the final source list. If the detection likelihood was set too low the background from the bright diffuse emission was undersampled, which caused the interpolated background map to underestimate this component of the background (note that the XMM-Newton PSF is large compared to the scale of the radial brightness gradient of the diffuse galactic emission). The final source list was trimmed such that only sources whose fluxes were known to better than 3- in at least one energy band were kept.
This technique resulted in 158 detected sources. Blank-sky observations suggest that many of these sources are likely to be background sources unrelated to NGC 4649 (Hasinger et al. 2001). For the purposes of this paper we therefore limit the sources we consider to those within 328″ (27 kpc), or 4 optical effective radii (, van der Marel 1991) of the center of NGC 4649. Table 1 lists the 47 sources contained within this region. Columns 1-7 give the source number, the IAU name, the source position (J2000), the projected distance from the center of NGC 4649, the 0.3–12.0 keV total count rate (combined rate for all chips on which source was not on a chip gap or bad column) and the 1- error, and the signal-to-noise ratio (SNR) for the total count rate. Columns 11-13 indicate which of the four energy bands (soft, medium, hard, and total) each source was detected in for each instrument, where a source is considered to be “detected” if the SNR in that energy band is at least 3. All sources were detected in the total 0.3–12.0 keV energy band using the combined data from each instrument on which the source was visible (i.e., not on a bad column or chip gap). The two sources that were not visible on all three EPIC instruments are marked with a “i” in the Notes column of Table 1. Both of these sources were visible on the MOS cameras but not on the PN. Since we did not detect a point source at the center of the galaxy, we adopted the central position from 4.86 GHz radio observations of R.A. = 12h43m4002, and Dec. = +11°33′102 (J2000; Condon, Frayer, & Broderick 1991), which is the same value we used for our Chandra source list for NGC 4649. The uncertainty of this position is . The statistical errors in the X-ray source positions are typically about 1″ (1- errors).
The detection limit in the full 0.3-12.0 keV band was about cnt s-1 for . The detection limit was increased for (10 kpc) due to the bright diffuse emission. This effect is obvious in Table 1, where no sources were detected within 66″ (5.4 kpc) of the center of NGC 4649 (except Src. 1, which is not a resolved source but a detection of the peak in the diffuse emission).
The count rates for the sources were converted into unabsorbed luminosities (0.3–12 keV) assuming that all of the sources were at the distance of NGC 4649, which we take to be 16.8 Mpc (Tonry et al. 2001). We adopted the best-fit XMM-Newton X-ray spectrum of the resolved sources within the inner four effective radii (Table 3 below). The factor for converting the count rates (0.3–12.0 keV) to luminosities depended on which instruments contributed to the count rates (i.e., in which EPIC cameras each source was visible). Due to the relatively small number (about 30) of sources available that were both likely to be associated with NGC 4649 and in a region of relatively faint diffuse emission we were unable to place useful constraints on the luminosity function of the sources.
4.2 Identifications
As noted above, there was only one source, Src. 1, detected within 66″ of the center of NGC 4649. We believe that this detection does not represent an individual source, but rather a structural feature in the diffuse emission. This source is 3.6 times wider (FWHM) than the PSF of a point source at the same location, and is wider than any other detected source in the image. We will therefore drop Src. 1 from further discussion of the point sources.
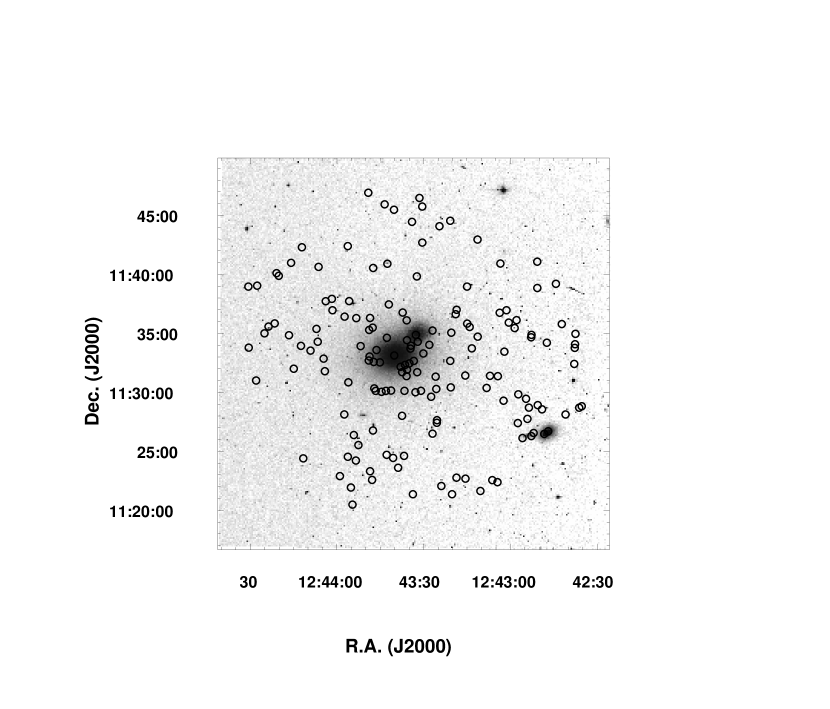
We compared the positions of the X-ray sources with the Digital Sky Survey (DSS) image of this region (Fig. 3). Seven of the sources had possible faint optical counterparts on this image. These are all marked with a “h” in the Notes column of Table 1. Two of the optical counterparts (for Srcs. 29 & 41) have positions listed in the USNO-B1.0 catalog (Monet et al. 2003). Sources with possible USNO-B1.0 counterparts are indicated by a “j” in the Notes column of Table 1. Two of the USNO-B1.0 counterparts (for Srcs. 29 & 47) match the X-ray positions to within 3″, while from the density of sources in the field less than one match is expected at random (this does not include the match for Src. 21, which is also within 3″ but may be a detection of the nucleus of the companion galaxy NGC 4647).
We also compared the positions of the X-ray sources to the list of near-infrared point sources provided by the 2MASS All-Sky Point Source Catalog and to the list of extended sources in the 2MASS All-Sky Extended Source Catalog. Only one source, Src. 21, was within 5″ of a 2MASS source (for the point sources less than 0.5 sources are expected match at random). This source, which as mentioned above is within 3″ of the center of NGC 4647, has a match in both the point source and extended source catalogs. It is marked with a “k” in the Notes column of Table 1.
The source list from our Chandra observation of NGC 4649 was also correlated with the XMM-Newton X-ray source list. There were 23 matches within 5″, whereas 2 would have been expected at random. XMM-Newton sources with a single Chandra match are marked with a “c” in the Notes column of Table 1. Some of the XMM-Newton sources had more than one Chandra match and may therefore be a blend of sources. These sources are marked with a “d” in the Notes column. Three sources had Chandra counterparts that had previously been identified with globular clusters (GCs). Sources corresponding to GCs are marked with a “e” in the Notes column of Table 1 (note that Src. 12 has two potential Chandra source matches, both of which correspond to GCs).
As shown in Figure 3, NGC 4649 has a nearby companion galaxy, the Sc galaxy NGC 4647. Some of the X-ray sources are projected on the optical image of this galaxy and might therefore be associated with it. In particular, the position of Src. 21 is within 3″ (0.24 kpc) of the center of NGC 4647 given by optical observations. These sources are marked with a “g” in the Notes column of Table 1. This galaxy was also the host of the Type I supernova SN 1979a (Barbon et al. 1984), although this source was not detected in our observation.
4.3 Variability
We searched for variability in the X-ray emission of the resolved sources over the duration of the XMM-Newton observation, excluding periods with background flares, using the Kolmogoroff-Smirnov test (see Sarazin, Irwin, & Bregman 2001). The test was performed on each camera separately and on the combined data. For only one of the sources in Table 1, Src. 12, was the probability of being constant %. This source is marked with a “f” in the Notes column of Table 1. The variability was only significantly detected when the data from all three chips were used. This source was roughly 28″ from a chip gap on the PN camera, which is larger than the local PSF and the 0.5″ magnitude of the pointing drift indicated by our optical monitor data. It varies in brightness by about 50% of the average value. We also compared the luminosities of sources detected both with XMM-Newton and with Chandra (see § 4.2). We selected only those sources that were not a blend of Chandra sources and were not near a chip gap or bad column on any EPIC or Chandra instrument; after correcting for the difference in detection bands we found that 3 out of the 8 selected sources (Srcs. 14, 16, and 28) had different luminosities in the Chandra and XMM-Newton observations at the 3- level. In the XMM-Newton observation Srcs. 14 and 28 brightened, by 52% and 112% respectively, while Src. 16 was 63% fainter. However, it should be noted that the uncertainties in the XMM-Newton luminosities may be larger than the statistical errors, due to the difficulties associated with generating a proper background map for the central region, which are described above in § 4.1. Additionally, source confusion may artificially inflate some source luminosities, given XMM-Newton’s relatively large PSF. Despite the higher detection limit, we detected 5 sources in the 0.3–12.0 keV band that were not detected in the Chandra observation. These were Srcs. 3, 11, 36, 40, and 42. These sources have most likely brightened from luminosities below the Chandra detection limit ( ergs s-1 in the 0.3–10 keV band).
4.4 Hardness Ratios
We determined X-ray hardness ratios for the sources, using the same techniques and definitions we used previously (Sarazin et al. 2000; Paper I). Hardness ratios or X-ray colors are useful for crudely characterizing the spectral properties of sources, and can be applied to sources which are too faint for detailed spectral analysis. We define two hardness ratios as H21 and H31 , where , , and are the net counts in the soft (0.3–1 keV), medium (1–2 keV), and hard (2–12 keV) bands, respectively. The hardness ratios are listed in columns 9 and 10 of Table 1 for all of the resolved sources. The errors in the hardness ratios are determined from the Poisson errors in the original counts in the bands, and are carefully propagated so as to avoid mathematically impossible hardness ratios; that is, the error ranges are limited to to 1. The hardness ratios were computed using the total net counts from all three EPIC instruments where possible; for the two sources not visible on the PN camera (marked with a “i” in the Notes column of Table 1) the counts from the MOS instruments were used.
Figure 4 plots H31 vs. H21 for all the discrete sources, excluding sources which were not detected on all three EPIC instruments. As was also seen in NGC 4697, NGC 1553, the bulge of NGC 1291, and a Chandra observation of NGC 4649 (Sarazin et al., 2000, 2001; Blanton et al., 2001; Irwin et al., 2001; Paper I), most of the sources lie along a broad diagonal swath extending roughly from (H21,H31) to (0.3,0.2). We find two “supersoft” sources ([H21,H31] ), Srcs. 2 and 21. Src. 2 is located in a region of bright diffuse emission and therefore, as discussed in § 4.1, the luminosity, and hence the X-ray colors, may be inaccurate. Src. 21 may be a detection of diffuse gas in the companion galaxy NGC 4647, which would explain the soft colors. One source, Src. 18, had relatively hard X-ray colors ([H21,H31] ), which suggests that this source may be an unrelated, strongly absorbed AGN. This conclusion agrees with our previous results from Chandra (this source corresponds to Chandra Src. 110).
5 X-ray Spectra
We used the sas11footnotemark: 1 task evselect to extract spectra. For extended sources the response matrices were calculated using the sas tasks rmfgen and arfgen. For the individual resolved sources local backgrounds were used. For the diffuse spectra we used the blank sky background files E1_ft0000_M1.fits, E1_00ft00_M2.fits, and E1_0000ft_PN.fits provided by Read & Ponman (2003). This is preferable to using background data extracted from off axis regions of our own observation since there are significant spatial variations in the background, particularly on the PN chip (Lumb 2002444Available at http://xmm.vilspa.esa.es/docs/documents/CAL-TN-0016-2-0.ps.gz.; Read & Ponman 2003). The blank sky data were cast into sky coordinates and then filtered for flares using the same method described in § 2. Since the particle background may vary from observation to observation we normalized the blank sky data so that the count rates in the 10-12 keV band for the MOS cameras, and in the 12-14 keV band for the PN camera, matched our observed count rates. However, this turned out to be a small correction (). The PN spectra were corrected throughout for out-of-time events by subtracting spectra extracted from the out-of-time images mentioned in § 2 and scaled by 6%. Fits to the source spectrum were done for the full 0.3–12.0 keV band. Spectral fits for the diffuse emission were restricted to the 0.3-5.0 keV band since emission from the diffuse gas (which has keV) is weak above 5 keV. Also, there are some instrumental lines above 5 keV, particularly for the PN camera, that apparently do not necessarily scale with the background, which can significantly affect the fitting process (Kirsch 2003555Available at http://xmm.vilspa.esa.es/docs/documents/CAL-TN-0018-2-1.ps.gz.). Each spectrum has been grouped to a minimum of 20 counts per pulse invariant (PI) channel so that statistics apply. We used xspec to fit models to the data. The absorption column was fixed at the Galactic value ( cm-2; Dickey & Lockman 1990) throughout, unless otherwise indicated.
We expect that there may be excess background emission in this region as was seen in Chandra observations of NGC 4649. This excess may be a combination of emission from the Virgo cluster, the north Polar Spur, excess particle background, and/or unresolved background sources (although we expect the blank sky background correction to largely account for any excess particle background and for unresolved background sources). To test for this excess we examined a region far from the center of NGC 4649 with sources removed from the region, using the blank sky data as background. We determined that there was in fact a detectable excess background that could be fit by an absorbed MEKAL plus power-law model with temperature keV (the abundance was essentially undetermined) and photon index . Allowing the absorption to vary from Galactic did not significantly alter the fit. This model was scaled by the solid angle of the source, frozen, and included in all spectral fits for diffuse sources, although in the brighter inner regions of NGC 4649 this component was negligible.
A summary of the best fitting spectral models is given in Table 3 for different components of the X-ray emission. The first column gives the origin of the spectrum, the second column lists the spectral model used, the third column gives the absorbing column, the fourth and fifth columns give the temperature and abundances (if relevant) for the softer component of the spectrum, the sixth column gives the power-law photon spectral index or temperature of the harder component in the spectrum, the seventh column gives the value of and the number of degrees of freedom (dof), and the last column gives the number of net counts (after background subtraction) in the spectrum.
5.1 X-ray Spectrum of Resolved Sources
Figure 5 shows the spectra of the sum of the sources within four effective radii (, 6.7 kpc) of the center of NGC 4649. Given the detection limit and density of background sources (Hasinger et al. 2001) we expect to find about 2 background AGN in this region. The spectra showed some evidence for weak emission lines, possibly indicating the presence of hot diffuse gas, even though local background spectra had been subtracted from the source spectra. In general, including a MEKAL or VMEKAL component in our models fit to the source spectra significantly improved the quality of the fits, and the best-fit parameter values closely matched those found for the diffuse gas in § 5.2. We conclude that the local background subtraction did not completely account for the diffuse emission component, most likely due to XMM-Newton’s relatively large PSF in combination with the steep brightness profile seen in the diffuse emission. Although symmetric local background regions should remove any linear gradient in the background, they will underestimate the background if the surface brightness has a negative second derivative (i.e., is concave downward), as is true for a beta-model galaxy surface brightness. Additionally, the large source regions and density of central sources made it difficult to simultaneously find ideal local background regions for all of the sources. On average, these effects led to an under-subtraction of the background emission. To compensate, we included the best-fit VMEKAL model to the diffuse emission within 3 (see § 5.2 and Table 3) to our models fit to the source spectra. In every case we tried including this component improved the quality of the fit. The results of model fits are given in Table 3.
We first considered models in which the spectra of the sources was represented by a single, hard component. Initially, we tried a thermal bremsstrahlung model with a temperature , which provided an acceptable fit with a per dof of . Since our analysis of Chandra data somewhat preferred a power-law model for the hard component over a bremsstrahlung model we also tried a power-law fit. This provided an even better fit, with a . The best-fit photon index of was was very close to that found from the Chandra data and for the unresolved sources in § 5.2. This fitted model is shown in Figure 5. We will adopt this as our best-fit model for the spectrum of the source population.
5.2 Diffuse X-ray Spectrum
We extracted the spectra for the diffuse emission from within three effective radii (, 6.7 kpc) of the center of NGC 4649 (Figure 6), excluding all sources except Src. 1. Strong emission lines are clearly present in the spectra that indicate that the emission is mainly thermal emission from hot interstellar gas, which is consistent with our previous results from Chandra (Paper I). The initial fits to the diffuse emission simultaneously using data from each of the EPIC instruments gave large abundance values, as compared with Chandra, with very large errors. Further analysis showed that the results for the PN data gave larger abundance values as compared to the MOS data, which were more consistent with Chandra results. Since we were unable to resolve these inconsistencies we omitted the PN data from all fits to the diffuse emission. Removing the PN from fits to the source spectra did not significantly alter the results, presumably due to the lack of strong lines in these spectra.
Based on the line emitting spectra we first tried a single temperature MEKAL model. This did not provide an acceptable fit. In particular, there was a deficit of hard emission in the model for photon energies keV. Since hard emission is expected from unresolved sources we added a power-law component to this model, which greatly improved the quality of the fit (see Table 3). The best fit photon index was , which agrees extremely well with the value found for the source spectral fits from Chandra data. For simplicity the photon index was set equal to this value and frozen for all subsequent fits to the diffuse emission.
As Table 3 shows, the basic absorbed MEKAL plus power-law model still does not provide a statistically acceptable fit to the data. Since previous work has found evidence for multiple temperature components and temperature gradients in this and other elliptical galaxies (e.g., Buote 2002; Paper I), we added a second MEKAL component to the previous model with the temperatures and normalizations allowed to vary and with the abundances of the two MEKAL components tied together. This provided a significantly improved fit, although it still was not very good. We also tried allowing the absorbing column to vary, but this did not improve the fit significantly.
The two temperature model still did not provide a statistically good fit to the data (chi-squared per degree of freedom ). An examination of the residuals showed that much of the contribution to the chi-squared of the fit was coming from regions near emission lines. This suggested that the elemental abundances did not simply scale with solar, confirming the result of our Chandra analysis. We therefore tried fitting the data with an absorbed VMEKAL plus power-law model. Initially we allowed each abundance value to vary independently, save that of He which was set to solar. Although most of the resulting abundances were very poorly constrained, their values suggested that the abundances could be divided into three groups: C, N, O, and Ca; Ne through Ar and Ni; and the third group being Fe by itself. We tried various other groupings, including the best grouping found with the Chandra data, but none of them provided as good a fit to the data. In particular, it seems necessary to allow iron to vary independently; grouping it with other elements in general worsened the fit.
Although the grouped VMEKAL plus power-law model provided an improved fit to the data (see Table 3) it still did not give a statistically good fit. One possible cause of this is the large number of counts in the spectrum and relatively small statistical uncertainties. If the systematic errors are comparable to or larger than the statistical ones, then the of the fit may be increased. Including a systematic error of 5%, which is roughly what is expected based on calibration analyses of the EPIC cameras (Kirsch 2003), decreased from 1.36 to 1.03 while the best fit parameter values remained essentially unchanged. We believe that the systematic errors in the spectral calibration may well be on the order of 5% or larger, and thus can affect the values. On the other hand, they do not appear to have an significant effect on the spectral fit parameters.
The spectra shown in Figure 6 show particularly strong lines from S, Si, and Fe. We therefore determined the Si/Fe and S/Fe ratios by fitting a modified VMEKAL model to the spectra. All other elemental abundances were allowed to vary freely, save that of He which was set to solar. The Si/Fe ratio is an indicator of what type of supernova (SN) explosions have enriched the diffuse gas. We find Si/Fe = 2.38 and S/Fe = 2.34. Model calculations have found that for Type Ia SN the Si/Fe ratio is (Nomoto et al. 1984), while observational studies of metal-poor Galactic stars find that the average products of Type II SN have -element abundances 2-3 times larger than the Fe abundance (e.g., Edvardsson et al. 1993; Nissen et al. 1994; Thielemann et al. 1996). We therefore conclude that the diffuse gas in NGC 4649 was most likely enriched by more by SN II than by SN Ia.
5.3 Radial Variation in the Spectrum of the Diffuse Component
The spectral properties of the diffuse emission as a function of radius were examined to search for radial temperature and abundance gradients in the gas. We divided the diffuse emission into concentric annuli centered on the galactic center such that each annulus had at least 3000 net counts per instrument and was at least 10″ (0.81 kpc) wide, and extracted spectra from each annulus (with source regions subtracted). The annuli were required to be at least the 10″ in width to avoid effects of XMM-Newton’s PSF, which set the widths of the inner annuli. The resulting 9 annuli are defined in Table 4 (emission from larger radii was dominated by the excess background emission discussed in § 5). For each model discussed in this section the photon index of the unresolved sources was fixed at .
5.3.1 Projected Spectra
We first attempted to fit the observed spectra uncorrected for projection effects. We chose a simple MEKAL plus power-law model to simplify the comparison with the results from the deprojected spectra given in § 5.3.2. The results are given in Table 4. The resulting temperature profile is consistent with our results from Chandra observations; the gas temperature is a bit hotter within the central 10″, drops to a minimum between 20-50″ (1.6-4.1 kpc), and rises again in the outer regions. Unfortunately, the abundance values are much too poorly constrained to allow detection of any radial variations, although one might note that the abundance of the outer annulus appears to be lower than that of any other. The large abundance errors are most likely due to the fact that much of the emission is in lines so that the continuum emission from H is faint, leading to large errors in the abundance ratios relative to hydrogen. In general, the normalization factors for the mekal components are poorly constrained, which one would expect if this were the case.
Table 4 also shows that, although some of the fits at larger radii are adequate, the fits to the central regions are not. One possible explanation for this is that when observing the central regions we must look through the outer regions, which will in general contaminate the spectra. Fortunately, XMM-Newton’s large collecting area provided us with enough counts (3000 per instrument per annulus) to do a spectral deprojection to account for this effect. In the next section we describe the deprojection and give the results.
5.3.2 Deprojected Spectra
We first fit the emission in the outermost annulus using the same MEKAL plus power-law model with Galactic absorption as used for the projected annular fits. The best-fit values were then frozen and added to the fit for the next inner annulus, with the normalizations adjusted to account for geometric effects. The model component normalizations were fit and frozen independently for each camera since the different chip geometries lead to different fractional area covered by chip gaps for each camera in each annulus. We continued this process, fitting annuli and freezing the best fit values for the fit to the next annulus in, all the way to the center of the diffuse emission. The results are given in Table 5. The temperature profile is essentially the same as seen for the projected fits, with a slightly larger difference in temperatures between the hotter core and the cooler region just outside the core (presumably because the deprojection has removed the influence from the gas in outer annuli). The ’s of the fits to the central three annuli are essentially unchanged. We conclude that while projection effects can noticeably influence our fitting results in the central region of NGC 4649, it is unlikely that they are solely responsible for the poor quality of the fits in this region.
As indicated in Table 5, the abundance values for the fourth and fifth annuli from the center were essentially undetermined. It is interesting to note that the projected Chandra spectra show anomalously large abundance errors in the same region (between 38-54″, or 3.1-4.4 kpc). It is possible that the spectra in this region are contaminated by some unresolved source that biases the abundance values. Since the abundances were essential unconstrained, the best-fit temperatures were only very slightly affected by varying the abundances over a wide range of values. Although it would be interesting to look at this region in more detail, for the purposes of this paper we simply conclude that the abundance values are undetermined and that the observed temperature gradient is not greatly affected by this uncertainty.
We next tried different spectral models for the innermost annulus. The best-fit models for the total spectrum of the diffuse emission (§ 5.2) include several temperature components with a wider range of temperatures than seen in the deprojected annular spectra. This suggests that the gas may be locally multiphase in its thermal structure. Thus, we first tried fitting the deprojected spectra of the innermost annulus with two MEKAL components with their abundances set equal. This provided only a slightly improved but still not ideal fit ( = 2.06). As was also the case with the projected spectra, we found that much of the contribution to the of the fit originated from regions near lines, suggesting that the individual elemental abundances do not simply scale with solar. We therefore tried a VMEKAL model with the elements grouped in the same way as they were for the fits to the total diffuse emission (§ 5.2). Although this provided only an improved fit, with = 1.45, it is still not a statistically good fit. We therefore tried a two-temperature VMEKAL model with tied abundances, thereby allowing for a two-phase ISM with abundance values that do not scale with solar. The fit was somewhat improved, with = 1.29. The best fit temperatures were 1.425 and 0.741, while the best fit abundances were 0.0 for C, N, O, and Ca; 2.7 for Ne, Mg, Si, S, Ar, Al, Na, and Ni; and 1.4 for Fe. Though this is still not an ideal fit in the statistical sense, we note that the fit statistic is only somewhat larger than that of the outermost annulus, where the projection effects are unimportant. Furthermore, one might expect the goodness of the fit to be degraded since the models used for the innermost annuli to deproject the emission from the central region were statistically poor fits to the data. Lastly, we tried adding a cooling flow component (mkcflow) to our models in lieu of a second MEKAL or VMEKAL component to model the cooler emission. Adding this component only slightly improved the fit () over the single temperature model, and the fit was inferior to that of the two-temperature VMEKAL model. We therefore conclude that the central emission is best modeled by a two-temperature thermally emitting gas with non-solar abundance ratios.
5.4 Density Profile
The X-ray surface brightness profile was determined by accumulating counts in circular annuli, excluding point sources, and correcting for both exposure and the blank sky background. We used 70 annular bins between 0-303″defined such that each bin had net counts from each MOS camera. This profile was deprojected to give the gas density profile, assuming that the temperature and abundance of the gas was uniform. The emissivity of the gas was derived from the MEKAL component of the best-fit MEKAL plus power-law spectral model for the total emission within 303″. The resulting electron number density profile is plotted in Figure 7. It is in reasonable agreement with the density profile derived by Trinchieri, Fabbiano, & Kim (1997) using ROSAT-PSPC observations.
This procedure assumes that the spectrum of the gas (i.e., the abundance and temperature) is the same everywhere. However, the density is only weakly dependent on the spectrum, and as Tables 4 & 5 show the temperature and abundance do not vary greatly as a function of radius (although some abundance values are poorly constrained). Therefore our results should not be strongly affected by this assumption.
6 Structure in the Diffuse Emission
In our paper on a Chandra observation of NGC 4649 we reported finding evidence for structure in the diffuse emission. Specifically, we found faint radial “fingers” reaching out from the center of NGC 4649, and a central X-ray bar, about 5″ (0.41 kpc) long, which appeared to coincide with 4.86 GHz radio emission. In this section we present additional results on these features provided by the XMM-Newton data. Additionally, we present evidence for a previously undetected feature, a faint filament of diffuse emission extending to the northeast from the center of NGC 4649.
6.1 Radial Features
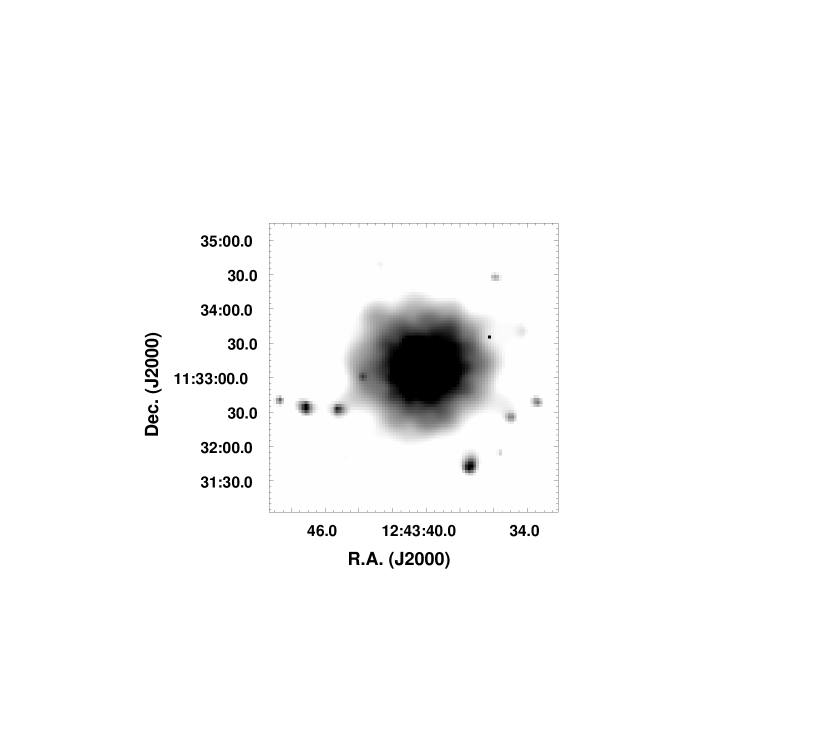
The smoothed image of the core of NGC 4649 in Figure 8 shows faint radial fingers of diffuse emission extending from the core. Qualitatively, these features appear similar to those seen in the corresponding Chandra image, although they are somewhat less defined due to XMM-Newton’s relatively large PSF. This similarity reinforces our previous conclusion that these structures represent real features, and are not an artifact of the telescope support structure. To check the statistical significance of these features, we defined a set of regions containing the most obvious fingers, as was done with Chandra. The regions were slightly further from the center of NGC 4649 than the Chandra regions to minimize the impact of blurring the fingers by XMM-Newton’s PSF. We considered only the raw data with Chandra source regions removed, unsmoothed and uncorrected for exposure, to ensure that the fingers were not an artifact of the smoothing process. For all analyses pertaining to the fingers we considered only data from the MOS instruments. The PN data were not used since chip gaps, bad columns, and the out of time event correction would have complicated the analysis. We then compared the average surface brightness of these regions to that of other regions between the fingers at the same distance form the center of NGC 4649. For the regions containing the fingers, we found on average (1.740.04) counts s-1 pix-1 and (1.470.03) counts s-1 pix-1 for the regions without fingers (1- errors). The excess of counts in the regions containing fingers was therefore significant at the 5.4 level.
Azimuthal brightness variations in the regions of the fingers had previously been detected in the Chandra data. To test for these variations in the XMM-Newton data we again divided up an annulus, ranging from 25″ to 53″ (2.0-4.3 kpc) and centered on NGC 4649, into 20 angular bins, excluding Chandra source regions. The data from the two MOS instruments were combined to determine the total net flux per bin. An azimuthal plot of the net flux in each bin with 1- errors is given in Figure 9. Qualitatively this figure is similar to the analogous figure for Chandra, though the fingers are somewhat broader, most likely due to the increased PSF of XMM-Newton. Additionally, the fingers are more significantly detected with XMM-Newton despite the increased PSF since the larger collecting area and greater total counts provides a better SNR. A significance test was performed comparing the net flux in each bin to the mean net flux per bin. We found a reduced of , which confirms our previous conclusion that the azimuthal brightness profile is not well-described by a constant and that the fingers are likely real features in the diffuse emission.
In our Chandra analysis we compared the properties of the observed fingers to those produced in numerical hydrodynamical simulations of cooling flows in elliptical galaxies by Kritsuk, Böhringer, & Müller (1998). We now compare these fingers to those seen in more recent simulations by Kritsuk, Plewa, & Müller (2001, hereafter KPM), which implement a hybrid model that combines a subsonic peripheral cooling flow with an inner convective core. Their simulations predict outflowing bubbles of hot gas, surrounded by inflowing gas that is significantly cooler than the outflowing gas at the same distance from the galactic center, and a temperature profile that is raised in the center, drops to a minimum at a few kiloparsecs, then rises again in the outer regions (see their Figure 7). The shape of their predicted temperature profile qualitatively matches what we observe (see Table 5), although KPM find that the temperature profile varies by a factor of two or more, whereas the variations we observe are on the order of 14%. To compare the temperatures of the inflowing and outflowing gas to those predicted by KPM we fit spectra accumulated from the sum of the finger regions and from the regions in between the fingers, using the same MEKAL plus power-law model used to fit the spectrum of the diffuse emission. As with Chandra, the abundances in these fits were fixed at 0.6 solar. If the abundances were allowed to vary the resulting values were unreasonably high and had large errors. The temperatures and ’s given by the fits were not significantly affected by fixing the abundance values. The results of these fits are given in Table 3. The best-fit temperatures for the finger and off-finger regions closely matched those from fitting Chandra data, with the finger regions being slightly hotter than the off-finger regions but consistent within the 90% confidence intervals (difference is significant at the 2.1- level). In the KPM model, not only would would expect a larger temperature difference between the regions, but one would also expect the bright regions to be cooler than the darker regions, which is the opposite of what we find. Although we might expect some scaling differences between our observations and the KPM simulations, we would expect at least the sign of the temperature difference between the finger and off-finger regions to be the same. We therefore conclude that while some form of convective instability may explain the fingers seen in NGC 4649, the details are not reproduced by the KPM model.
6.2 Central Bar
We previously detected a 5″ (0.41 kpc) long bar located at the central peak of the diffuse emission using Chandra observations of NGC 4649. Unfortunately, this structure is too small to be resolved by XMM-Newton. However, as discussed in § 5.3, XMM-Newton’s large collecting area provided us with enough counts to deproject the spectrum of the diffuse emission and obtain more accurate spectral models for the central emission. We used the best fit MEKAL plus power-law model for the central region defined in Table 5, applied the appropriate Chandra response files, and renormalized the model until the number of net counts matched that detected for the X-ray bar by Chandra (about 900 net counts). The resulting MEKAL component normalization was then used to calculate the cooling time of the X-ray bar. We assumed a prolate ellipsoid geometry for the bar with semi-axes of 1.35″, 1.35″, and 3.55″ (0.11 kpc by 0.11 kpc by 0.29 kpc). The resulting integrated cooling time was about yr. We note that there is precedence for cooling times of yr in the central regions of elliptical galaxies (e.g., Bregman & Athey 2004666Available at http://www.astro.virginia.edu/coolflow/proceedings/150.pdf.; Lowenstein et al. 2001). This short cooling time suggests that the bar is a transient feature. One possible cause is accretion onto the central source detected by Soldatenkov, Vikhlinin, & Pavlinsky (2003), which they interpret as a quiescent supermassive black hole.
7 Filament
Figure 1 appears to show a faint filament extending from the northeast of NGC 4649 that curves to the east and extends from about 23 to 70. To determine the statistical significance of this feature we compared the net counts (0.3–5.0 keV) in a region containing the filament to those in identical rotated regions on either side of the filament, with source regions removed. We found an excess of counts in the filament region at a very high level of significance, suggesting that it may be a real feature.
Spectra of the filament and off-filament regions are shown in Figure 10. Since the filament spectra showed some emission lines we attempted to model the filament and off-filament spectra with an absorbed MEKAL model in the 0.3–5.0 keV range (with absorption fixed at the Galactic value). This provided a reasonable fit, with a lower temperature and higher abundance in the filament region as compared to the off-filament regions (see Table 3). However, the reduced ’s were high. An examination of the residuals showed that the model underestimated the hard emission for both the filament and off-filament regions. Since we expect some contamination from point sources in the region (potentially both galactic and background sources), we added a power-law component to the model, which provided a much improved fit. Unfortunately, the resulting abundance values were unreasonably large and were essentially unconstrained. We therefore froze the abundance values at 60% solar, a value which we believe to be representative of the abundance in the outer regions of NGC 4649 (see Table 4). This fitted model is shown in Figure 10 for the filament and off-filament regions. The best-fit temperatures and their errors were essentially unaffected by freezing the abundance values. We conclude that the diffuse emitting gas in the region of the filament has a lower temperature than the surrounding gas and may also have a higher abundance (though the latter is unclear).
One potential worry with the above analysis is that the off-axis PSF is large enough for a significant fraction of source counts to be outside the 18″ radius source regions used to remove sources. Since the filament contains more detected sources than the neighboring off-filament regions one might worry that the excess of counts on the filament was due solely to scattered source counts, though the clear presence of lines in the filament spectra as compared to the off-filament spectra would seem to argue against this interpretation. As a further test, we compared the fluxes from the power-law components of the filament and off-filament models and found that the flux from the off-filament component was larger by more than a factor of two. This suggests that the excess of counts in the region of the filament is not due mainly to sources, but to diffuse emission. We conclude that the filament is a real feature, though further observations would be useful to verify this claim.
8 Conclusions
We have presented results from a XMM-Newton observation of the X-ray bright elliptical galaxy NGC 4649. Both bright diffuse emission and point sources are detected, with the bright diffuse emission dominating the overall emission.
A total of 158 discrete sources were detected, although we have limited our discussion to the 47 sources found within four effective radii of the center of NGC 4649. Seven of these sources had possible faint optical counterparts in the DSS image of the same field. Of these seven, two had positions listed in the USNO-B1.0 catalog. We find that 23 of the sources match the positions of one or more sources detected with Chandra. Out of the 8 of these sources with well-determined luminosities 3 showed evidence for a varying luminosity between the Chandra and XMM-Newton observations. In addition, XMM-Newton detected 5 sources not found with Chandra, suggesting that these sources brightened significantly between observations. Some sources may be associated with the companion Sc galaxy NGC 4647. In particular, Src. 21 was within 3″ of the optical center of NGC 4647 and had very soft X-ray colors, which is consistent with this source being a detection of diffuse gas associated with NGC 4647. We did not detect X-rays from the Type I supernova SN1979a in NGC 4647.
The composite X-ray spectrum of the resolved sources within 4 is best described by a power-law with a photon spectral index of . The spectrum of the diffuse emission is reasonably well-described by a VMEKAL plus power-law model, where the elements are split into three abundance groups. This argues that the diffuse emission is a combination of emission from diffuse gas and unresolved LMXBs and that the elemental abundances of the combined diffuse emission do not simply scale from solar ratios. We find a Si/Fe ratio of ¿ 2, suggesting that the diffuse gas was mainly enriched by Type II SN. Deprojection of the diffuse emission shows a temperature profile that is hot in the outer regions of the galaxy, cools to a minimum temperature closer to the center, and rises again in the central 0.8–1.6 kpc. The deprojected spectrum of the central region is well described by a two-temperature VMEKAL model with abundance ratios that do not scale from solar, although the abundance values are poorly determined.
We confirm the existence of faint radial features in the diffuse emission, seen in Chandra images (Paper I), extending from the center of NGC 4649. The properties of these fingers were compared to those of similar features seen in simulations using a hybrid cooling flow/convective core model for giant elliptical galaxies performed by Kritsuk et al. (2001). We find that although some properties, such as the galactic radial temperature profile and the morphology of the fingers, match those predicted by the simulations, the relative temperatures of the finger and off-finger regions are inconsistent with the simulations. We conclude that although some form of convective instability may explain these features, they are inconsistent with the specific predictions of the KPM model.
The deprojected spectrum for the central region was used to model the diffuse emission in the region of the X-ray bar observed with Chandra (Paper I). We find an integrated cooling time of yr in the region of the bar. We conclude that the bar is a transient hydrodynamical feature. One possible cause is the central source detected by Soldatenkov, Vikhlinin, & Pavlinsky (2003), which they interpret as a quiescent supermassive black hole.
We find evidence for a filament of diffuse emission, extending to the NE of NGC 4649 and curving slightly eastward. The filament appears to be cooler than the surrounding gas and it may also have a higher abundance. It is possible that the filament is the result of a tidal interaction, possibly with the nearby spiral NGC 4647, although the symmetric morphology of both NGC 4647 and NGC 4649 would seem to argue against this interpretation.
References
- (1)
- (2) Allen, S. W., di Matteo, T., & Fabian, A. C. 2000, MNRAS, 311, 493
- (3)
- (4) Barbon, R., Cappellaro, E., Ciatti, F., Turatto, M., & Kowal, C. T. 1984, A&AS, 58, 735
- (5)
- (6) Blanton, E. L., Sarazin, C. L., & Irwin, J. A. 2001, ApJ, 552, 106
- (7)
- (8) Bregman, J. N., & Athey, E. A. 2004, in Proceedings of The Riddle of Cooling Flows in Galaxies and Clusters of Galaxies, ed. T. Reiprich, J. Kempner, & N. Soker (Charlottesville: U.Va.), E45
- (9)
- (10) Buote, D. A. 2002, ApJ, 574, L135
- (11)
- (12) Condon, J. J., Frayer, D. T., & Broderick, J. J. 1991, ApJ, 101, 362
- (13)
- (14) Dickey, J. M., & Lockman, F. J. 1990, ARA&A, 28, 215
- (15)
- (16) Edvardsson, E., Andersen, J., Gustafsson, B., Lambert, D. L., Nissen, P. E., Tomkin J. 1993, A&AS 275, 101
- (17)
- (18) Faber, S. M., Wegner, G., Burstein, D., Davies, R. L., Dressler, A., Lynden-Bell, D., & Terlevich, R. J. 1989, ApJS, 69, 763
- (19)
- (20) Fabbiano, G., Kim, D.-W., & Trinchieri, G. 1994, ApJ, 429, 94
- (21)
- (22) Hasinger, G., et al. 2001, A&A, 365, L45
- (23)
- (24) Kirsch, D. 2003, EPIC Status of Calibration and Data Analysis Issue 2.1, Document XMM-SOL-CAL-TN-0018, XMM-Newton Science Operations Centre
- (25)
- (26) Kritsuk, A., Böhringer, H., & Müller, E. 1998, MNRAS, 301, 343
- (27)
- (28) Kritsuk, A., Plewa, T., & Müller, E. 2001, MNRAS, 326, 11
- (29)
- (30) Lowenstein, M., Mushotzky, R. F., Angelini, L., & Arnaud, K. A. 2001, ApJ, 555, L21
- (31)
- (32) Lumb, D. 2002, EPIC Background Files Issue 2.0, Document XMM-SOL-CAL-TN-0016, XMM-Newton Science Operations Centre
- (33)
- (34) Matsumoto, H., Koyama, K., Awaki, H., Tsuru, T., Lowenstein, M., & Matsushita, K. 1997, ApJ, 482, 133
- (35)
- (36) Monet, D. G., et al. 2003, AJ, 125, 984
- (37)
- (38) Nissen, P. E., Gustafsson, B., Edvardsson, B., & Gilmore, G. 1994, A&A, 285, 440
- (39)
- (40) Nomoto, K., Thielemann, F-K., & Wheeler, J. C. 1984, ApJ, 279, 23
- (41)
- (42) Randall, S. W., Sarazin, C. L., & Irwin, J. A. 2004, ApJ, 600, 729 (Paper I)
- (43)
- (44) Read, A. M., & Ponman, T. J. 2003, A&A, 409, 395
- (45)
- (46) Sarazin, C. L., Irwin, J. A., & Bregman, J. N. 2000, ApJ, 544, L101
- (47)
- (48) Sarazin, C. L., Irwin, J. A., & Bregman, J. N. 2001, ApJ, 556, 533
- (49)
- (50) Soldatenkov, D., Vikhlinin, A., & Pavlinsky, M. 2003, AstL, 29, 298
- (51)
- (52) Thielemann, F-K., Nomoto, K., & Hashimoto, M. 1996, ApJ, 460, 408
- (53)
- (54) Tonry, J. L., Dressler, A., Blakeslee, J. P., Ajhar, E. A., Fletcher, A. B., Luppino, G. A., Metzger, M. R., & Moore, C. B. 2001, ApJ, 546, 681
- (55)
- (56) Trinchieri, G., & Fabbiano, G. 1985, ApJ, 296, 447
- (57)
- (58) Trinchieri, G., Fabbiano, G., & Kim, D-W. 1997, A&A, 318, 361
- (59)
- (60) van der Marel, R. P. 1991, MNRAS, 253, 710
- (61)
- (62) White, R. A., Bliton, M., Bhavsar, S. P., Bornmann, P., Burns, J. O., Ledlow, M. J., & Loken, C. 1999, AJ, 118, 2014
- (63)
| Src. | Name | R.A. | Dec. | Count Rate | SNR | H21 | H31 | PN | M1 | M2 | |||
|---|---|---|---|---|---|---|---|---|---|---|---|---|---|
| No. | (h:m:s) | (::) | () | ( s-1) | Notes | ||||||||
| (1) | (2) | (3) | (4) | (5) | (6) | (7) | (8) | (9) | (10) | (11) | (12) | (13) | (14) |
| 1 | XMMJJ 124340.2+113308 | 12:43:40.18 | 11:33:08.4 | 2.94 | 12417.7877.97 | 161.94 | 1646.73 | SMHT | SMHT | SMHT | a | ||
| 2 | XMMJJ 124338.0+113210 | 12:43:37.96 | 11:32:10.7 | 66.76 | 37.907.67 | 4.97 | 5.03 | S | ST | b | |||
| 3 | XMMJJ 124336.4+113220 | 12:43:36.43 | 11:32:20.5 | 72.45 | 22.256.59 | 3.42 | 2.95 | M | b | ||||
| 4 | XMMJJ 124345.1+113233 | 12:43:45.13 | 11:32:33.1 | 83.74 | 48.125.29 | 9.12 | 6.38 | HT | MHT | HT | c,d | ||
| 5 | XMMJJ 124334.9+113228 | 12:43:34.94 | 11:32:28.1 | 85.72 | 105.258.95 | 11.79 | 13.96 | SMHT | MHT | SMT | b,c,e | ||
| 6 | XMMJJ 124334.6+113343 | 12:43:34.56 | 11:33:43.2 | 86.77 | 65.077.71 | 8.52 | 8.63 | MHT | MT | ST | |||
| 7 | XMMJJ 124337.4+113143 | 12:43:37.45 | 11:31:43.5 | 94.60 | 297.5012.01 | 24.83 | 39.45 | SMHT | SMHT | SMHT | b,c | ||
| 8 | XMMJJ 124334.4+113358 | 12:43:34.39 | 11:33:58.2 | 95.70 | 43.506.85 | 6.45 | 5.77 | T | MT | HT | |||
| 9 | XMMJJ 124346.3+113336 | 12:43:46.31 | 11:33:36.0 | 95.97 | 11.493.54 | 3.23 | 1.52 | c | |||||
| 10 | XMMJJ 124342.7+113438 | 12:43:42.73 | 11:34:38.3 | 96.69 | 16.954.44 | 3.83 | 2.25 | H | c,d | ||||
| 11 | XMMJJ 124335.8+113155 | 12:43:35.76 | 11:31:55.7 | 97.35 | 54.037.56 | 7.23 | 7.17 | MT | ST | ST | |||
| 12 | XMMJJ 124335.8+113425 | 12:43:35.77 | 11:34:26.0 | 98.22 | 79.487.69 | 10.50 | 10.54 | SMHT | MT | SMT | c,d,e,f,g | ||
| 13 | XMMJJ 124333.4+113240 | 12:43:33.41 | 11:32:40.6 | 101.48 | 75.267.34 | 10.38 | 9.98 | MHT | MHT | MHT | b,c | ||
| 14 | XMMJJ 124347.3+113235 | 12:43:47.29 | 11:32:35.4 | 112.32 | 119.649.22 | 13.11 | 15.87 | MHT | MHT | HT | c | ||
| 15 | XMMJJ 124335.9+113123 | 12:43:35.92 | 11:31:23.1 | 122.88 | 20.245.77 | 3.50 | 2.68 | c,h | |||||
| 16 | XMMJJ 124348.7+113302 | 12:43:48.72 | 11:33:03.0 | 128.10 | 8.812.84 | 3.06 | 1.17 | c | |||||
| 17 | XMMJJ 124349.0+113242 | 12:43:49.00 | 11:32:42.7 | 134.78 | 22.505.20 | 4.39 | 2.98 | H | h | ||||
| 18 | XMMJJ 124332.1+113418 | 12:43:32.06 | 11:34:18.1 | 135.24 | 19.854.05 | 4.87 | 2.63 | T | H | b,c,g | |||
| 19 | XMMJJ 124332.2+113143 | 12:43:32.24 | 11:31:43.3 | 143.68 | 37.195.16 | 7.30 | 4.93 | HT | HT | HT | c | ||
| 20 | XMMJJ 124330.1+113318 | 12:43:30.11 | 11:33:18.5 | 145.85 | 22.793.73 | 6.06 | 6.96 | HT | HT | b,c,i | |||
| 21 | XMMJJ 124332.7+113453 | 12:43:32.71 | 11:34:53.2 | 148.85 | 77.436.82 | 11.39 | 10.27 | ST | ST | ST | b,g,j,k | ||
| 22 | XMMJJ 124347.6+113529 | 12:43:47.65 | 11:35:29.9 | 179.14 | 18.384.77 | 3.95 | 2.44 | T | |||||
| 23 | XMMJJ 124351.8+113356 | 12:43:51.81 | 11:33:56.0 | 179.19 | 9.633.08 | 3.16 | 1.28 | b,c | |||||
| 24 | XMMJJ 124341.3+113009 | 12:43:41.28 | 11:30:09.7 | 181.40 | 13.913.97 | 3.51 | 1.85 | c | |||||
| 25 | XMMJJ 124348.9+113518 | 12:43:48.86 | 11:35:18.2 | 182.39 | 13.484.25 | 3.20 | 1.79 | ||||||
| 26 | XMMJJ 124328.0+113402 | 12:43:28.03 | 11:34:02.5 | 183.75 | 20.243.94 | 5.18 | 2.68 | MT | HT | b,c | |||
| 27 | XMMJJ 124335.9+113607 | 12:43:35.88 | 11:36:07.0 | 186.99 | 23.874.16 | 5.90 | 3.17 | ST | HT | b | |||
| 28 | XMMJJ 124343.1+113008 | 12:43:43.07 | 11:30:08.4 | 187.24 | 39.074.95 | 7.89 | 5.18 | SMT | ST | T | c | ||
| 29 | XMMJJ 124336.6+113008 | 12:43:36.65 | 11:30:08.5 | 188.38 | 665.8514.84 | 44.95 | 88.30 | SMHT | SMHT | SMHT | b,c,e,h,j | ||
| 30 | XMMJJ 124344.6+113003 | 12:43:44.57 | 11:30:03.5 | 198.35 | 25.764.06 | 6.40 | 3.42 | T | HT | T | b,c | ||
| 31 | XMMJJ 124347.1+113020 | 12:43:47.09 | 11:30:20.7 | 198.82 | 16.243.80 | 4.33 | 2.15 | T | b,c | ||||
| 32 | XMMJJ 124346.6+113008 | 12:43:46.59 | 11:30:08.1 | 206.15 | 16.093.75 | 4.28 | 2.13 | T | b | ||||
| 33 | XMMJJ 124332.8+113001 | 12:43:32.84 | 11:30:01.3 | 216.38 | 116.046.55 | 17.82 | 15.39 | SMHT | SMHT | SMT | |||
| 34 | XMMJJ 124337.3+113646 | 12:43:37.26 | 11:36:46.7 | 220.23 | 27.643.61 | 7.83 | 3.67 | SMHT | SMT | b,c | |||
| 35 | XMMJJ 124330.9+113008 | 12:43:30.93 | 11:30:08.6 | 225.48 | 26.724.25 | 6.24 | 3.54 | SMT | |||||
| 36 | XMMJJ 124348.6+113619 | 12:43:48.56 | 11:36:19.2 | 226.83 | 11.443.60 | 3.25 | 1.52 | ||||||
| 37 | XMMJJ 124326.9+113515 | 12:43:26.94 | 11:35:15.2 | 229.24 | 32.734.22 | 7.82 | 4.34 | MT | T | MT | c,h,g | ||
| 38 | XMMJJ 124325.8+113120 | 12:43:25.85 | 11:31:20.6 | 235.37 | 58.554.75 | 12.33 | 7.76 | SMHT | SMHT | SMHT | b,h | ||
| 39 | XMMJJ 124342.1+113727 | 12:43:42.06 | 11:37:28.0 | 259.50 | 23.243.65 | 6.46 | 3.08 | T | MT | T | c,h | ||
| 40 | XMMJJ 124353.3+113618 | 12:43:53.32 | 11:36:18.2 | 271.22 | 12.293.28 | 3.68 | 1.63 | ST |
| Src. | Name | R.A. | Dec. | Count Rate | SNR | H21 | H31 | PN | M1 | M2 | |||
|---|---|---|---|---|---|---|---|---|---|---|---|---|---|
| No. | (h:m:s) | (::) | () | ( s-1) | Notes | ||||||||
| (1) | (2) | (3) | (4) | (5) | (6) | (7) | (8) | (9) | (10) | (11) | (12) | (13) | (14) |
| 41 | XMMJJ 124325.6+113017 | 12:43:25.62 | 11:30:18.0 | 272.83 | 23.703.07 | 7.64 | 7.24 | SMHT | MT | b,h,i,j | |||
| 42 | XMMJJ 124356.1+113051 | 12:43:56.06 | 11:30:51.7 | 273.48 | 12.073.29 | 3.63 | 1.60 | T | b | ||||
| 43 | XMMJJ 124327.4+112938 | 12:43:27.40 | 11:29:38.2 | 281.61 | 47.834.29 | 11.14 | 6.34 | SMHT | SMHT | HT | |||
| 44 | XMMJJ 124320.8+113240 | 12:43:20.79 | 11:32:40.8 | 284.09 | 17.513.47 | 5.00 | 2.32 | ST | |||||
| 45 | XMMJJ 124320.4+113504 | 12:43:20.43 | 11:35:04.3 | 309.64 | 27.203.74 | 7.36 | 3.61 | HT | HT | HT | |||
| 46 | XMMJJ 124337.5+112801 | 12:43:37.48 | 11:28:01.4 | 311.03 | 45.234.50 | 10.10 | 6.00 | SMHT | MHT | HT | |||
| 47 | XMMJJ 124357.4+113625 | 12:43:57.37 | 11:36:25.8 | 321.34 | 15.343.02 | 5.11 | 2.03 | MT | T | b,j |
Note. — The units for are ergs s-1 in the 0.3–12 keV band.
| Origin | Model | aaSrc. 1 is is extended, and appears to be a combination of diffuse structure with one or more point sources. | Abund.bbSource is near a chip gap or bad column on one or more instruments. Position and count rate may be inaccurate | or | /dof | Net Cts. | |
|---|---|---|---|---|---|---|---|
| 1020cm-2 | (keV) | (solar) | (keV) | ||||
| Sources | bremsstrahlung | (2.2) | 4.40 | 653/770=0.85 | 14464 | ||
| Sources | powerlaw | (2.2) | 1.76 | 575/770=0.75 | 14464 | ||
| DiffuseccPossible Chandra X-ray counterpart. | mekal | (2.2) | 0.823 | 0.37 | 5522/988=5.59 | 72587 | |
| DiffuseccOnly data from the MOS instruments were used for these fits. | mekalpowerlaw | (2.2) | 0.794 | 0.81 | (1.78) | 1307/427=3.06 | 72587 |
| DiffuseccOnly data from the MOS instruments were used for these fits. | mekalmekalpowerlaw | (2.2) | 0.766/1.512 | 1.08 | (1.78) | 1065/425=2.50 | 72587 |
| DiffuseccOnly data from the MOS instruments were used for these fits. | vmekalpowerlaw | (2.2) | (1.78) | 578/425=1.36 | 72587 | ||
| 1.67 | |||||||
| FingersccOnly data from the MOS instruments were used for these fits. | mekalpowerlaw | (2.2) | (0.6) | (1.78) | 119/75=1.59 | 1978 | |
| Off FingersccOnly data from the MOS instruments were used for these fits. | mekalpowerlaw | (2.2) | (0.6) | (1.78) | 116/77=1.51 | 2200 | |
| FilamentccOnly data from the MOS instruments were used for these fits. | mekal | (2.2) | 117/66=1.77 | 1427 | |||
| FilamentccOnly data from the MOS instruments were used for these fits. | mekalpowerlaw | (2.2) | 0.765 | 0.17 | 1.57 | 65/64=1.02 | 1427 |
| Off FilamentccOnly data from the MOS instruments were used for these fits. | mekal | (2.2) | 1.66 | 0.02 | 254/101=2.52 | 2149 | |
| Off FilamentccOnly data from the MOS instruments were used for these fits. | mekalpowerlaw | (2.2) | 0.847 | (0.17) | 2.06 | 194/100=1.94 | 2149 |
| Radii | Abund. | /dof | Net Cts. | |
|---|---|---|---|---|
| (″) | (keV) | (solar) | (MOS1/MOS2) | |
| 0 - 10 | 0.820 | 2.3 | 442/199=2.22 | 5395/5729 |
| 10 - 20 | 0.781 | 1.8 | 349/206=1.69 | 6181/6388 |
| 20 - 30 | 0.746 | 2.0 | 295/178=1.70 | 4425/4392 |
| 30 - 40 | 0.765 | 8.2 | 247/157=1.57 | 3350/3270 |
| 40 - 52 | 0.764 | 2.3 | 194/153=1.27 | 3145/3243 |
| 52 - 68 | 0.809 | 1.4 | 226/156=1.45 | 3057/3125 |
| 68 - 93 | 0.814 | 2.7 | 246/170=1.45 | 3128/3326 |
| 93 - 130 | 0.838 | 0.8 | 209/182=1.15 | 3074/3172 |
| 130 - 194 | 0.848 | 0.2 | 267/231=1.16 | 3030/3306 |
| Radii | Abund. | /dof | |
|---|---|---|---|
| (″) | (keV) | (solar) | |
| 0 - 10 | 0.845 | 2.2 | 432/197=2.19 |
| 10 - 20 | 0.803 | 2.5 | 342/204=1.68 |
| 20 - 30 | 0.724 | 1.7 | 291/172=1.69 |
| 30 - 40 | 0.773 | 29.2 | 243/155/=1.57 |
| 40 - 52 | 0.717 | 5.7 | 191/151=1.26 |
| 52 - 68 | 0.804 | 1.1 | 226/154=1.47 |
| 68 - 93 | 0.802 | 13.3 | 244/168=1.45 |
| 93 - 130 | 0.835 | 2.5 | 209/180=1.16 |
| 130 - 194 | 0.848 | 0.23 | 256/229=1.12 |