PROBING THE COEVOLUTION OF SUPERMASSIVE BLACK HOLES AND QUASAR HOST GALAXIES11affiliation: Based on observations with the NASA/ESA Hubble Space Telescope, obtained at the Space Telescope Science Institute, which is operated by AURA, Inc., under NASA contract NAS5-26555.
Abstract
At low redshift, there are fundamental correlations between the mass of supermassive black holes () and the mass () and luminosity of the host galaxy bulge. We investigate the same relation at . Using virial mass estimates for 11 quasars at to measure their black hole mass, we find that black holes at high- fall nearly on the same versus -band magnitude () relation (to mag) as low-redshift active and inactive galaxies, without making any correction for luminosity evolution. Using a set of conservative assumptions about the host galaxy stellar population, we show that at (10 Gyr ago) the ratio of / was 3–6 times larger than today. Barring unknown systematic errors on the measurement of , we also rule out scenarios in which moderately luminous quasar hosts at were fully formed bulges that passively faded to the present epoch. On the other hand, 5 quasar hosts at are consistent with current day - relationship after taking into account evolution, appropriate for that of E/S0 galaxies. Therefore, host galaxies appear to fit the hypothesis they are fully formed early-type galaxies. We also find that most quasar hosts with absolute magnitudes brighter than = cannot fade below galaxies today, regardless of their stellar population makeup, because their black hole masses are too high and they must arrive at the local - relationship by .
1 INTRODUCTION
There are currently galaxies in which a supermassive black hole (BH) has been directly measured using stellar and gas dynamics (e.g., reviews by Barth 2004 and Kormendy 2004). With a large number of secure detections, several correlations have been discovered between the mass of the BHs and the global properties of the galaxy bulge, such as its stellar velocity dispersion (), mass (), and luminosity (e.g., Kormendy & Richstone 1995; Magorrian et al. 1998; Ho 1999; Gebhardt et al. 2000a; Ferrarese & Merritt 2000; Kormendy & Gebhardt 2001, Häring & Rix 2004). What makes the correlations even more striking is the relatively small amount of intrinsic scatter; the relation between and (Gebhardt et al. 2000a, and Ferrarese & Merritt 2000) has only a scatter of (0.3 dex; Tremaine et al. 2002) in . In the original discovery, the relationship between and the bulge luminosity appeared weaker, with a scatter of 0.5 dex (Magorrian et al. 1998, Kormendy & Gebhardt 2001). When the bulge luminosity () is translated into mass, one finds that the ratio of the BH mass to the bulge mass is / 0.0012 (Kormendy& Gebhardt 2001, Merritt & Ferrarese 2001, and McLure & Dunlop 2002). These remarkable findings leave little room to doubt that the formation and evolution of BHs and galaxy bulges are closely tied. Understanding why provides fundamental insights toward a coherent understanding of galaxy formation and evolution in general.
To study the coevolution of black holes with galaxy bulges, there is a great deal of interest in investigating the correlations at higher redshifts. In this study, we explore the versus the -band luminosity () relation of the galaxy bulge out to . The - correlation has been studied by McLure & Dunlop (2002), and Bettoni et al. (2003) for galaxies, and is an extension of the studies pioneered by Kormendy & Richstone (1995) and Magorrian et al. (1998). Since Kormendy & Richstone’s (1995) original finding, which was based on -band images of nearby galaxies, there have been many efforts to sharpen the correlation using larger samples and/or redder passbands (Magorrian et al. 1998; Ho 1999; Kormendy & Gebhardt 2001; Laor 2001; Merritt & Ferrarese 2001; McLure & Dunlop 2002; Bettoni et al. 2003; Marconi & Hunt 2003, Ivanov & Alonso-Herrero 2003). The RMS scatter of the correlation, when both early- and late-type galaxies with measurements are taken into account, is fairly large ( dex; Kormendy & Gebhardt 2001; Marconi & Hunt 2003). When attention is focused on just the early-type galaxies, several studies find the scatter in the -bulge luminosity relation drops to 0.3-0.45 dex (Erwin, Graham, & Caon 2002, McLure & Dunlop 2002; Bettoni et al. 2003; Marconi & Hunt 2003). While it is not clear what causes the larger scatter in late-type galaxies, one of the complications is that it is not always straightforward to obtain bulge luminosities, which is hard to uniquely separate from the disk in late-type galaxies when the bulge does not have a classical de Vaucouleurs profile (e.g. Carollo 1999).
While measuring the bulge luminosity of normal (i.e. inactive) galaxies is feasible out to high , measuring the mass of their central black holes accurately is considerably more difficult. Currently, the most robust method for measuring in normal galaxies is through modeling the stellar and gas dynamics (e.g., Barth 2004 and Kormendy 2004). Doing so requires an exquisite spatial resolution on the order of the BH sphere of influence, , the radius at which the Keplerian orbital velocity of the stars due to the influence of the central BH is comparable to the stellar velocity dispersion of the bulge. This is feasible only for the nearest, and often relatively luminous, galaxies. The - relation in nearby galaxies offers an easier way to infer . However, despite the potential for extending this technique widely to infer to study bulge and BH evolution, in practice the technique is time consuming and has practical challenges: is difficult to measure in a variety of circumstances, including low-mass and low-surface brightness galaxies, distant galaxies, and galaxies in which the active nucleus substantially dilutes the starlight (Greene & Ho 2005a). More fundamentally, to study the co-evolution of BHs with galaxy bulges, it is desirable to measure using a technique that is more directly associated with the influence of a black hole, especially at high , rather than one which is tied to the bulge.
On the other hand, active galactic nuclei (AGNs), whose energetic output is a direct manifestation of supermassive black holes, are natural and promising candidates for measuring , using a technique known as the “virial” technique (e.g. see Ho 1999; Wandel, Peterson, & Malkan 1999). This technique is based on measuring AGN broad-line region (BLR) sizes and linewidths that have been subjected to reverberation mapping (Blandford & McKee 1982; Peterson 1993). These simple estimates appear to obey the - relation of inactive galaxies at low redshift () (Gebhardt et al. 2000b; Ferrarese et al. 2001; Nelson et al. 2004, Onken et al. 2004; Barth, Greene, & Ho 2005; Green & Ho 2005b), which provides an important cross-check on the validity of the AGN virial masses. For a sample of 34 low- Seyfert 1 nuclei and quasars with reverberation mapping data for the H line, Kaspi et al. (2000) showed that the BLR size correlates strongly with the AGN continuum luminosity. This provides a convenient shortcut to estimate BH masses essentially for any (unbeamed) broad-line AGN with a rest-frame optical spectrum. It offers a potential to extend the measurement of out to a large sample of objects, spanning a wide range in redshift. Since then, this virial mass measurement technique has been bootstrapped to higher redshifts using the ultraviolet lines C iv 1549 Å (Vestergaard 2002) and Mg ii 2798 Å (McLure & Jarvis 2002). The calibration sample, however, is small, currently based on objects.
Using the virial mass technique, the measurement of supermassive BHs has now been extended out to large redshifts in a large number of quasars. Their numerical abundance at high redshift () and their high luminosities make them ideal primary tracers for BH evolution, thus their host galaxies prime candidates for studying galaxy evolution. The trade-off for having an easy proxy for measuring in quasars is that detecting quasar host galaxies is a much harder task compared with studying inactive galaxies at high (i.e., ). The difficulty in extracting robust parameters for the host galaxy in the glare of a luminous quasar is well known. It is worth pointing out that even with the exquisite 005 resolution images of the Hubble Space Telescope (HST) in the optical, the task remains nontrivial because of the small host galaxy size and its low surface brightness, which decreases as . Despite technical challenges, careful observations are detecting more and more quasar hosts at high , even from the ground, using deep imaging and adaptive optics (Fynbo, Burud, & Møller 2002; Lacy et al. 2002; Hutchings 2003; Sánchez & González-Serrano 2003, Kuhlbrodt et al. 2005).
In this study we explore the vs. relationship for quasar host galaxies out to . We use the virial technique to estimate in quasars, combined with -band luminosity of the bulge of quasar host galaxies, inferred from HST studies of Kukula et al. (2001), Ridgway et al. (2001) and Peng et al. (2005). At low quasars brighter than primarily live in elliptical galaxies (McLeod & Rieke 1995 and Dunlop et al. 2003), and there are hints that indicate hosts at may be early-types as well. In particular, Kukula et al. (2001) and Sánchez & González-Serrano (2003) find that the luminosities and scale lengths of galaxies are consistent with a passively evolving scenario, and, moreover, that they follow the Kormendy relation (the correlation between half-light surface brightness and effective radius ). Therefore, in this study, we also explore the evolution in the - relationship by testing the null-hypothesis that the host galaxies evolve like E/S0 galaxies from a formation redshift of .
We note that at low redshift, the scatter in the - relationship for elliptical galaxies (McLure & Dunlop 2002 and Bettoni et al. 2003) is small enough that when extended to high redshift it can provide a sensitive and useful probe of the coevolution of BH masses with bulges. Black holes are a useful constraint for understanding galaxy evolution because only increases, which also makes it a way to age-date a galaxy. Coupled to , galaxies at any given redshift are restricted in how much they can fade in the two-dimensional diagram of vs. . They cannot freely roam the - diagram, limited on the one hand by the monotonicity of , on the other by the requirement that they evolve toward the tight local vs. relation at , and additionally by the local galaxy luminosity function and the mass function of supermassive black holes. Thus, at a given bulge mass, luminosity, and redshift, galaxies may follow a range of possible merger and luminosity evolution paths that are initially wide but progressively narrow as they evolve towards the tight local relations of versus luminosity. Generalizing the idea into -dimensional space, by measuring the vs. luminosity relation in several passbands, this “phase-diagram” may indicate the state of galaxies at high redshift relative to today. This may ultimately be a powerful, yet simple way to visualize and understand the complex paths of galaxy formation and evolution. The technique requires calibrating vs. luminosity at many passbands for local galaxies.
Our discussion below is structured in the following order. To obtain the - relation for quasar host galaxies, one of the first steps is to make k-correction to the host galaxy photometry (§ 2). In Section 3, we will then estimate the BH masses using the virial technique, compare them to a cruder estimate using the -luminosity relation for quasars determined by Peterson et al. (2004), and discuss the Eddington efficiencies of the quasars in the sample, using black hole masses estimated from the virial technique. Section 4 presents the results, and we conclude with brief remarks (§ 5). In this study, we use a standard cosmology with km-1 s-1 Mpc-1, , and .
2 DATA and BULGE k-CORRECTION
We assemble a set of data on quasar host galaxies published by Kukula et al. (2001), Ridgway et al. (2001), and Peng et al. (2005) observed using HST/NICMOS, summarized in Table 1. All the magnitudes shown in the Table have been corrected for Galactic extinction according to Schlegel, Finkbeiner, & Davis (1998), but not internal extinction. The Kukula et al. (2001) sample consists of 18 quasars at and , equally divided between radio-loud quasars (RLQ) and radio-quiet quasars (RQQ), while the Ridgway et al. (2001) sample consists of 5 RQQs at .
The Peng et al. (2005) study has one additional object, obtained using the gravitational lensing technique of the CASTLES survey (Kochanek et al. 1999). In that study, they find that the host galaxy has been stretched out into a luminous Einstein ring. After deprojection, where the lensing galaxy mass is assumed to be a singular isothermal ellipsoid, they recovered the intrinsic light distribution of the host galaxy (e.g. size, luminosity, axis ratio, etc.). The host galaxy Einstein ring in CTQ 414 is only modestly merged with the lensing galaxy light profile. Even so, because the shape of the host galaxy Einstein ring is so dramatically different azimuthally from the lensing galaxy, it is fairly easy to disentangle the two. They did so by modeling the lens deflection model, light profile of the lens, the host, and the quasar images – all simultaneously. In so doing, they find that the uncertainty of the host luminosity is roughly 0.2 mag. As we shall see, the result for this object would only start to be important if it were one magnitude brighter than our number. Even so, individually, no one object will significantly affect the overall conclusion. Thus this object alone serves mostly as a consistency check, as it is the most well-resolved object.
The data from all samples were observed in either NICMOS F110M ( band) or F160W/F165M ( band) filters so that they roughly correspond to rest-frame , where the contrast between the host and the quasar is favorable for detecting the host galaxy. Altogether, host galaxies are used in this study, which is the entire collection of data in the literature published specifically to study quasar host galaxies detected using NICMOS above . There are other host galaxies found at published using WFPC2 and ground-based data (e.g., Aretxaga, Terlevich, & Boyle 1998; Lehnert et al. 1999; Hutchings et al. 2002; Hutchings 2003). We exclude these because the observations were made in the rest-frame UV, which is very sensitive to star formation and extinction internal to the host galaxy. Therefore, -correcting to the rest-frame filter is highly dependent on assumptions of the spectral energy distribution (SED) of the galaxy. We also exclude ground-based data of RLQ hosts published by Falomo, Kotilainen & Treves (2001), Lacy et al. (2002), Sánchez & González-Serrano (2003), and Kuhlbrodt et al. 2005, to keep the sample uniform and to avoid potential uncertainties with the quasar-host separation relative to data obtained uniformly with HST.
To infer the -band absolute magnitude () of the quasar host galaxy bulge from the raw values published in Kukula et al. (2001), Ridgway et al. (2001), and Peng et al. (2005), we make several corrections. We note that the published host galaxy fluxes primarily refer to the bulge because the images are too shallow to detect the diffuse components of extended disks if they exist, except for CTQ 414 (Peng et al. 2005). For that object, we take the bulge luminosity only. We point out that since the local black hole versus bulge relation excludes the disk component, as we shall see, a proper removal of a disk would further strength our conclusions by making the bulges fainter. Ridgway et al. (2001) compared their host galaxy detection with simulations, from which they determined the host galaxy flux as a function of the morphological type. Thus, for their sample, to obtain the -band bulge luminosity shown in Table 1, we apply an aperture correction (their Table 4) to their 101 aperture photometry (their Table 2), and a correction that is dependent on assumptions about the morphology of the host (their Table 5), appropriate for radio galaxies, which have the largest corrections in their study. Finally, to convert published photometry into a rest-frame, standard Cousins, -band flux, we follow Hogg et al. (2004) in computing detailed -corrections. We transform the HST Vega-based magnitudes to -band by using galaxy templates observed by Coleman, Wu, & Weedman (1980), multiplied by the appropriate filter transmission curves. The integrated fluxes are normalized to a spectrum of -Lyr, “observed” in the appropriate bandpass.
Computing -corrections to the host galaxy’s rest-frame -band relies on having an SED. We have no color information for most of the host galaxies so we must make an assumption. The filters used by Kukula et al. (2001; and ) and Ridgway et al. (2001; ) conveniently capture the hosts in their rest-frame (except for two objects at in Ridgway et al. 2001). Therefore, -correction to rest-frame is not very sensitive to assumptions of the SED for both the quasar or the host galaxies, especially as the -filter lies redward of the rest-frame 4000 Å break in galaxies. Specifically, the difference in the inferred between an early and late-type SED is only mag at and mag at . For the -correction we use an SED of current-day E/S0s for the host galaxies because it is the most conservative assumption with regard to the conclusions we are testing (i.e. weakening it), despite it being less sensible than other potential models. All other more realistic SEDs at are likely to be bluer, thus the inferred host luminosities would be systematically fainter than the values shown in Table 2.
3 BLACK HOLE MASS ESTIMATE and EDDINGTON RATIO
3.1 Virial Measurement
For high redshifts, the virial technique relies on measuring the quasar continuum luminosity and the widths (FWHM) of the C iv (1549 Å) or Mg ii (2798 Å) emission line. At the Mg ii emission line is the most convenient feature to use because it falls into optical bandpasses where the atmosphere is transparent and where CCDs are sensitive. Likewise, at C iv is the line of choice. Compared to the H line, C iv is produced much closer to the supermassive black hole (by factor of ). As such there are concerns that the kinematics of the BLR, not well understood, may be dominated by non-Keplerian motions such as winds and outflows. Concerns about the UV emitting clouds being caught up in a disc also meant that the width of the emission lines may depend strongly on the viewing angle. Despite uncertainties in the BLR physical structures, the same virial product that is used to estimate black hole masses in AGNs using H is found to have analogs in the UV with C iv or Mg ii lines, over the luminosity range present in our AGN sample (Vestergaard et al. 2002, McLure & Jarvis 2002, Kaspi et al. 2005). The assumption we will make is that the same technique applies to quasars at high redshifts.
The high redshift calibration for C iv was performed by Vestergaard (2002)111She used a cosmology of km s-1 Mpc-1, , and .. In viral estimates of there is a geometric normalization factor, , that depends on the structure and kinematics of the BLR, and which normalizes the AGN - to that of the quiescent galaxies. This factor was determined empirically by Peterson et al. (2004) and Onken et al. (2004), to be for the H BLR (under an assumption that FWHM). In the absence of a large sample to determine , the effective normalization used in Kaspi et al. (2000) corresponded to , so that the new estimates are a factor of higher than previously estimated in Kaspi et al. (2000). With these caveats, M. Vestergaard (2005, private communication) provided the following relation to estimate from C iv (1549 Å), appropriate for our adopted cosmology:
| (1) |
where is the spectral density of the quasar continuum at rest-frame 1350 Å. The value of the exponent () and the coefficient (4.5) depend on the sample used in the fit and the fitting technique (BCES [Akritas & Bershady 1996] vs. FITEXY [Press et al. 1992]). There may be small systematic differences, but they are otherwise formally equivalent to within the errors (Kaspi et al. 2005).
For quasars Mg ii (2798 Å) is a good surrogate for estimating that conveniently falls in the visible region (McLure & Jarvis 2002). Again, we renormalize their empirical relation by a factor of to obtain:
| (2) |
To obtain the C iv and Mg ii emission line FWHM in quasars with host detections, we searched the literature for published spectra. In total, we compile 16 (out of a total of 24) objects that have published spectra or estimated FWHM values – 11 at and 5 at . The Ridgway et al. (2001) sample comes from a survey published by Zitelli et al. (1992), while the Kukula et al. (2001) sample is a composite of different surveys shown in Table 1. For CTQ 414, we obtained an uncalibrated spectrum at the Magellan telescope. We note that the quasar spectra published in Boyle et al. (1990) used by Kukula et al. (2001) sample have very uncertain flux calibrations, and likewise for CTQ 414. However, what matters more to our analysis is the FWHM values, given that the absolute fluxes are determined by photometry (see below). Moreover, because the continuum luminosity enters into Eqs. 1 and 2 at most as the power of 0.53 (0.47 for Mg ii), even a flux uncertainty as large as a factor of 2 translates into an uncertainty in of at most 0.2 dex, which will not affect our conclusions. To measure the widths of the emission lines that do not have published values, two of the authors independently measured the FWHM manually from compiled spectra, in a double-blind test. The two independent measurements of the FWHM agree well. One other potential uncertainty in measuring the FWHM is that the broad emission lines may be contaminated by Fe ii emission (Vestergaard & Wilkes 2001). Fe ii contamination is more important for H and Mg ii lines (Vestergaard & Wilkes 2001), and much less for C iv. For the Mg ii line we do not have a way to estimate the Fe ii contribution, thus we do not correct for this effect. This is appropriate for the calibration performed by McLure & Jarvis (2002), which did not remove the Fe ii contamination as well. All of our objects use C iv measurements and only our objects rely on Mg ii lines.
To estimate the monochromatic luminosity of the quasars at and , we first -corrected to restframe -band, centered on 3745 Å, using a powerlaw SED that fits to apparent magnitudes in , and filters. The same SED is then used to extrapolate to 1350 Å or 3000 Å as required. To convert from -band magnitude to flux density we use the spectral irradiance value of erg s-1 cm-2 Å-1 (Colina, Bohlin, & Castelli 1996). There is a small conversion to take the -band magnitudes from literature, based on photographic plates (see Table 1), into the standard Vega-magnitude system. The magnitudes of the SGP objects from Boyle et al. (1990) were based on plate-scanned system (“-band”), zeropointed to the Johnson magnitude system. The conversion to the standard magnitude has a small offset for typical quasar colors: . In comparison, the random errors are generally larger, about 0.2-0.3 mag. Similarly, the magnitude of the MZZ objects from Zitelli et al. (1992) is based on photographic filter system. As the systematic corrections are small and will not affect our conclusions, we do not apply a correction. We correct the -band magnitudes for Galactic extinction, according to Schlegel, Finkbeiner, & Davis (1998).
This technique for measuring the quasar flux density near 1350 Å and 3000 Å is fairly robust, as the and filters cover a long baseline for estimating a powerlaw SED. Since the observed band also falls in the restframe UV, there is only a small amount of SED-dependent extrapolation. We compare estimates using our SED extrapolation with another crude method of directly converting observed -band and -band fluxes into . Both methods give nearly the same results. Contamination by emission lines in the broad-band filter is often negligible even in quasars because the bandwidths of the (FWHM = 890 Å) and (FWHM=1000 Å) filters are significantly larger than the widths of the lines (FWHM Å). The impact of such errors on is negligible () because the monochromatic luminosity enters into Eqs. 1 and 2 as the powers of 0.53 and 0.47, respectively. All the transformed values are shown in Table 2. For CTQ 414 and 4C 45.51 we take the average of estimates from the C iv and Mg ii techniques.
Lastly, we point out that with only two objects, 4C 45.51 and CTQ 414, that have both C iv and Mg ii simultaneously observed it is not possible to check on systematic differences in the estimates: in 4C 45.51, the inferred black hole mass is comparable between using C iv () and Mg ii (). In the other, CTQ 414, C iv yields a factor of 2 larger BH mass than Mg ii. However, in a separate study using gravitationally lensed quasars at (Peng et al. in prep), including 4 other objects that have simultaneous C iv and Mg ii observations, the two methods appear not to have a systematic offset.
3.2 -Luminosity (LQSO) Relation of Quasars
Using virial estimates of , it has been pointed out that, to first order, BH masses correlate with the unresolved AGN optical/UV luminosity (e.g. see Kaspi et al. 2000; Oshlack, Webster, & Whiting 2002; Peterson et al. 2004). This correlation is an empirical statement that while the distribution of Eddington ratio in AGNs is large, there might be a preferential efficiency over an average lifetime once they are “turned on.” This typical might also depend on the luminosity range of AGN sample under consideration. For nearby AGNs the mass-luminosity relation of quasars is shown in Peterson et al. (2004) to be 222All logarithms are base 10.:
| (3) | |||||
For objects which we do not have spectral information to determine accurate virial BH masses, we can obtain a more crude estimate through this -LQSO relation. We also point out that Eq. 3 is based on measurements of nearby AGNs, and currently there is little reason to believe that the same normalization would apply to luminous quasars at where the distribution of luminosities, Eddington ratio, and AGN lifetimes, may be somewhat different (e.g. see Kollmeier et a. 2005). The goal of this crude method is thus only to gauge how a bigger scatter, uncertainties in the overall BH mass normalization and small number statistics, can affect interpretation. And we emphasize that our final conclusions are based only on virial estimates alone.
3.3 Eddington Ratios of Quasars
From estimates using the virial technique and assuming that the bolometric luminosity ), as also assumed by Peterson et al. (2004) and Kaspi et al. (2000), we can estimate the Eddington ratio, , for 11 quasars at , and 4 at , which have published spectra as a check for any unusual objects (e.g. ). For quasars which lack the required -band magnitude, we assume , which corresponds to a continuum of (Vanden Berk et al. 2001). Table 2, Col. 11, shows the Eddington ratio computed for 15 quasars that have virial estimates. All the quasars in our sample have , with the only object, 4C 45.51, which is radio loud, near the Eddington limit. The Eddington ratio spans a wide range from , with the top two highest efficiencies being RLQs and the bottom two being RQQs. This is probably due to a selection effect since Kukula et al. (2001) selected RLQ and RQQ quasars that are well matched in optical luminosities, but required RLQs to be extremely radio luminous ( Jy sources, or to ). Because our sample size is small, and because a number of RLQs and RQQs are missing virial measurements, the issue of a correlation between radio loudness and BH mass and , at a given redshift, cannot be addressed here. We only note that such claims of a correlation are controversial even at low-: while several studies (e.g. Pagani, Falomo, & Treves 2003; Dunlop et al. 2003; and McLure & Dunlop 2001) find that RLQs tend to have more massive and more powerful quasars than RQQs at low , several other studies find little to no correlation (e.g. Ho 2002; Woo & Urry 2002; Oshlack, Webster, & Whiting 2002; Gu, Cao, & Jiang 2001).
3.4 Measurement Uncertainties
In this study, the robustness of the conclusions relies on understanding the sources for both systematic and random errors. In light of systematic errors, the best way to minimize potential doubts is to apply all known systematic errors (by offsetting the data) towards weakening the final conclusions. Specifically, this can be done by using conversions that yield systematically small and bright host luminosities. We therefore take measures to do so, as described below. In this section we summarize the known sources of random and systematic errors, some of which are collected from previous discussions.
There are several important sources of random errors when trying to interpret the scatter in the plots. In particular, the literature measurement of the emission-line widths are probably uncertain by due to manual measurements and complications from absorption-line features and probable Fe ii contamination. This produces roughly a random scatter of dex in , while lines which are absorbed in the wings may produce underestimates. The uncertainty in the measurement using the virial technique has about 0.3-0.4 dex in scatter (factor of 2.5; Kaspi et al. 2000, Vestergaard 2002, and McLure & Jarvis 2002, Peterson et al. 2004), which is also random. The uncertainties of the host galaxy magnitudes are better quantified: typically mag (Ridgway et al. 2001 and Kukula et al. 2001). -correction introduces both a systematic bias (by assuming the reddest possible SED) and a random component (the intrinsic SED scatter of the hosts). In the -LQSO method of estimating , one uncertainty is in the intrinsic scatter in converting optical luminosity, using ), into bolometric luminosity. This is effectively factored into the estimate of from ), shown in Eq. 3. As will be evident, photometric errors (quasar and host galaxy luminosities) will not obfuscate the conclusions, because they are small compared to the intrinsic scatter in empirical relationships between -, and the virial technique in estimating . And the results are robust against even these random sources of error.
On the other hand, the robustness of the conclusion will depend entirely on the treatment of systematic issues. We address this issue by applying known errors to the data in a way to yield a smaller and more luminous host galaxies, thereby weakening the conclusions in the outcome. For instance, in computing the host galaxy , the main systematic error comes from the quasar removal. In Ridgway et al. (2001) they find after running simulations that the amount of over-subtraction of the host galaxy flux depends on the host morphology. Thus, we choose a morphology correction that results in our hosts being typically 0.3–0.5 mag brighter than quoted in their study. In Kukula et al. (2001), they perform 2-dimensional image decomposition, using a de Vaucouleurs model profile to extrapolate the host both into the core and out to the wings. Fortunately, assuming a de Vaucouleurs profile often tends to overestimate host fluxes if the intrinsic profile is shallower, e.g. an exponential. Furthermore, they hold fixed the effective radii to 5–10 kpc in the fit – large compared with even typical quasar hosts at (i.e. measured through gravitational lensing, Peng et al. in prep.), and Lyman break galaxies (Trujillo et al. 2005). We thus feel confident about taking their host measurements at face value to be reliable upper limits. In converting to restframe -magnitude, there are uncertainties also in the -correction: we again decide to err on the side of overestimating the host luminosity by assuming a red SED, typical of present-day E/S0 galaxies. The difference between a red SED and a typical Lyman-break galaxy SED is only about 0.3 magnitudes in restframe out at , when observed in the -band. In addition, most of the NICMOS images are not sufficiently deep to ascertain whether the hosts are bulge or disk dominated; we attribute all the host galaxy light to the bulge, which is also a conservative assumption.
The systematic errors for estimating are managed in the following way. In particular, there is some uncertainty in the luminosity dependence (expressed via the exponent, , in Eqs. 1 and 2) of the broad line radius in using the virial mass estimators. Depending on the line fitting technique used, and which sub-sample is being studied (e.g. high-luminosity vs. low-luminosity) ranges from , although a lower is preferred in the newest calibrations for the UV broad line regions (Kaspi et al. 2005). For the C iv virial estimate, the new calibration uses a value of (M. Vestergaard, private communication), while for Mg ii (McLure & Jarvis 2002). Also, in the virial estimate (§ 3.1) there is a potential systematic error in the “-factor” that normalizes the virial to the -. This normalization of , which increases by a factor of 1.8 compared to Kaspi et al. (2000), is based on a modest sample size of 16 objects (Onken et al. 2004). Since this is the best determined value currently we will utilize it. However, leaving it out weakens the result by 0.5 magnitude in , which, by coincidence, corresponds closely to results using the mass-luminosity relation to estimate . Even this measure would leave the qualitative conclusions unchanged, especially in light of other steps we have taken to weaken the conclusions; we will present both techniques side-by-side to emphasize this fact. In estimating BH masses using the -LQSO technique, Peterson et al. (2004) discuss in more depth the associated uncertainties. We note that the Y-intercept, , of Eq. 3 has a significant uncertainty of , potentially causing a small normalization difference in mass estimates between this and the virial technique. We also do not expect the normalization for low redshift AGNs be identical to high redshift objects because of different selection, and perhaps physical, issues.
There is one particular object, the RLQ 4C 45.51, which deviates significantly from others and it is worthwhile to discuss the relevant uncertainties. The uncertainty in the BH mass is not known, because the uncertainty in measuring the FWHM is not known. If one assumes the FWHM is in error by 50%, an unlikely high error, the error in estimating is dex. The potential that the quasar is beamed adds an unknown systematic error into the estimate of . For the host galaxy, Kukula et al. (2001) quotes a generic errorbar for the ensemble of 0.75 mag, barring small uncertainties in -correction. All the known errors added constructively cannot explain its large departure from the other data points. Other indicators, such as the high Eddington ratio () and the extreme radio loudness ( to from 151 MHz to 37 GHz, e.g. Wiren et al. 1992; Hales, Baldwin & Warner 1993) point to the possibility that 4C 45.51 may be an exceptional object. Thus we will exclude this object from our discussions and analysis below.
Lastly, our conclusions rest crucially on the applicability of local virial calibrations to objects out at considerably higher redshift, , and that they apply for RLQs whose emission may be beamed towards us (Oshlack, Webster, & Whiting 2002; Greene & Ho 2005c). The propriety of applying these calibrations to luminous quasars is more rigorously discussed, e.g. in Netzer (2003) and Vestergaard (2004); we point out that the luminosity range of quasars in this sample is spanned by those used to calibrate the virial relationships locally.
In summary, to mitigate against systematic errors that may complicate the interpretation, we have added known systematic offset corrections to the data that would most weaken the conclusions. Therefore, any remaining deviation that we subsequently observe might be a lower bound on the true difference if all the sources of systematic errors are identified as discussed here.
4 RESULTS
4.1 - Relationship for Quasar Hosts
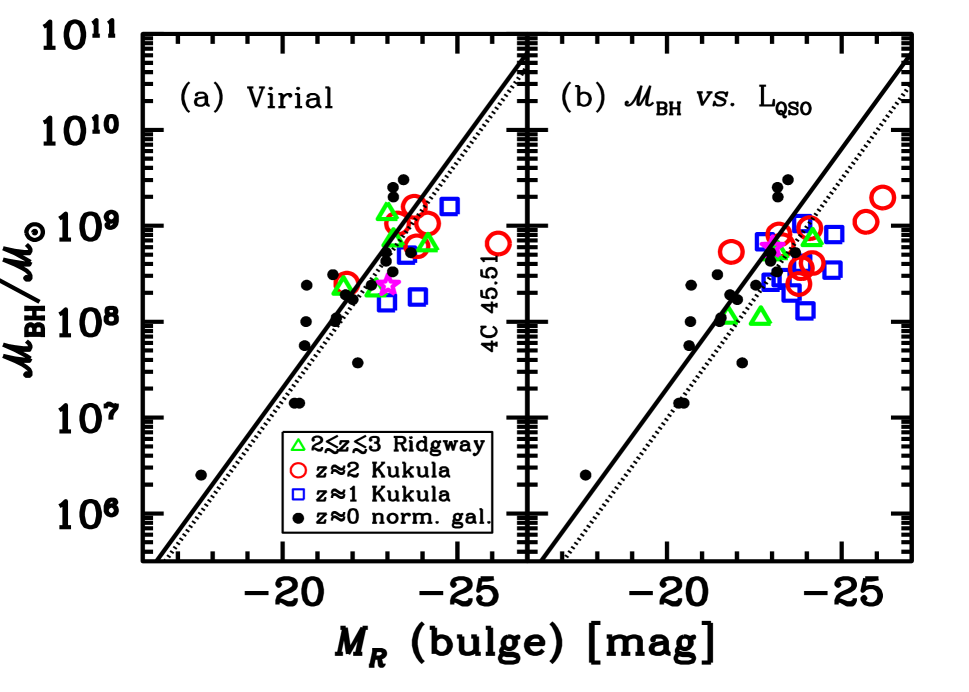
Figure 1 shows the - relationship derived for high- quasars (open symbols) based on the virial mass measurements (Fig. 1a) or on the mass versus quasar luminosity relation (Fig. 1b). The round solid points (“ norm. gal.”) are local calibrations of normal elliptical galaxies obtained in various studies. In particular, the measurements for sample are the revised values given in Tremaine et al. (2002), while their photometry is compiled from different sources and reprocessed into -band values by Bettoni et al. (2003). There are many measurements of other galaxy types that can be (and have been) placed onto this plot, such as radio galaxies (Bettoni et al. 2003) and low- quasar and Seyfert hosts (e.g., McLure & Dunlop 2002). All of them essentially fall along the solid line shown, and have comparable scatter (McLure & Dunlop 2002; Bettoni et al. 2003). The solid lines shown in Figures 1a and 1b are based on a fit to the normal galaxies data points (round solid) performed by Bettoni et al. (2003). Converting their cosmology ( km s-1 Mpc-1) into ours, the line has the following relation:
| (4) |
Consistency in the - Relation Between and . Figures 1a and 1b show a comparison of the techniques used to estimate BH masses out at high , illustrating curiously that most of the host galaxies already lie near the - relationship at . The quasar hosts appear to lie noticeably below the relation. However, as we have not yet accounted for luminosity fading, it is not yet obvious what is to be expected. Most of the attention should be focused on Figure 1a because the estimates of are more robust. Figure 1b merely confirms the fact that even with a larger scatter, and possibly a systematic normalization offset in BH mass, the result does not change significantly. Although the points using the crude estimate agree qualitatively with the virial estimates there are some notable exceptions that bring the average in Figure 1b considerably lower. The most discrepant points are the two extreme radio sources objects 4C 45.51 and B2 2156+29 from Kukula et al. (2001), at least one of which has high Eddington ratio. In Figure 1a, the correlation seen for objects is probably real and not due to strong selection effects in detecting the host galaxy, despite well-known challenges in extracting host galaxies from underneath luminous quasars. While one does expect selection bias to hamper finding hosts lying to the left of the sample points, this appears not to be a serious problem because 23 host are detected out of 24 targets in Kukula et al. (2001) and Ridgway et al. (2001). On the other hand, if host galaxies exist to the right of the sample points, they would be easier to detect. Thus, the fact that there is not a larger and a more uniform scatter to the right suggests that the - relation has already been established as early as , at least in RQQ hosts.
To further interpret Figures 1a and 1b, it is useful to keep in mind that regardless of where the high- quasar host galaxies lie, by they must scatter around the solid line representing the relationship for galaxies. Thus, it is surprising that ignoring any luminosity evolution, the - relation of quasar host galaxies at already falls near the same relation as local galaxies. To quantify the similarity of AGN hosts to the local relation we fit a line to the RQQ objects (shown as dotted lines in Fig. 1), holding the slope fixed to the value of determined for low- galaxies (Equation 4). As a caution we leave RLQ objects out of the fit because of possible issues with beaming and because of their higher Eddington ratios, as discussed in Section 3.3, even though most objects do not deviate far from RQQs. There is only one object which is radio loud in Figure 1a (4C 45.51) and 4 objects in Figure 1b – two of which have the highest host luminosity in the sample, and are the farthest outliers.
In Figure 1a, the horizontal offset between the dotted and solid lines is mag when RLQ, 4C 45.51 is excluded. If included, 4C 45.51 would single-handedly shift the dotted line further to the right by 0.3 magnitudes, even though it is only one out of 11 objects. The conclusions are largely immune to this shift, as evidenced later when evolution models are factored in. The average shift in Figure 1a is also somewhat biased by a single RQQ, MZZ 9592 (green triangle near ). This host is the second highest redshift object () in the sample, observed in restframe -band. Compared to a blue powerlaw SED () of coeval Lyman-break galaxies, this object has -correction value brighter by 1 magnitude (as opposed to mag for other hosts). In light of this and our use of the E/S0 SED for -correction, if the hosts are as blue as Lyman break galaxies, the agreement between and the local - relation would be even more striking, bringing the two closer by at least 0.3 magnitudes, bridging any difference between high bulges and normal galaxies.
In Figure 1b, the offset in the dashed line is larger, mag, which indicates a normalization difference between the two estimates of . This line also excludes 4 out of 10 objects, which are RLQ hosts; including them would shift the dashed line to the right by 0.2 magnitudes.
/ Ratio at . If the local - relation more fundamentally reflects a relationship between and , rather than with the bulge luminosity, then the fact that hosts lie near the same relationship as data is unexpected even before applying a correction for luminosity evolution. About half of hosts are nearly on the relation – more, if the SEDs of the hosts are bluer (hence fainter) than we have assumed. If the hosts starved their black holes (i.e. constant ) and there has been no galaxy merger since , this implies that the bulge mass was lower at high : as the host faded, more stars would have to be formed in concert to build up the bulge mass (luminosity), allowing the host galaxy to remain roughly fixed in the - diagram. We can constrain the / ratio at if we assume an evolutionary scenario that the RQQ host galaxies at are fully formed ellipticals. The offset between the dotted and solid lines (Figure 1a) allows a fading of mag on average since (less, if also increases or if the bulge SED is blue). Such a small amount of dimming is perhaps surprising, and we will discuss several possible evolutionary scenarios below. We show later that under the premise that the hosts evolve like E/S0 galaxies, simple evolution models predict fading by factors 1–2 magnitudes between and (Figure 2). In this scenario, Figure 1 then indicates that the / ratio at is higher than locally by a factor of 3–6. Rix et al. (1999, 2001), through studying the hosts of gravitationally lensed quasars, first noted that unless all the quasars are radiating near () the Eddington limit, the / ratio must be higher at high- than today. Ridgway et al. (2001) also came to this same conclusion using the same assumption. Here, the argument is made more stringent because the black hole mass is measured simultaneously with the host galaxy light, and the fact that can only grow with age.
Deviations from the - Relation. The largest departure from the dotted line in Figure 1a is 4C 45.51 at , and the two largest in Figure 1b are also radio loud quasar hosts, one of which is 4C 45.51. Taken at face value, its deviation is so large that the apparent correlation seen for most hosts in Figure 1a may not be clear-cut for all objects, if beaming is not an important factor to consider when estimating . However, it is important to keep in mind that this may have nothing to do with the issue of RLQ vs. RQQ hosts specifically. Rather, it could be a statement about massive vs. less massive galaxies in general. The object 4C 45.51 is a radio source whose extreme radio emissions would likely require an unusually massive BH to produce. If the - relation continues to hold at high-, then a selection on extreme (due to selecting on powerful radio sources) would then more efficiently pick out massive hosts, even if RLQ and RQQs are hosted by the same underlying parent distribution of galaxies. The location of 4C 45.51 in Figure 1a, especially, may show that massive, thus rare galaxies may be closer to their end-stage of evolution at than less massive ones.
On the other hand extreme radio loudness can itself indicate beaming, which might cause to be under-estimated in RLQs. If the RLQ emission is in fact beamed, the continuum luminosity alone would lead to an overestimate of by a factor proportional to , where now refers to the Lorentz factor, and a proportionality constant that depends on the viewing angle. For 4C 45.51, it may be that because of its near-Eddington luminosity. On the other hand, if the kinematics of the BLR are disc-like and the axis of the jet is aligned with the axis of the disc, we expect the FWHM of the broad emission lines in beamed objects to appear systematically narrower than their intrinsic width (Wills & Browne 1986). Since scales as FWHM2, the inclination effect may counteract the Doppler boosting. Thus, the net effect on measuring depends on better knowing the BLR inclination and the intrinsic . For RLQs with low inclination and low Doppler boosting, we probably underestimate . However, it is difficult to draw a strong conclusion without a larger sample of objects.
Finally, as we already pointed out but worth emphasizing, the horizontal shift in of the points in Figure 1 depends rather little on the E/S0 SED we assumed, and uncertainty about the potential of a disk component in the host. If we had assumed either a bluer SED, or assume that some fraction of the bulge light belongs to the disk, they would both necessarily shift the points to the left, further strengthening the conclusion that hosts at already lie close to the local - relation.
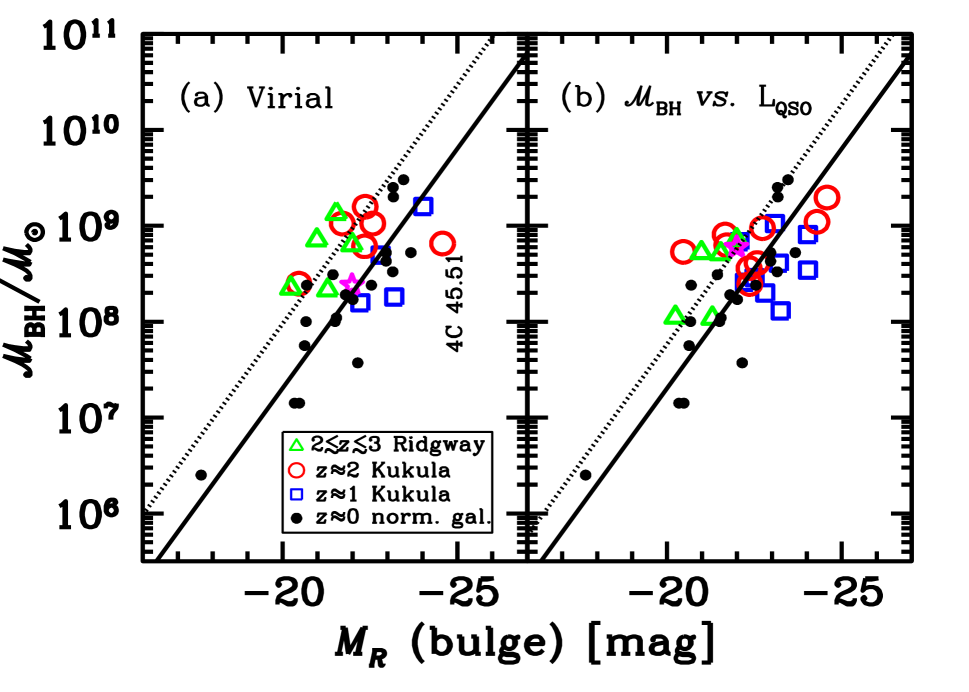
4.2 Host Galaxy Luminosity Evolution
The near coincidence in the - relation between RQQ hosts and the present epoch must reflect several compensating effects, as time has not stood still since . Therefore, it places interesting constraints how the host galaxies can evolve since the Universe was 2-3 Gyr old. At low (), McLeod & Rieke (1995) and Dunlop et al. (2003) show that most very luminous quasars ( mag) live in ellipticals, with the variety of host galaxies increasing towards lower-luminosity AGNs. At intermediate redshifts (), several studies (Kukula et al. 2001, Sánchez & González-Serrano 2003) also find that the hosts may be preferentially early-type. At , host galaxies are poorly resolved, but there is circumstantial evidence to suggest that they are also primarily ellipticals, fully formed. Hence, we test the quite natural null-hypothesis that the quasar host galaxies had fully formed stellar bodies and have merely faded since . Alternatively, the hypothesis can be phrased as: was the ratio of to the same at all earlier epochs than observed now?
The 0.3 mag displacement of the dotted line from the solid line in Figure 1a implies that host galaxies at a given appeared brighter in the past only by mag in . If host galaxies did only fade since , and by more than mag, they would now appear displaced off the relation (solid line). If the host galaxies at have bluer SED than assumed in our -corrections, the maximal fading rate would be even slower. For example, if we use the SED of an Scd-type galaxy in our -correction, the fading rate would be consistent with essentially mag – i.e. no luminosity fading. Of course, if they are to gain in , through accretion but not grow in , the allowed fading rate for consistency with would be smaller still.
To interpret the fading rate in terms of the host stellar population content, we generate a grid of stellar synthesis models from Bruzual & Charlot (2003) with a Salpeter initial stellar mass function. The two sets of models (Fig. 2) have formation redshift , i.e. universe age = {3.2, 1.2} Gyr, each with star formation rates that decrease exponentially with a decay time constant of Gyr, where corresponds to an instantaneous burst followed by passive evolution. For all the models except that for Gyr, we find that mag over the range . Figure 2b illustrates how the fading scenarios translate into color of the host galaxies. Only the models with Gyr evolve to early-type galaxy colors by ; they have a fading rate mag. The Gyr scenario results in a present day color 0.4–0.5 mag bluer than average early-type galaxies.
If the host galaxies were simply to fade (and do not gain in ), resulting in present-epoch early-type host galaxies we need to account for this luminosity evolution, before comparing to the local - relation. We do this in Figure 3 by taking the measurements of distant hosts (open symbols) from Figure 1 and simply shift the open points horizontally by an amount mag (see Figure 2), appropriate for a passively fading red bulge. Figures 3a and 3b show that in this scenario, quasar hosts at evolve onto the relationship. Some of the deviations may be explained by our -correction, or if the deviant galaxies underwent a starburst at . However, for host galaxies at , what is striking is that nearly all would evolve to be fainter than local galaxies with similar mass BHs. The average offset of RQQ hosts after such fading would now be at least 1.3 mag, and as high as mag, below the local - relation. Hence our data are inconsistent with simple evolutionary or passively fading models for an early-type galaxy. In fact, the only model that is marginally consistent with the present-day luminosity constraint, mag, requires an evolution that has a slow decline in star formation rate of Gyr, and that evolves to a blue galaxy ( mag) by (Fig. 2b). This is only possible if all descendants of RQQ hosts were blue bulges now. Even the most extreme case of an elliptical, fully formed by and passively fading, would have (van Dokkum & Franx 2001) – still three times larger than allowed for consistency with no mass evolution. On the other hand, for largely passive evolution of the host galaxy populations (with ), the only way to reconcile Figure 3 with the local - relationship is to require the hosts to undergo mergers that increase the galaxy stellar mass by (1.3 magnitude). However, in this process, they must not gain an equal proportion of at the merger, which only takes them parallel to the solid line. Our conclusions that hosts appear too faint to be reconciled easily with present-day counter-parts of the same would be even stronger for any other plausible -correction one could make.
In the discussion above we have not considered that may also evolve. We collect here a few other interesting implications gleaned from Figures 1 and 3:
-
•
If evolution occurs on the two-dimensional - plane, the curious fact that hosts already lie close to the relation implies that evolution happens mostly along the relation, allowing for a modest amount of fading. Black hole growth, fading and the acquisition of new stars through mergers or star-formation seem to be balanced.
-
•
The BH masses for most of the host galaxies in our study at are already higher than that expected for galaxies (, Brown et al. 2001). Therefore, regardless of the stellar population of the host galaxies brighter than mag (as in the Kukula et al. 2001 and Ridgway et al. 2001 sample), they cannot evolve to galaxies today and yet agree with the local - relation.
-
•
While the hosts at may subsequently increase in luminosity moderately via merging, and to increase , Figure 1 shows that the most massive BHs may not grow by 3 to 6 times without becoming more massive than the biggest BHs seen at low . If the bulge mass grows proportionally with , this would also suggest that the host galaxies do not increase in mass more than a factor of 3 to 6.
-
•
Figure 1b shows that the host galaxies of quasars are roughly as luminous as the hosts at for objects that have comparable ; Figure 1a is somewhat equivocal on this point because of the small number of points, despite the smaller scatter than in Figure 1b. The correspondence may be fortuitous. Our evolutionary scenario suggests that the hosts are consistent with a simple fading scenario for an E/S0 galaxy with , while the evolution of hosts may be more complex.
-
•
Because / ratio is higher in the past than today, this might suggest that the - relation has a different zeropoint earlier in time. Furthermore, if the dominant route of galaxy evolution since is by way of galaxy merging rather than in situ star formation, it would suggest that the - at high redshift has a steeper slope than that observed today (Gebhardt et al. 2000, Ferrarese & Merritt 2000). A steeper slope in the vs. plot might then allow galaxies (as they lie in Fig. 3) to grow in mass through mergers at a faster rate than the black hole mass, without evolving parallel to the local - relation.
5 DISCUSSION AND CONCLUSION
In this study, we have tested the hypothesis that both the stellar bodies of the host galaxies and the central black holes were fully formed by , evolving secularly thereafter. This is motivated by the evidence that hosts of luminous quasars live in elliptical galaxies (e.g. McLeod & Rieke 1995, and Dunlop et al. 2003). Moreover, several studies (e.g. Kukula et al. 2001, Sánchez & González-Serrano) argue that host galaxies as early as may be fully formed, early-types, undergoing passive fading. Our analysis of the existing data has shown that the - relation of high- quasar hosts is nearly identical to that of low- galaxies (Figure 1).
We have mostly focused our attention on objects. On the other hand, hosts do appear to deviate from the local - relationships in Figure 1, which suggests they may be fully consistent with a secularly evolving E/S0 model with . However, currently, this evidence is limited by small number statistics.
The close agreement between and relation is surprising given that the underlying correlation seen at is fundamentally one between and , and more superficially between and bulge luminosity. There are several ramifications of this finding, one of which is that the bulge luminosity does not evolve as much as simple stellar synthesis models would predict, thus allowing the bulge and to do so in near lock-step upwards. We have shown, using a set of conservative assumptions about the stellar population of the host, that the stellar bulge mass, , at a given , is probably lower in the past than today: If there is luminosity evolution, but no evolution, then the / ratio is larger at by almost the same factor that the galaxy dims due to passive evolution. Because fading (passive or otherwise) would cause the host galaxies at to significantly over-shoot the relation, there has to be a build up in stellar mass towards , whether by star formation or by mergers (without increasing in the same proportion). This was previously suggested by Rix et al. (1999, 2001) and Ridgway et al. (2001).
As BHs only increase in mass, Figure 1a puts a strong constraint on how much the host galaxies can fade to arrive at the local - relation by , regardless of their stellar population content at . Luminous host galaxies ( mag) with luminous quasars cannot fade to become galaxies today, unless the mass estimators calibrated locally systematically and significantly overestimate at high .
While this study supplies more questions than answers regarding the nature of galaxy-BH evolution, we show that the - diagram provides very useful constraints on the evolutionary paths of galaxies. Thus, it may be worthwhile to extend this diagnostic by establishing locally the empirical relationship between and bulge luminosity in multiple filters, since galaxies of different morphological types are expected to trace distinct paths in this space. In this parameter space of vs. multi-color bulge luminosity diagram the locus of points for high- galaxies can be used to predict the directions in which galaxies evolve. Galaxies in this diagram are not allowed to arbitrarily roam in color and luminosity because their evolutionary paths must ultimately take them to the local -bulge luminosity relationship. To understand how exactly galaxies traverse the phase diagram, it would be useful to obtain deep imaging of the environments of high- host galaxies in order to constrain their merger rates.
Thus far, we have not discussed how the presence of dust may affect our conclusions. Sub-mm observations of quasars (Isaak et al. 2002; Bertoldi et al. 2003; Knudsen, van der Werf, & Jaffe 2003) indicate that at least some host galaxies appear to be highly star forming and hence presumably highly obscured. If this were generically true of all high- hosts, what we observe in the rest-frame -band might be the dim light that filtered through a dense screen. In later phases, star formation may use up gas and dust, while supernovae explosions may blow holes in the ISM, causing host galaxies to become more transparent with time. If this were to happen, the net effect of the fading populations and the decreasing optical depth on the absolute luminosity of the host galaxies is not clear. It is conceivable that the host does not evolve much in optical luminosity, if the galaxy dust extinction dropped at the same rate as fading of the stars. The monkey-wrench thrown into the interpretation by the presumption of dust is yet another reason why it would be worthwhile to establish a multi-color vs. “phase” diagram, especially towards the rest-frame infrared. However, despite the possibility of dust, its presence must somehow conspire with star formation to preserve the good correlation seen at high- (Figure 1), over 4 magnitudes in host luminosity. This suggests that either the distribution of dust is regular across galaxy-types, or that dust obscuration is not too significant in a number of galaxies by .
In computing the -correction, we assumed an SED appropriate for a current-day E/S0 galaxy, but galaxies at are most likely to be bluer. Therefore the hosts are probably fainter in the rest-frame -band than what we computed, and the - relationship for hosts would be even more indistinguishable from normal galaxies. This conclusion relies heavily on the assumption that the techniques used to estimate at low do not systematically and significantly overestimate at high . Currently, all measurements are tied to locally calibrated values. It remains unproven that the AGN broad-line regions at high have similar structure at low . Because understanding the link between and galaxy bulges is fundamentally important to a coherent knowledge of galaxy evolution in general, it is important to more fully understand how locally calibrated measurement techniques apply to high .
Lastly, we prelude in the passing that a significantly larger sample of quasar host galaxies at from gravitational lensing has been analyzed to study the - relationship. The results from that study further strengthen the conclusions presented here (Peng et al. in preparation).
We thank Daniel Eisenstein, Ann Zabludoff, and Dennis Zaritzky, Marianne Vestergaard, Roeland van der Marel, Swara Ravindranath, and Masami Ouchi, for discussions and advice. We would also like to thank the anonymous referee for useful suggestions and comments. The work of CYP was performed in part under contract with the Jet Propulsion Laboratory (JPL) funded by NASA through the Michelson Fellowship Program. JPL is managed for NASA by the California Institute of Technology. CYP is also grateful to STScI for support through the Institute Fellowship Program. LCH is supported by the Carnegie Institution of Washington and by NASA grants from the Space Telescope Science Institute (operated by AURA, Inc., under NASA contract NAS5-26555). Support for EJB was provided by NASA through Hubble Fellowship grant #HST-HF-01135.01 awarded by the Space Telescope Science Institute, which is operated by the Association of Universities for Research in Astronomy, Inc., for NASA, under contract NAS 5-26555. This research has made use of the NASA/IPAC Extragalactic Database (NED) which is operated by the Jet Propulsion Laboratory, California Institute of Technology, under contract with the National Aeronautics and Space Administration.
References
- (1)
- (2) Akritas, M. G., & Bershady, M. A. 1996, ApJ, 470, 706
- (3)
- (4) Aldcroft, T. L, Bechtold, J., & Elvis, M. 1994, ApJS, 93, 1
- (5)
- (6) Aretxaga, I., Terlevich, R. J., & Boyle, B. J. 1998, MNRAS, 296, 643
- (7)
- (8) Barth, A. 2004, in Carnegie Observatories Astrophysics Series, Vol. 1: Coevolution of Black Holes and Galaxies, ed. L. C. Ho (Cambridge: Cambridge Univ. Press), in press
- (9)
- (10) Barth, A. J., Greene, J. E., & Ho, L. C. 2005, ApJ, 619, L151
- (11)
- (12) Bertoldi, F., Carilli, C. L., Cox, P., Fan, X., Strauss, M. A., Beeleen, A., Beelen, A., & Zylka, R. 2003, A&A, 406, 55
- (13)
- (14) Bettoni, D., Falomo, R., Fasano, G., & Govoni, F. 2003, A&A, 399, 869
- (15)
- (16) Blandford, R. D., & McKee, C. F. 1982, ApJ, 255, 419
- (17)
- (18) Boyle, B. J., Fong, R., Shanks, T., & Peterson, B. A. 1990, MNRAS, 243, 1
- (19)
- (20) Brown, W. R., Geller, M. J., Fabricant, D. G., & Kurtz, M. J. 2001, AJ, 122, 714
- (21)
- (22) Bruzual, G., & Charlot, S. 2003, MNRAS, 344, 1000
- (23)
- (24) Carollo, C. M. 1999, ApJ, 523, 566
- (25)
- (26) Coleman, G. D., Wu, C.-C., & Weedman, D. W. 1980, ApJS, 43, 393
- (27)
- (28) Colina, L., Bohlin, R., & Castelli, F. 1996, Instrument Science Report CAL/SCS-008
- (29)
- (30) Dunlop, J. S., McLure, R. J., Kukula, M. J., Baum, S. A., O’Dea, C. P., & Hughes, D. H. 2003, MNRAS, 340, 1095
- (31)
- (32) Erwin, P., Graham, A. W., & Caon, N. 2002, astro-ph/0212335
- (33)
- (34) Falomo, R., Kotilainen, J., & Treves, A. 2001, ApJ, 547, 124
- (35)
- (36) Ferrarese, L., & Merritt, D. 2000, ApJ, 539, L9
- (37)
- (38) Ferrarese, L., Pogge, R. W., Peterson, B. M., Merritt, D., Wandel, A., & Joseph, C. L. 2001, ApJ, 555, 79
- (39)
- (40) Fynbo, J. U., Burud, I., & Møller, P. 2002, NewAR, 46, 193
- (41)
- (42) Gebhardt, K., et al. 2000a, ApJ, 539, L13
- (43)
- (44) ——. 2000b, ApJ, 543, L5
- (45)
- (46) Greene, J. E., & Ho, L. C. 2005a, ApJ submitted
- (47)
- (48) ——. 2005b, ApJ submitted
- (49)
- (50) ——. 2005c, ApJ, 630, 122
- (51)
- (52) Gu, M., Cao, X., & Jiang, D. R. 2001, MNRAS, 327, 1111
- (53)
- (54) Häring, N., & Rix, H.-W. 2004, ApJ, 604, 89
- (55)
- (56) Hales, S. E. G., Baldwin, J. E., & Warner, P. J., 2003, MNRAS, 263, 25
- (57)
- (58) Ho, L. C. 1999, in Observational Evidence for Black Holes in the Universe, ed. S. K. Chakrabarti (Dordrecht: Kluwer), 157
- (59)
- (60) Ho, L. C. 2002, ApJ, 564, 120
- (61)
- (62) Hogg, D. W., Baldry, I. K., Blanton, M. R., & Eisenstein, D. J. 2004, astro-ph/0210394
- (63)
- (64) Hutchings, J. B. 2003, AJ, 125, 1053
- (65)
- (66) Hutchings, J. B., Frenette, D., Hanisch, R., Mo, J., Dumont, P. J., Redding, D. C., & Neff, S. G. 2002, AJ, 123, 2936
- (67)
- (68) Isaak, K. G., Priddey, R. S., McMahon, R. G., Beelen, A., Peroux, C., Sharp, R. G., & Withington, S. 2002, MNRAS, 329, 149
- (69)
- (70) Ivanov, V. D., & Alonso-Herrero, A. 2003, Ap&SS, 284, 565
- (71)
- (72) Jackson, N., & Browne, I. W. A. 1991, MNRAS, 250, 414
- (73)
- (74) Jauncey, D. L., Batty, M. J., Wright, A. E., Peterson, B. A., & Savage, A. 1984, ApJ, 286, 498
- (75)
- (76) Kaspi, S., Smith, P. S., Netzer, H., Maoz, D., Jannuzi, B. T., & Giveon, U. 2000, ApJ, 533, 631
- (77)
- (78) Kaspi, S., Maoz, D., Netzer, H., Peterson, B. M., Vestergaard, M., & Jannuzi, B. T. 2005, ApJ, 629, 61
- (79)
- (80) Knudsen, K. K., van der Werf, P. P., & Jaffe, W. 2003, A&A, 411, 343
- (81)
- (82) Kochanek, C. S., Falco, E. E., Impey, C. D., Lehár, J., McLeod, B. A., & Rix, H.-W. 1999, in After the Dark Ages: When Galaxies were Young (the Universe at 2 5), ed. S. Holt & E. Smith (New York: AIP), 163
- (83)
- (84) Kollmeier, J. A., et al. 2005, astro-ph/0508657
- (85)
- (86) Kormendy, J. 2004, in Carnegie Observatories Astrophysics Series, Vol. 1: Coevolution of Black Holes and Galaxies, ed. L. C. Ho (Cambridge: Cambridge Univ. Press), in press.
- (87)
- (88) Kormendy, J., & Gebhardt, K. 2001, in 20th Texas Symposium on Relativistic Astrophysics, ed. H. Martel & J. C. Wheeler (Melville: AIP), 363
- (89)
- (90) Kormendy, J., & Richstone, D. 1995, ARA&A, 33, 581
- (91)
- (92) Kuhlbrodt, B., Orndahl, E., Wisotzki, L., & Jahnke, K. 2005, astro-ph/0503284
- (93)
- (94) Kukula, M., Dunlop, J. S., McLure, R. J., Miller, L., Percival, W. J., Baum, S. A., & O’Dea, C. P. 2001, MNRAS, 326, 1533
- (95)
- (96) Lacy, M., Gates, E. L., Ridgway, S. E., de Vries, W., Canalizo, G., Lloyd, J. P., & Graham, J. R. 2002, AJ, 124, 3023
- (97)
- (98) Laor, A. 2001, ApJ, 553, 677
- (99)
- (100) Lehnert, M. D., van Breugel, W. J. M., Heckman, T. M., & Miley, G. K. 1999, ApJS, 124, 11
- (101)
- (102) Magorrian, J., et al. 1998, AJ, 115, 2285
- (103)
- (104) Marconi, A., & Hunt, L. K. 2003, ApJ, 589, L21
- (105)
- (106) McLeod, K. K., & Rieke G. H. 1995, ApJ, 454, L77
- (107)
- (108) McLure, R. J., & Dunlop, J. S. 2002, MNRAS, 331, 795
- (109)
- (110) McLure, R. J., & Jarvis, M. J. 2002, MNRAS, 337, 109
- (111)
- (112) Merritt, D., & Ferrarese, L. 2001, MNRAS, 320, L30
- (113)
- (114) Nelson, C. H., Green, R. F., Bower, G., Gebhardt, K., & Weistrop, D. 2004, ApJ, 615, 652
- (115)
- (116) Netzer, H. 2003, ApJ, 583, L5
- (117)
- (118) Onken, C. A., et al. 2004, ApJ, 615, 645
- (119)
- (120) Oshlack, A. Y. K. N., Webster, R. L., & Whiting, M. T. 2002, ApJ, 576, 81
- (121)
- (122) Pagani, C., Falomo, R., & Treves, A. 2003, ApJ, 596, 830
- (123)
- (124) Peng, C. Y., et al. 2005, ApJ submitted
- (125)
- (126) Peterson, B. M. 1993, PASP, 105, 247
- (127)
- (128) Peterson, B. M. et al. 2004, ApJ, 613, 682
- (129)
- (130) Press, W. H., Teukolsky, S. A., Vetterling, W. T., & Flannery, B. P. 1992, Numerical Recipes in Fortran (2nd Ed.; Cambridge: Cambridge Univ. Press)
- (131)
- (132) Ridgway, S. E., Heckman, T. M., Calzetti D., & Lehnert, M. 2001, ApJ, 550, 122
- (133)
- (134) Rix, H.-W., Falco, E. E., Impey, C. D., Kochanek, C. S., Lehár, J., McLeod, B. A., Munoz, J., & Peng, C. Y. 1999, astro-ph/9910190
- (135)
- (136) Rix, H.-W., Falco, E. E., Impey, C. D., Kochanek, C. S., Lehár, J., McLeod, B. A., Munoz, J., & Peng, C. Y. 2001, ASP Conf. Ser. 237: Gravitational Lensing: Recent Progress and Future Go, 169
- (137)
- (138) Sánchez, S. F., & González-Serrano, J. I. 2003, A&A, 406, 435
- (139)
- (140) Schlegel, D. J., Finkbeiner, D. P., & Davis, M. 1998, ApJ, 500, 525
- (141)
- (142) Stickel, M., & Kühr, H. 1993, A&AS, 101, 521
- (143)
- (144) Tremaine, S., et al. 2002, ApJ, 574, 740
- (145)
- (146) Trujillo, I., et al. 2005, ApJ submitted, astro-ph/0504225
- (147)
- (148) Vanden Berk, D. E., et al. 2001, AJ, 122, 549
- (149)
- (150) van Dokkum, P. G., & Franx, M. 2001, ApJ, 553, 90
- (151)
- (152) Véron-Cetty, M.-P., & Véron, P. 1996, ESO Sci. Rep. No. 17. ESO Publications, Garching
- (153)
- (154) Vestergaard, M., & Wilkes, B. J. 2001, ApJS, 134, 1
- (155)
- (156) Vestergaard, M. 2002, ApJ, 571, 733
- (157)
- (158) Vestergaard, M. 2004, ApJ, 601, 676
- (159)
- (160) Vestergaard, M., et al. 2005, ApJ submitted
- (161)
- (162) Wandel, A., Peterson, B. M., & Malkan, M. A. 1999, ApJ, 526, 579
- (163)
- (164) Wills, B. J., & Browne, I. W. A. 1986, ApJ, 302, 56
- (165)
- (166) Wiren, S. et al. 1992, AJ, 104, 1009
- (167)
- (168) Woo, J.-H., & Urry, C. M. 2002, ApJ, 581, L5
- (169)
- (170) Zitelli, V., Mignoli, M., Zamorani, G., Marano, B., & Boyle, B. J. 1992, MNRAS, 256, 349
- (171)
| Object | Filter | NICMOS Mag | Quasar | Radio | References/Comments | |||||
|---|---|---|---|---|---|---|---|---|---|---|
| Host | Err | Quasar | Err | Filter | Mag | Loud? | ||||
| (1) | (2) | (3) | (4) | (5) | (6) | (7) | (8) | (9) | (10) | (11) |
| SGP5:46 | 0.955 | F110M | 20.09 | 0.4 | 19.45 | 0.3 | 19.7 | N | 1, assumed quasar ()=0.3 | |
| BVF225 | 0.910 | F110M | 20.10 | 0.4 | 17.90 | 0.3 | 19.2 | N | 1 | |
| BVF247 | 0.890 | F110M | 18.87 | 0.4 | 20.13 | 0.3 | 19.5 | N | 1 | |
| BVF262 | 0.970 | F110M | 19.85 | 0.4 | 19.24 | 0.3 | 19.4 | N | 1 | |
| PKS 044000 | 0.844 | F110M | 18.79 | 0.4 | 18.42 | 0.3 | 19.1 | Y | 1 | |
| PKS 0938+18 | 0.943 | F110M | 19.46 | 0.4 | 19.78 | 0.3 | 18.9 | Y | 1, assumed quasar ()=0.3 | |
| 3C 422 | 0.942 | F110M | 18.24 | 0.4 | 17.85 | 0.3 | 18.9 | Y | 1, assumed quasar ()=0.3 | |
| MRC 2112+172 | 0.878 | F110M | 18.06 | 0.4 | 18.85 | 0.3 | 17.8 | Y | 1, assumed quasar ()=0.3 | |
| 4C 02.54 | 0.976 | F110M | 19.28 | 0.4 | 17.57 | 0.3 | 18.5 | Y | 1, assumed quasar ()=0.3 | |
| SGP2:11 | 1.976 | F165M | 20.64 | 0.75 | 18.96 | 0.3 | 20.9 | N | 1 | |
| SGP2:25 | 1.868 | F165M | 19.88 | 0.75 | 19.59 | 0.3 | 20.7 | N | 1 | |
| SGP2:36 | 1.756 | F165M | 19.73 | 0.75 | 19.97 | 0.3 | 20.7 | N | 1 | |
| SGP3:39 | 1.964 | F165M | 19.75 | 0.75 | 19.53 | 0.3 | 20.8 | N | 1 | |
| SGP4:39 | 1.716 | F165M | 21.59 | 0.75 | 18.85 | 0.3 | 20.8 | N | 1 | |
| PKS 152413 | 1.687 | F165M | 19.29 | 0.75 | 18.03 | 0.3 | 20.0 | Y | 1 | |
| B22156+29 | 1.753 | F165M | 17.81 | 0.75 | 17.91 | 0.3 | 19.7 | Y | 1 | |
| PKS 220420 | 1.923 | F165M | 20.63 | 0.75 | 18.54 | 0.3 | 20.1 | Y | 1 | |
| 4C 45.51 | 1.992 | F165M | 17.79 | 0.75 | 17.41 | 0.3 | 20.1 | Y | 1 | |
| MZZ 9744 | 2.735 | F160W | 21.73 | 0.5 | 20.02 | 0.05 | 21.4 | N | 2 | |
| MZZ 9592 | 2.710 | F160W | 20.70 | 0.1 | 19.57 | 0.03 | 21.8 | N | 2 | |
| MZZ 1558 | 1.829 | F165M | 20.64 | 0.2 | 19.08 | 0.04 | 21.5 | N | 2 | |
| MZZ 11408 | 1.735 | F165M | 20.78 | 0.4 | 21.08 | 0.06 | 21.9 | N | 2 | |
| MZZ 4935 | 1.876 | F165M | 22.00 | 0.4 | 21.23 | 0.06 | 21.8 | N | 2 | |
| CTQ 414 | 1.29 | F160W | 19.67 | 0.1 | 18.09 | 0.2 | 19.85 | ? | 3 | |
Note. — Col. (1): Object name. Col. (2): Redshift. Col. (3): HST Filter. Col. (4-7): Apparent magnitude and their published uncertainties, in the Vega magnitude system, corrected for extinction from Schlegel et al. (1998). Col. (8/9): Quasar magnitude (corrected for extinction), in the Vega magnitude system, corresponding to the filter in Col. (8). Filters with superscript ∗ are photographic magnitudes. The and -band magnitudes of the quasars in Kukula et al. (2001) sample are from Véron-Cetty & Véron (1996), and references therein, while the -band magnitudes for MZZ objects are from Zitelli et al. (1992). Where -band magnitude is needed and unavailable, we used , which corresponds to . Col. (10): Radio-loud quasar or radio-quiet quasar. Col. (11): The photometry for each set of objects comes from the references shown. References.— (1) Kukula et al. 2001; (2) Ridgway et al. 2001; (3) Peng et al. 2005.
| Object | DM | Host | Quasar | Quasar | Emission | Observed | ||||
|---|---|---|---|---|---|---|---|---|---|---|
| log | Line | FWHM | ||||||||
| (mag) | (mag) | (mag) | (erg s-1) | ( ) | (Å) | ( ) | ||||
| (1) | (2) | (3) | (4) | (5) | (6) | (7) | (8) | (9) | (10) | (11) |
| SGP5:46 | 0.955 | 43.98 | 23.00 | 23.18 | 44.67 | 0.26 | Mg ii | 55 | 0.16 | 0.21 |
| BVF225 | 0.91 | 43.85 | 22.81 | 24.51 | 45.21 | 0.68 | — | — | — | — |
| BVF247 | 0.89 | 43.79 | 23.97 | 22.23 | 44.29 | 0.13 | — | — | — | — |
| BVF262 | 0.97 | 44.02 | 23.28 | 23.33 | 44.73 | 0.29 | — | — | — | — |
| PKS 044000 | 0.844 | 43.65 | 23.92 | 23.81 | 44.93 | 0.41 | Mg ii | 50 | 0.18 | 0.33 |
| PKS 0938+18 | 0.943 | 43.94 | 23.59 | 22.82 | 44.53 | 0.20 | Mg ii | 100 | 0.49 | 0.05 |
| 3C 422 | 0.942 | 43.94 | 24.85 | 24.75 | 45.30 | 0.81 | Mg ii | 140 | 1.58 | 0.09 |
| MRC 2112+172 | 0.878 | 43.75 | 24.85 | 23.58 | 44.83 | 0.35 | — | — | — | — |
| 4C 02.54 | 0.976 | 44.04 | 23.91 | 25.11 | 45.45 | 1.0 | — | — | — | — |
| SGP2:11 | 1.976 | 45.93 | 23.30 | 24.40 | 45.16 | 0.63 | C iv | 90 | 1.06 | 0.10 |
| SGP2:25 | 1.868 | 45.78 | 23.85 | 23.64 | 44.86 | 0.36 | C iv | 70 | 0.61 | 0.08 |
| SGP2:36 | 1.756 | 45.61 | 23.78 | 23.12 | 44.65 | 0.25 | C iv | 100 | 1.58 | 0.02 |
| SGP3:39 | 1.964 | 45.91 | 24.17 | 23.81 | 44.93 | 0.41 | C iv | 85 | 1.06 | 0.06 |
| SGP4:39 | 1.716 | 45.55 | 21.85 | 24.18 | 45.07 | 0.53 | C iv | 45 | 0.25 | 0.34 |
| PKS 152413 | 1.687 | 45.50 | 24.15 | 24.96 | 45.39 | 0.94 | — | — | — | — |
| B22156+29 | 1.753 | 45.61 | 25.75 | 25.17 | 45.47 | 1.10 | — | — | — | — |
| PKS 220420 | 1.923 | 45.85 | 23.23 | 24.75 | 45.30 | 0.81 | — | — | — | — |
| 4C 45.51 | 1.992 | 45.95 | 26.24 | 25.97 | 45.79 | 1.97 | C iv/Mg ii | 58/101 | 0.65/0.58 | 0.67 |
| MZZ 9744 | 2.735 | 46.78 | 23.84 | 24.15 | 45.05 | 0.52 | C iv | 90 | 0.71 | 0.12 |
| MZZ 9592 | 2.71 | 46.76 | 24.81 | 24.58 | 45.23 | 0.72 | C iv | 90 | 0.63 | 0.19 |
| MZZ 1558 | 1.829 | 45.72 | 23.01 | 24.11 | 45.05 | 0.51 | C iv | 120 | 1.34 | 0.06 |
| MZZ 1140 | 1.735 | 45.58 | 22.69 | 21.99 | 44.20 | 0.11 | C iv | 50 | 0.21 | 0.05 |
| MZZ 4935 | 1.876 | 45.79 | 21.75 | 22.02 | 44.21 | 0.11 | C iv | 50 | 0.22 | 0.05 |
| CTQ 414 | 1.29 | 44.78 | 22.95 | 24.40 | 45.13 | 0.60 | C iv/Mg ii | 40/40 | 0.34/0.16 | 0.40 |
Note. — Col. (1): Object name. Col. (2): Redshift. Col. (3): Distance modulus ( km s-1 Mpc-1, , ). Col. (4): Absolute -band magnitude of the host. Col. (5): Absolute -band magnitude of the quasar. Col. (6): Monochromatic -band luminosity of the quasar (log base 10). Col. (7): derived using the -luminosity of quasars from Peterson et al. (2004) in units of . Col. (8): Emission line used. Col. (9): FWHM of line in Col. (8), measured manually in a “double-blind” manner. The line width for PKS 0938+18 was measured by Jauncey et al. (1984); PKS 044000 was measured by Jackson & Browne (1991); 4C 45.51 was measured by Stickel & Kühr (1993); and 3C 422 was measured by Aldcroft, Bechtold, & Elvis (1994). Col. (10): derived using C iv or Mg ii broad emission line width and continuum luminosity. Col. (11): Radiation efficiency in units of Eddington luminosity.