Properties of Galaxy Groups in the SDSS: I.– The Dependence of Colour, Star Formation, and Morphology on Halo Mass
Abstract
Using a large galaxy group catalogue constructed from the Sloan Digital Sky Survey (SDSS DR2), we investigate the correlation between various galaxy properties and halo mass. We split the population of galaxies in early types, late types, and intermediate types, based on their colour and specific star formation rate (SSFR). At fixed luminosity, the late (early) type fraction of galaxies increases (decreases) with decreasing halo mass. Most importantly, this mass dependence is smooth and persists over the entire mass range probed, without any break or feature at any mass scale. We argue that the previous claim of a characteristic feature on galaxy group scales is an artefact of the environment estimators used. At fixed halo mass, the luminosity dependence of the type fractions is surprisingly weak, especially over the range : galaxy type depends more strongly on halo mass than on luminosity. In agreement with previous studies, the late (early) type fraction increases (decreases) with increasing halo-centric radius. However, we find that this radial dependence is present in haloes of all masses probed (down to ), while previous studies did not find any radial dependence in haloes with . We argue that this discrepancy owes to the fact that we have excluded central galaxies from our analysis. We also find that the properties of satellite galaxies are strongly correlated with those of their central galaxy. In particular, the early type fraction of satellites is significantly higher in a halo with an early type central galaxy than in a halo of the same mass but with a late type central galaxy. This phenomenon, which we call ‘galactic conformity’, is present in haloes of all masses and for satellites of all luminosities. Finally, the fraction of intermediate type galaxies is always percent, independent of luminosity, independent of halo mass, independent of halo-centric radius, and independent of whether the galaxy is a central galaxy or a satellite galaxy. We discuss the implications of all these findings for galaxy formation and evolution.
keywords:
galaxies: clusters: general – galaxies: haloes – galaxies: evolution – galaxies: general – galaxies: statistics – methods: statistical1 Introduction
The local population of galaxies consists roughly of two types: red galaxies, which reveal an early type morphology and which have little or no ongoing star formation, and blue galaxies with active star formation and a late-type morphology. The case for two distinct classes of galaxies has recently been strengthened as the use of large galaxy redshift surveys has shown that the distributions of colour and star formation rate (SFR) of the galaxy population are bimodal (e.g., Strateva et al. 2001; Blanton et al. 2003b; Kauffmann et al. 2003, 2004; Baldry et al. 2004; Brinchmann et al. 2004; Balogh et al. 2004a,b). In addition, studies at intermediate redshifts have shown that this bimodality exists at least out to (e.g., Bell et al. 2004; Tanaka et al. 2005; Weiner et al. 2005), but with different fractions of galaxies on both sides of the bimodality scale compared to (Bell et al. 2004; Faber et al. 2005).
An important, and largely open question in galaxy formation regards the origin of this bimodality. In particular, does this bimodality arise early on (the ‘nature’ scenario), or is it a consequence of various physical processes that operate over a Hubble time (the ‘nurture’ scenario)? In particular, are there two distinct formation channels, or are galaxies being transformed from one type to the other? In the latter case we need to know where, how and when these transformations occur. Important hints come from the observed correlations between galaxy properties and environment: galaxies in dense environments (i.e., clusters) have predominantly early type morphologies (e.g., Oemler 1974; Dressler 1980; Whitmore, Gilmore & Jones 1993) and low SFRs (e.g., Balogh et al. 1997, 1999; Poggianti et al. 1999). At first sight this seems to suggest that cluster-specific processes, such as galaxy harassment (Moore et al. 1996), ram-pressure stripping (Gunn & Gott 1972) and/or interactions with the cluster potential (Byrd & Valtonen 1990) play a dominant role in transforming galaxy morphologies from late to early types, and in truncating their SFRs. However, starting with the work of Postman & Geller (1984), it has become clear that the environmental dependence of galaxy properties is not restricted to clusters, but smoothly extends to the scale of galaxy groups (see also Zabludoff & Mulchaey 1998; Tran et al. 2001). Consequently, it has been suggested that group-specific processes are of paramount importance for transforming galaxies. In particular, the relatively low velocity dispersion of groups implies that galaxy-galaxy merging, which can transform disk galaxies into ellipticals (e.g., Toomre & Toomre 1972), is effective. In addition, as soon as a galaxy becomes a group member, i.e., becomes a satellite of a bigger system, it is deprived of its reservoir of hot gas. Consequently, it is expected that, after a delay time in which the galaxy consumes (part of) its cold gas, star formation in the galaxy comes to a halt (Larson, Tinsley & Caldwell 1980; Balogh, Navarro & Morris 2000). This process, often called strangulation, provides a natural explanation for the increasing fraction of red galaxies towards denser environments.
Much of the earlier work on the relation between galaxy properties and environment was based on incomplete samples of clusters and groups. With the advent of large, homogeneous galaxy surveys, it has become possible to investigate this relation in far more detail, and over a much wider range of environments. In particular, using the Las Campanas Redshift Survey (LCRS; Shectman et al. 1996), the Two-Degree Field Galaxy Redshift Survey (2dFGRS; Colless et al. 2001) and the Sloan Digital Sky Survey (SDSS; York et al. 2000; Stoughton et al. 2002) various authors have investigated the relation between environment and morphology (e.g., Hashimoto & Oemler 1999; Goto et al. 2003; Kuehn & Ryden 2005), between environment and star formation rate (e.g., Hashimoto et al. 1998; Lewis et al. 2002; Domínguez et al. 2002; Gómez et al. 2003; Balogh et al. 2004a; Tanaka et al. 2004; Kelm, Focardi & Sorrentino 2005), and between environment and colour (e.g.,Tanaka et al. 2004; Balogh et al. 2004b; Hogg et al. 2004).
One of the numerous results that have emerged from these studies is that galaxy properties only seem to correlate (significantly) with environment above a characteristic surface density, which is roughly consistent with the characteristic density at the perimeter of a cluster or group (Hashimoto & Oemler 1999; Lewis et al. 2002; Gómez et al. 2003; Goto et al. 2003; Tanaka et al. 2004; Balogh et al. 2004a). This has been interpreted as further evidence that group-specific processes play a dominant role in establishing a bimodal distribution of galaxies (e.g., Postman & Geller 1984; Zabludoff & Mulchaey 1998, 2000). However, it is important to understand the physical meaning of the density estimators used. Most studies parameterize ‘environment’ through the projected number density of galaxies above a given magnitude limit. Typically this number density, indicated by , is measured using the projected distance to the th nearest neighbor, with typically in the range 5-10 (e.g., Dressler et al. 1980, Lewis et al. 2002; Gómez et al. 2003; Goto et al. 2003; Tanaka et al. 2004; Balogh et al. 2004a,b; Kelm et al. 2005). However, the physical meaning of itself depends on the environment: in clusters, where the number of galaxies is much larger than , measures a local number density, which is a sub-property of the cluster (i.e., is strongly correlated with cluster-centric radius). However, in low-density environments, which are populated by haloes which typically contain only one or two galaxies, measures a much more global density, covering a scale that is much larger than the halo in which the galaxy resides. This ambiguous, physical meaning of severely complicates a proper interpretation of the various correlations between environment and galaxy properties. Note that density estimators that use a fixed metric aperture size, rather than the distance to the th nearest neighbor, suffer from very similar problems.
Another complication arises from the fact that the bimodality scale, and the fractions of galaxies on either side of it, depend strongly on luminosity and stellar mass (e.g., Kauffmann et al. 2003; Blanton et al. 2003b; Hogg et al. 2004; Baldry et al. 2004; Kelm et al. 2005). This luminosity dependence is also evident from a comparison of the luminosity functions of early and late type galaxies, which shows that late (early) types dominate the faint (bright) end (e.g., Loveday et al. 1992; Marzke & Da Costa 1997; Zucca et al. 1997; Marzke et al. 1998; Blanton et al. 2001; Madgwick et al. 2002). At first sight this seems to suggest that the morphology and SFR of a galaxy is somehow determined by its own (baryonic) mass. On the other hand, this luminosity/stellar mass dependence may also be a reflection of the correlation between the galaxy luminosity function and environment: as shown by various authors (e.g., Hogg et al. 2003; Blanton et al. 2005b; Mo et al. 2004; Hoyle et al. 2005; Croton et al. 2005), dense environments contain on average brighter galaxies. Therefore, if there is a correlation between galaxy properties and environment, this will introduce a correlation between galaxy properties and luminosity. Of course, the inverse also holds: a physical correlation between galaxy properties and luminosity will introduce an observable correlation between galaxy properties and environment. Clearly, when investigating the physical origin of the bimodality in the distribution of galaxies, it is crucial that one discriminates between environment dependence and luminosity dependence in a proper way (see Girardi et al. 2003 and Blanton et al. 2005b for statistical methods that address this issue).
1.1 A physically motivated split of environment
Within our current framework for galaxy formation, in which galaxies are thought to reside in extended dark matter haloes, it is useful to split the ‘environment dependence’ in three, physically separate, components. Going from small to large scales these are (i) the dependence on halo-centric radius, (ii) the dependence on halo mass, and (iii) the dependence on large-scale environment. In terms of the halo virial radius, , these effects measure a dependence on scales , , and . Note that there is a clear, physical motivation for considering the virial radius as an important scale: matter at the virial radius has roughly experienced one dynamical time. In other words, a galaxy inside the virial radius of a given halo can not have been dynamically affected (at least not significantly) by any object that is located outside of this virial radius. Thus, if there is any galaxy type dependence on scales this must arise from either initial conditions, or from non-gravitational processes such as reionization (e.g., Efstathiou 1992) or preheating (e.g., Mo et al. 2005). On the other hand, most ‘nurture’ processes only introduce a (radial) dependence on scales Therefore, by investigating ‘environment’ dependence on scales larger and smaller than the virial radius one may hope to be able to determine which physical processes are most important for setting galaxy properties.
Unfortunately, the presence of a halo mass dependence may complicate the situation. Since the halo mass function is environment dependent, in that overdense regions contain on average more massive haloes than underdense regions (e.g., Lemson & Kauffmann 1999; Mo et al. 2004), a correlation between galaxy properties and halo mass will induce a correlation between galaxy properties and large scale environment. For example, Mo et al. (2004) have shown that the large-scale environment dependence of the galaxy luminosity function of early and late type galaxies, measured on scales of by Croton et al. (2005), can be entirely explained as a pure halo mass dependence. In addition, Balogh et al. (2004a), Blanton et al. (2004) and Kauffmann et al. (2004) have shown that various galaxy properties depend on environment, even when the latter is measured over scales of , much larger than the virial radius of the most massive clusters. However, when this large-scale environmental dependence is investigated at a fixed small-scale environment, it is no longer present (Blanton et al. 2004; Kauffmann et al. 2004, but see also Balogh et al. 2004a). Finally, Goto et al. (2003) have shown that the morphological fractions are constant at cluster-centric radii that exceed the virial radius. All these results suggest that the environment dependence does not extent beyond the virial radius. This is not only important because it suggests that processes such as reionization and/or preheating have not left a major imprint on galaxy properties, but also because it provides proof for an essential assumption in the halo model (see Cooray & Sheth 2002 and references therein).
A few studies in the past have investigated the correlation between galaxy properties and halo mass using group catalogues. In particular, Martínez et al. (2002) used a group catalogue constructed from the 100K data release of the 2dFGRS by Merchán & Zandivarez (2002) and found that the fraction of early types decreases continuously down to the lowest mass haloes probed (). This was confirmed by Yang et al. (2005c), who used an independent group catalogue based on the completed 2dFGRS. Tanaka et al. (2004) applied the group-finding algorithm of Huchra & Geller (1982) to the first data release of the SDSS, and examined the median SFR and morphological fraction as function of the group velocity dispersion . Splitting the group members into bright and faint galaxies, they find that neither the SFR nor the morphological fraction shows any significant correlation with , neither for the bright nor for the faint galaxies. Balogh et al. (2004b) studied the fraction of red galaxies as function of the projected density, , and cluster velocity dispersion. While they find a strong dependence on , for a fixed luminosity they find no dependence on velocity dispersion over the range , corresponding to (cf., De Propris et al 2004; Goto 2005). Although the comparison is far from straightforward, these findings of Tanaka et al. (2004) and Balogh et al. (2004b) seem difficult to reconcile with those of Martínez et al. (2002)and Yang et al (2005c). A more in-depth investigation, based on a large and well defined sample is required in order to shed some light on these issues, and to examine any possible halo mass dependence in more detail.
1.2 The purpose of this paper
In this paper we investigate the dependence of various galaxy properties, in particular colour, SFR, and concentration, on halo mass and halo-centric radius. To that extent we construct a SDSS group catalogue using the halo-based group finder of Yang et al. (2005a). This group finder has been well tested, and yields high completeness and a low fraction of interlopers. Halo masses are assigned based on the group luminosity, which, as we will show, yields more reliable mass estimates than the conventional velocity dispersion of the group members.
We use the resulting group catalogue to examine the fractions of various galaxy types as function of luminosity, halo mass, and halo-centric radius. Since haloes of different masses host galaxies of different luminosities (e.g., Yang, Mo & van den Bosch 2003; van den Bosch, Yang & Mo 2003), it is important to separate luminosity dependence from halo mass dependence. We address this by studying the halo mass dependence at fixed luminosity and vice versa.
This paper is organized as follows. In Section 2, we describe the data and our classification of galaxy types based on both colour and SFR. In Section 3 we present our SDSS group catalogue, which we use in Section 4 to investigate the relation between galaxy properties and halo mass. The implications of our findings for the formation and evolution of galaxies is discussed in Section 5, while we summarize our results in Section 6. The paper also contains two appendices: Appendix A gives a detailed description of our group finder and Appendix B presents a number of tests based on mock galaxy redshift surveys to illustrate the robustness of our results.
When required we adopt a standard CDM cosmology with and . Units that depend on the Hubble constant are expressed in terms of .
2 Classifying Galaxies based on colour and star formation rate
2.1 The data
The data used in this paper is taken from the Sloan Digital Sky Survey (SDSS; York et al. 2000), a joint, five passband (, , , , ) imaging and medium-resolution () spectroscopic survey. In particular, we use the New York University Value-Added Galaxy Catalogue (NYU-VAGC), which is described in Blanton et al. (2005a). The NYU-VAGC is based on the SDSS Data Release 2 (Abazajian et al. 2004), but with an independent set of significantly improved reductions. From this catalogue we select all galaxies in the Main Galaxy Sample, i.e., galaxies with an extinction corrected apparent magnitude brighter than . We prune this sample to those galaxies in the redshift range and with a redshift completeness . This leaves a grand total of 184,425 galaxies with a sky coverage of .
In addition to these data, we also use estimates of the stellar masses and the star formation rates (SFRs) obtained by Kauffmann et al. (2003) and Brinchmann et al. (2004), respectively. Stellar masses are obtained from the strength of the Å break and the Balmer absorption-line index H as described in Kauffmann et al. (2003), while the SFR is obtained using various emission lines in the SDSS spectra as described in Brinchmann et al. (2004). In this paper we mainly use the specific star formation rate (hereafter SSFR), defined as the ratio of the SFR (in ) to the stellar mass (in ). The SSFRs used are the average values of the full likelihood distributions obtained by Brinchmann et al. The NYU-VAGC and the stellar mass and SFR catalogues are all publicly available111The NYU-VAGC is available at http://wassup.physics.nyu.edu/vagc/#download, while the catalogues with stellar masses and SFRs can be downloaded from http://www.mpa-garching.mpg.de/SDSS/. We have matched these catalogues yielding a (dust-corrected) stellar mass and current SFR (corrected for fiber aperture) for 179,197 of the 184,425 galaxies ( percent) in our sample.
Throughout this paper we use the Petrosian magnitudes, corrected for Galactic extinction using the dust maps of Schlegel, Finkbeiner & Davis (1998). In order to minimize the errors due to uncertainties in the k-correction we follow Blanton et al. (2005a) and k-correct all magnitudes to a redshift of using the Blanton et al. (2003c) model. We use the notation and to indicate the resulting absolute and apparent magnitudes in the -band, respectively.
The spectroscopic survey of the SDSS suffers from a small incompleteness due to (i) fiber collisions (6 percent), (ii) spectra that did not allow for a useful determination of the redshift ( percent), and (iii) galaxies that were too close to a bright star (Blanton et al. 2004). Of these, the fiber collision incompleteness is the most important one, especially because it creates an incompleteness which is correlated with the local number density of galaxies. Since in this paper we are not interested in any absolute number densities, we have not attempted to correct the survey for these fiber collisions. Our main focus is on the fractions of various galaxy types as a function of environment. Since the galaxies missed because of fiber collisions are a purely random subset of the galaxies in the target field, their absence should have no impact on the type fractions discussed here.
2.2 Defining galaxy types
The main purpose of this paper is to investigate how galaxy type correlates with halo mass. Roughly, the galaxy population consists of two types: ‘early types’, which have red colours, low specific star formation rates, and are morphologically reminiscent of ellipticals and S0s, and ‘late types’, which have blue colours, relatively high specific star formation rates, and are morphologically classified as spiral galaxies.
Unfortunately, whether a galaxy is termed ‘early’ or ‘late’ is fairly subjective, and many different approaches have been used in the past, including morphological quantifiers (e.g. Tran et al. 2001; Goto et al. 2003), star formation rate indicators (e.g., Lewis et al. 2002; Martínez et al. 2002; Domínguez et al. 2002; Balogh et al. 2004a; Tanaka et al. 2005) and broad-band colours (Strateva et al. 2001; Baldry et al. 2004; Balogh et al. 2004b; Goto et al. 2004). The 2dFGRS and the SDSS have clearly revealed that the distributions of many of these parameters are (to some extent) bimodal (e.g., Strateva et al. 2001; Madgwick et al. 2002; Blanton et al. 2003b). Although this makes the split more objective, the non-uniqueness of the various type-classifications creates some ambiguity. For example, a genuine, star-forming disk galaxy may appear red due to strong extinction (e.g., when seen edge-on), and thus be termed ‘early type’ based on its colour, while the SFR and morphology quantifiers would classify it as a ‘late-type’.
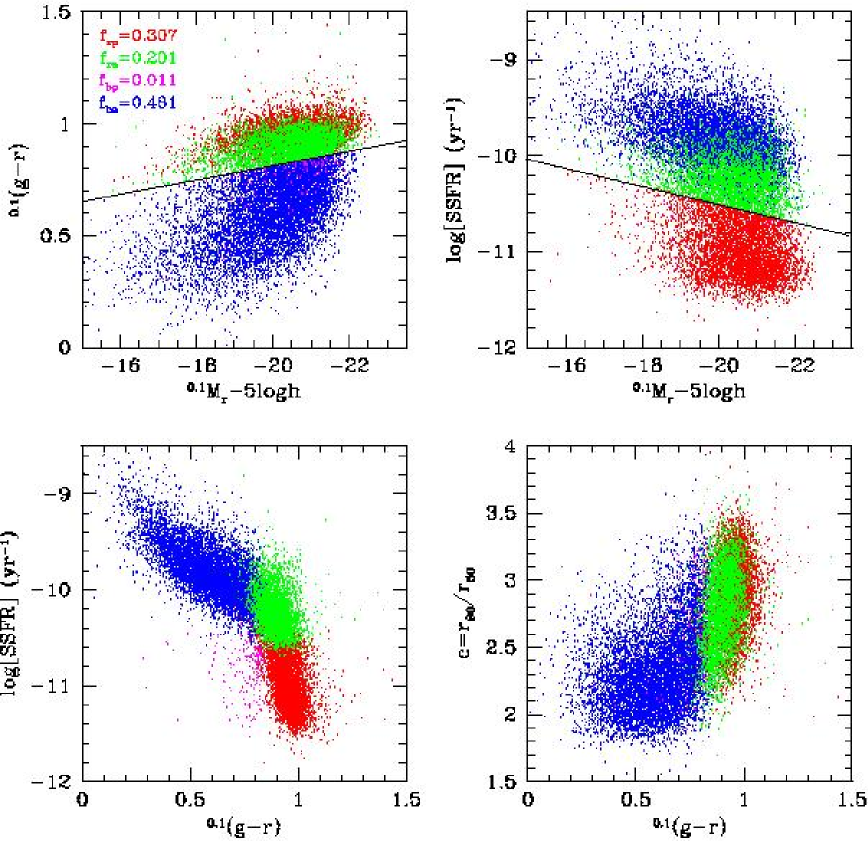
To partially sidestep these difficulties we classify galaxies using both colour and specific star formation rate. The upper left-hand panel of Fig. 1 shows the colour-magnitude (CM) relation for a random subsample of 10 percent of all galaxies. The CM relation is clearly bimodal, revealing a narrow red sequence and a much broader blue sequence (see also Blanton et al. 2003b; Baldry et al. 2004; Hogg et al. 2004; Bell et al. 2004). The thick solid line corresponds to
| (1) |
with the absolute magnitude in the SDSS -band, k-corrected to . We term galaxies that fall above this line ‘red’, and galaxies below this line as ‘blue’.
The upper right-hand panel of Fig. 1 plots the SSFR as function of absolute magnitude. Similar to the CM relation, the distribution is clearly bimodal (see also Fig. 2). The thick solid line corresponds to
| (2) |
and roughly describes the magnitude dependence of the bimodality scale. Galaxies that fall above this line are termed ‘active’, and those below it ‘passive’.
Galaxies that are ‘red’ and ‘passive’ are indicated by red dots in Fig. 1 and make up 30.7 percent of the entire population. In what follows we refer to these as early types. Galaxies that are ‘blue’ and ‘active’ are represented by blue dots, make up 48.1 percent of the population, and will hereafter be referred to as late-types. A fraction of 20.1 percent of all galaxies are ‘red’ and ‘active’. These are represented by green dots and will hereafter be referred to as intermediate types. The final class of galaxies, those that are both ‘blue’ and ‘passive’, only make up 1.1 percent of all galaxies (magenta dots in Fig. 1). Thus, although our classification allows for four classes, in practice, 98.9 percent of all galaxies belongs to only three of these. This suggests that galaxies occupy only a restricted subspace of the colour-SSFR parameter space. Indeed, as shown in the lower left-hand panel of Fig. 1, galaxies follow a roughly one-dimensional distribution in this plane. Most importantly, the different types are clearly separated, with the intermediate types occupying the region in between the early and late types (hence our choice for their nomenclature). The clarity with which the various galaxy types separate out in this colour-SSFR sequence gives a strong, physical motivation for our classification scheme. Note that the intermediate types seem to occupy the region where the late and early type branches overlap. This suggests that they consist of a mix of early and late types, rather than constitute a physically separate class.
Most of the ‘blue’ and ‘passive’ galaxies (magenta points) fall off the colour-SSFR sequence: they are clearly not part of the major population of galaxies. Because of this, and since they only make up a negligible fraction of the total population, we no longer consider them in this paper.
The lower right-hand panel of Fig. 1 plots the concentration parameter as function of colour. Here and are the radii that contain 90 and 50 percent of the Petrosian -band flux, respectively. As expected, early types are, on average, more centrally concentrated than late types. Note also that the intermediate types cover the full range of concentrations expected given their colour. In other words, they are not predominantly low or high concentration systems.
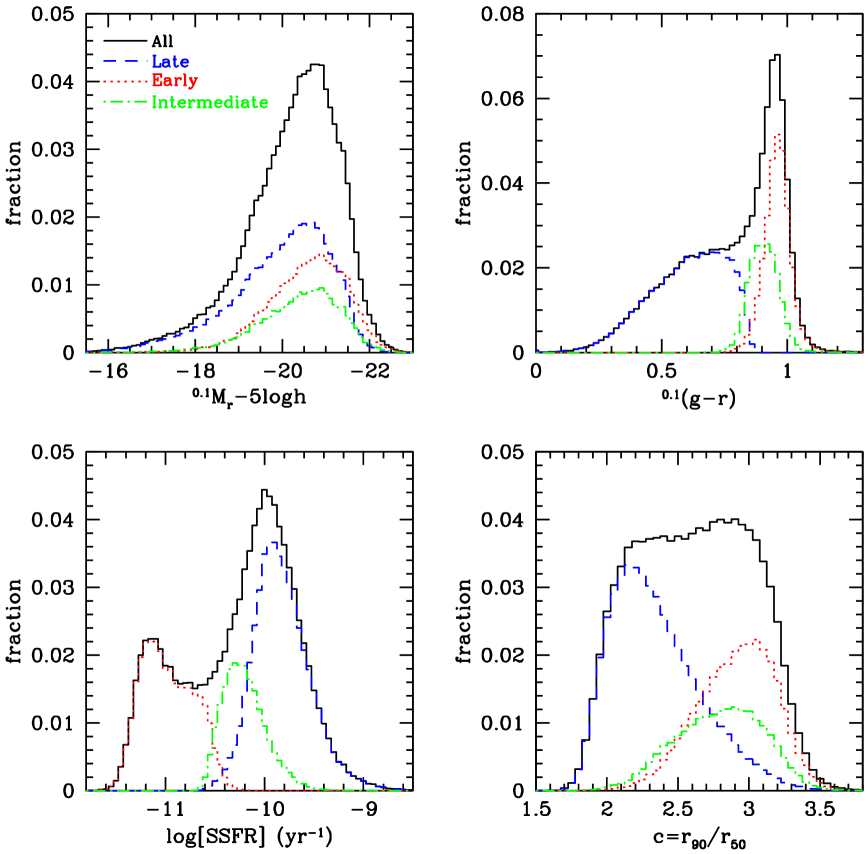
Figure 2 shows histograms of the distributions of absolute magnitude, -colour, log(SSFR), and . The dashed, dotted and dot-dashed curves show the contributions due to late, early, and intermediate types, respectively. Note that no correction has been applied for Malmquist bias (i.e., no weighting has been applied), so that the distributions shown do not reflect true number density distributions: they merely serve as an illustration. Note how the early and late types are clearly separated in terms of colour and SSFR (by construction), and that the intermediate types have distributions that are truly intermediate to those of the early and late types. The -distributions of early and late types are clearly skewed towards the opposite extremes, but still show a large range of overlap. Although the intermediate types have a -distribution that is more reminiscent of that of the early types, they have the same -distribution as late-type galaxies of the same colour (cf., lower right-hand panel of Fig. 1)
Our class of early types thus consists of red galaxies with a passive SFR and a high concentration, consistent with a typical elliptical. Our class of late types consists of galaxies that are blue, are actively forming stars, and have low concentrations, all consistent with a typical spiral galaxy. The nature of our intermediate types, however, is less clear. They are defined as galaxies that are ‘red’, yet ‘active’. Therefore, it is tempting to interpret them as dusty, star forming galaxies. One possibility is that they are, to a large extent, made up of edge-on disk galaxies where the orientation causes an enhanced extinction. On the other hand, Brinchmann et al. (2004) have stated that due to degeneracies between age, metallicity and dust, the SFR cannot be constrained better than to a factor of 10 at colours redder than . Therefore, the intermediate types may also consist of early type galaxies for which the SSFR has been overestimated. Most likely, our class of intermediate types contains examples of both. Indeed, as we will show below, their halo occupation statistics strongly suggest that they consist of a mix of both early and late types.
3 The SDSS Group Catalogue
3.1 The group finding algorithm
In order to study the relation between galaxy types and halo mass, we construct a group catalogue from the SDSS data described in Section 2.1, using all galaxies in our sample, including those for which no stellar mass or SSFR is available.
Our working definition of a galaxy group is the ensemble of galaxies that reside in the same dark matter parent halo; galaxies that reside in subhaloes are considered to be group members that belong to the parent halo in which the subhalo is located. The properties of the halo population in the standard CDM model are well understood, largely due to a combination of -body simulations and analytical models. Recently, Yang et al. (2005a, hereafter YMBJ) used this knowledge to develop a new group-finding algorithm that is optimized to group galaxies according to their common dark matter halo, and which has been thoroughly tested with mock galaxy redshift surveys. In brief, the method works as follows. First potential group centers are identified using a Friends-Of-Friends (FOF) algorithm or an isolation criterion. Next, the total group luminosity is estimated which is converted into an estimate for the group mass using an assumed mass-to-light ratio. From this mass estimate, the radius and velocity dispersion of the corresponding dark matter halo are estimated using the virial equations, which in turn are used to select group members in redshift space. This method is iterated until group memberships converge. A more detailed description is given in Appendix A. The basic idea behind this group finder is similar to that of the matched filter algorithm developed by Postman et al. (1996) (see also Kepner et al. 1999; White & Kochanek 2002; Kim et al. 2002; Kochanek et al. 2003; van den Bosch et al. 2004, 2005a), although it also makes use of the galaxy kinematics.
In YMBJ the performance of this group finder has been tested in terms of completeness of true members and contamination by interlopers, using detailed mock galaxy redshift surveys. The average completeness of individual groups is percent and with only percent interlopers. Furthermore, the resulting group catalogue is insensitive to the initial assumption regarding the mass-to-light ratios, and the group finder is more successful than the conventional FOF method (e.g., Huchra & Geller 1982; Ramella, Geller & Huchra 1989; Merchán & Zandivarez 2002; Eke et al. 2004a) in associating galaxies according to their common dark matter haloes.
Thus far this group finder has been applied to the 2dFGRS (Yang et al. 2005a) and used to study the two-point correlation function of groups (Yang et al. 2005b), the galaxy occupation statistics of dark matter haloes (Yang et al. 2005c), the phase-space parameters of brightest halo galaxies (van den Bosch et al. 2005b), and the cross-correlation between galaxies and groups (Yang et al. 2005d). In this paper we apply it to the SDSS. The resulting group catalogue is used to investigate the relation between various galaxy properties and halo mass.
3.2 Estimating group masses
In order to infer halo occupation statistics from our group samples it is crucial that we can estimate the halo masses associated with our groups. For individual, rich clusters one could in principle estimate halo masses using the kinematics of the member galaxies, gravitational lensing of background sources, or the temperature profile of the X-ray emitting gas. For most groups, however, no X-ray emission has been detected, and no lensing data is available. In addition, the vast majority of the groups in our sample contain only a few members, making a dynamical mass estimate based on its members extremely unreliable (see Appendix B). We thus need to adopt a different approach to estimate halo masses. Following YMBJ we use the group luminosity to assign masses to our groups. The motivation behind this is that one naturally expects the group luminosity to be strongly correlated with halo mass (albeit with a certain amount of scatter). Since the group luminosity is dominated by the brightest members, which are exactly the ones that can be observed in a flux limited survey like the SDSS, the determination of the (total) group luminosity is far more robust than that of the group’s velocity dispersion when the number of group members is small.
Clearly, because of the flux limit of the SDSS, two identical groups observed at different redshifts will have a different , defined as the summed luminosity of all its identified members. To circumvent this bias we first need to bring the group luminosities to a common scale. One possibility is to use the total group luminosity, , which one might define according to
| (3) |
Here is the minimum luminosity of a galaxy that can be observed at the redshift of the group, and is the galaxy luminosity function in the -band. Although this approach has been used by many earlier analyzes (e.g., Tucker 2000; Merchán & Zandivarez 2002; Kochanek et al. 2003; Eke et al. 2004b), it is based on the assumption that the galaxy luminosity function in groups is the same as that of field galaxies, independent of the mass of the group. It has been shown, however, that the galaxy luminosity function depends on both halo mass and environment (Yang et al. 2003, 2005c; Mo et al. 2004; Zheng et al. 2004; Croton et al. 2005; Cooray & Milosavljević 2005). Therefore we follow YMBJ and use a more empirical approach. A nearby group selected in an apparent magnitude limited survey should contain all of its members down to a faint luminosity. We can therefore use these nearby groups to determine the relation between the group luminosity obtained using only galaxies above a bright luminosity limit and that obtained using galaxies above a fainter luminosity limit. Assuming that this relation is redshift-independent, one can correct the luminosity of a high- group, where only the brightest members are observed, to an empirically normalized luminosity scale.
As common luminosity scale we use , defined as the luminosity of all group members brighter than . To calibrate the relation between and we first select all groups with , which corresponds to the redshift for which a galaxy with has an apparent magnitude that is equal to the magnitude limit of the survey. For groups with we use this ‘local’ calibration between and to estimate the latter. Detailed tests (see YMBJ) have shown that the resulting group luminosities are significantly more reliable than .
The final step is to obtain an estimate of the group (halo) mass from . This is done using the assumption that there is a one-to-one relation between and halo mass. For each group we determine the number density of all groups brighter (in terms of ) than the group in consideration. Using the halo mass function corresponding to a CDM concordance cosmology with , , and we then find the mass for which the more massive haloes have the same number density. Although this has the downside that it depends on cosmology, it is straightforward to convert the masses derived here to any other cosmology. An obvious shortcoming of this method is that the true relation between and contains some scatter. This scatter will result in errors in the inferred halo mass. However, as long as the scatter is sufficiently small, which we believe to be the case, given, for example, the small observed scatter in the Tully-Fisher relation, this method of assigning group masses is expected to be significantly more accurate than using the velocity dispersion of group members. In Appendix B we use detailed mock galaxy redshift surveys to demonstrate that this is indeed the case (see also YMBJ and Yang et al. 2005c).
Finally we note that not all groups can have a halo mass assigned to them. First of all, the mass estimator described above does not work for groups in which all members are fainter than . Secondly, the combination of and redshift may be such that we know that the halo catalogue is incomplete, which means that there is a significant number of groups at this redshift with the same but for which the individual galaxies are too faint to be detected. Since our mass assignment is based on the assumption of completeness, any group beyond the completeness redshift corresponding to its is not assigned a halo mass (see Yang et al. 2005a for details).
3.3 The SDSS group catalogue
Applying our group finder to the sample of SDSS galaxies described in Section 2.1 yields a group catalogue of 53,229 systems with an estimated mass. These groups contain a total of 92,315 galaxies. The majority of the groups (37,216 systems) contain only a single member, while there are 9220 binary systems, 3073 triplet systems, and 3720 systems with four members or more. In what follows we refer to the brightest galaxy in each group as the ‘central’ galaxy, while all others are termed ‘satellites’.
This SDSS group catalogue is publicly available at http://www.astro.umass.edu/∼xhyang/Group.html 222This website also contains our 2dFGRS group catalogue as well as detailed mock galaxy redshift surveys. For each group-member the catalogue contains magnitudes in the five SDSS bands (, , , , ), Petrosian radii, a velocity dispersion, and, for 89,232 galaxies ( percent of all group members) the stellar mass and present day SFR. In addition to group memberships, the catalogue also contains estimates of the group’s characteristic luminosity, , and its mass (derived using the method described above).
4 Results
Using the SDSS group catalogue described above, and the definition of galaxy types discussed in Section 2.2, we now investigate the ecology of galaxies.
4.1 Dependence on Luminosity
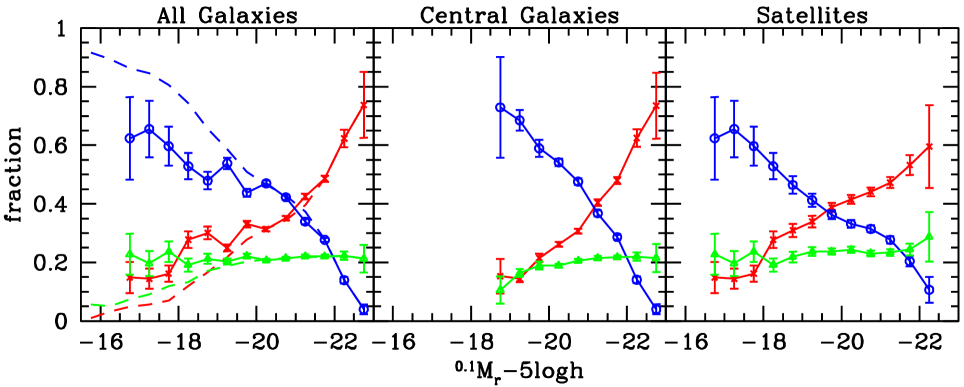
We start our investigation by computing how galaxy type depends on luminosity. The left-hand panel of Fig. 3 plots the various type fractions as function of the absolute magnitude in the -band. For each luminosity bin, we only consider galaxies with , where is the redshift out to which a galaxy at the faint end of the luminosity bin has an apparent magnitude that is equal to the flux limit of the SDSS (). In other words, each magnitude bin is a volume limited sample. The points connected by the solid lines indicate the fractions of all galaxies that are member of a group with an assigned mass. Results are only shown for luminosity bins that contain at least 50 galaxies in total and errorbars are calculated using Poisson statistics.
As is well known, the late (early) type fraction decreases (increases) strongly with increasing luminosity (e.g., Baldry et al. 2004; Balogh et al. 2004b; Kelm et al. 2005). The fraction of intermediate type systems, however, is remarkably constant at percent, virtually independent of luminosity.
The dashed lines indicate the type fractions when all galaxies are considered, including those that have not been assigned to a group. Note that these fractions differ substantially from those of the group members at the faint end. This is a first indication for a mass dependence of the type fractions; since our group catalogue is incomplete at the low mass end, because its members are too faint for a mass estimate (see Section 3.2), the faint galaxies that do make it into the group catalogue are mainly satellite galaxies in more massive haloes. The results shown here suggest that these have a lower late type fraction than galaxies of the same magnitude but which reside in more massive haloes.
The middle and right-hand panels of Fig. 3 plot the type fractions for central and satellite galaxies, respectively (again using only galaxies in groups with an assigned halo mass). This shows that the luminosity dependence of the type fractions is stronger for central galaxies than for satellite galaxies. A similar trend was previously noted by Yang et al. (2005c) from an analysis of the 2dFGRS group catalogue. Note that the fraction of intermediate types is, within the errors, equally large among central and satellite galaxies, independent of luminosity.
4.2 Dependence on Halo Mass
We now investigate how galaxy type depends on halo mass. We start by splitting the group sample in six logarithmic mass bins and determine how their type fractions depend on luminosity. For each bin in mass and luminosity the late type fraction is defined as the total number of late type galaxies in that bin, divided by the total number of galaxies in that bin (i.e., we do not average the late type fraction over individual haloes). The same applies to the early and intermediate types.
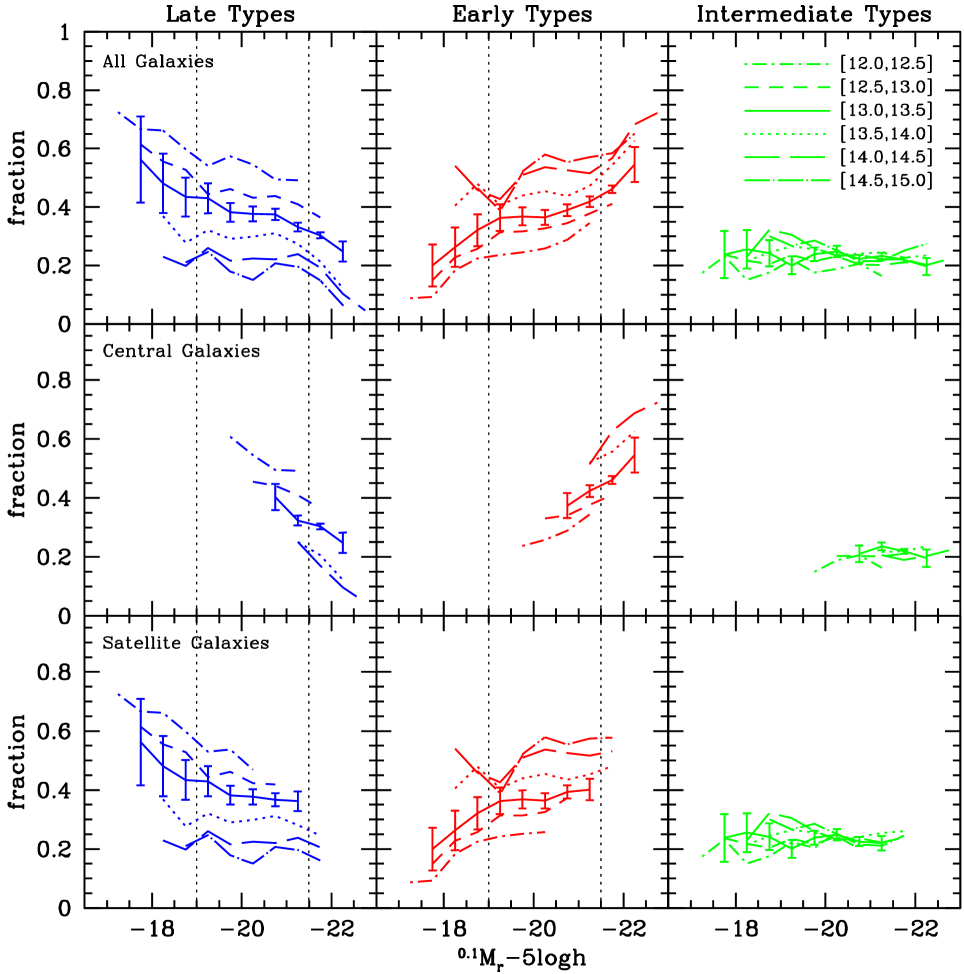
The results are shown in the upper panels of Fig. 4. In each mass bin the late (early) type fraction decreases (increases) with increasing luminosity, similar as for the entire sample (cf. Fig. 3). Note, however, that in the range (indicated by vertical, dotted lines), the luminosity dependence is remarkably weak, for all 6 mass bins. For comparison, an galaxy has (Blanton et al. 2003a), so that this magnitude range corresponds roughly to . In Yang et al. (2005c) we found a similar result from an analysis of the early and late type fractions in 2dFGRS groups, despite a different definition of early and late types and the use of luminosities in the -band, rather than the -band.
At fixed luminosity, the late and early type fractions depend strongly on halo mass: the late type fraction decreases and the early type fraction increases with increasing halo mass. Over the mass range both fractions change by 30 to 40 percent, at all luminosities. This is a reflection of the well known morphology-density relation (e.g., Dressler 1980; Postman & Geller 1984; Whitmore 1995; Domínguez, Muriel & Lambas 2001; Goto et al. 2003; Tanaka et al. 2004), but now expressed in terms of halo mass rather than galaxy number density.
Panels in the middle and lower row show the same results separately for central and satellite galaxies. As expected, central galaxies mainly occupy the bright end of the distribution. In the, unfortunately small, magnitude range where satellites and central galaxies overlap, there is a weak indication that the early and late type fractions of central galaxies increase and decrease with luminosity, respectively, while those of the satellite galaxies are consistent with no luminosity dependence. However, given the (Poissonian) errors we can not rule out that central and satellite galaxies follow the same trend; a larger data set is required to investigate this in more detail.
The right-hand panels of Fig. 4 show that the intermediate type fractions are once again remarkably constant at percent; there is no significant dependence on either luminosity or halo mass, nor does it depend on whether the galaxy is a central galaxy or a satellite galaxy. The implications of this for the nature of intermediate type galaxies are discussed in Section 5.3.
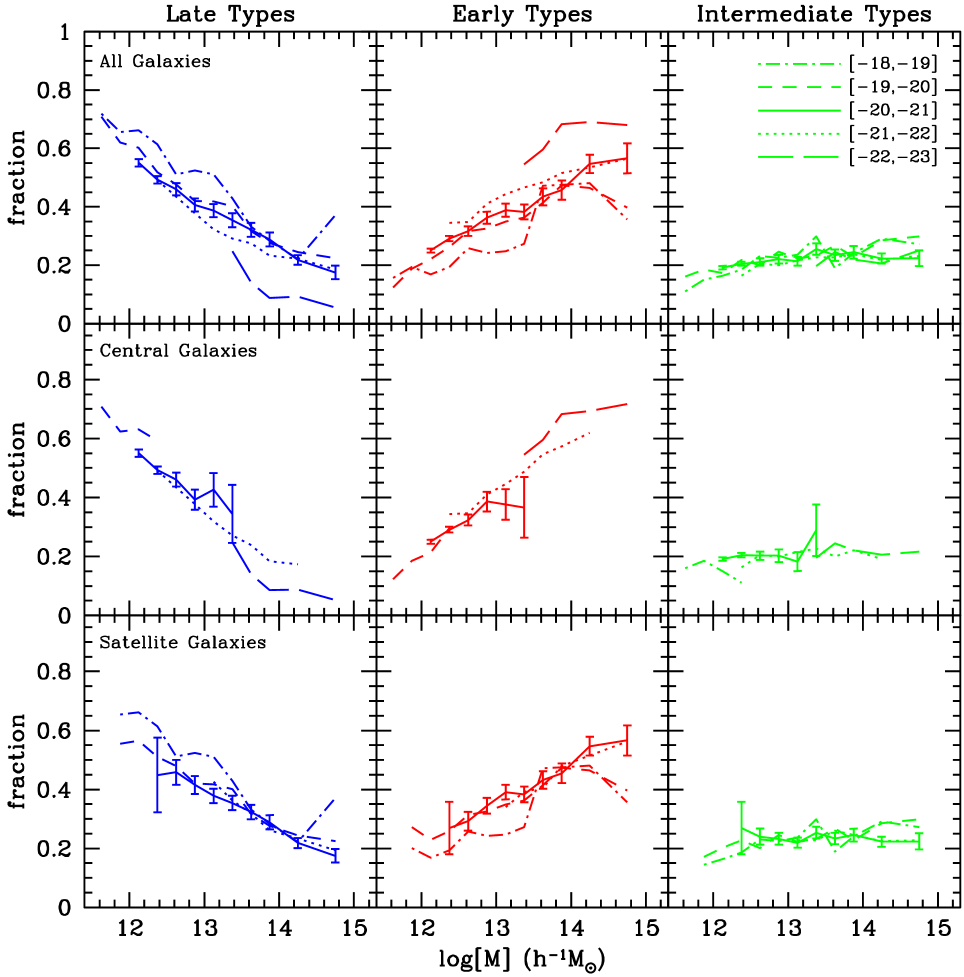
Fig. 5 shows these results in a complementary way. It shows the type fractions as function of halo mass for five different magnitude bins. For each magnitude bin we only include groups that fall entirely within the volume limit, i.e., for which all members have . Whereas the intermediate type fraction, once again, shows no significant mass or luminosity dependence, the early and late type fractions are strongly mass dependent. Most importantly, we find the mass dependence to be remarkably smooth, with no indication at all for any characteristic mass scale333The only apparent exception occurs for the brightest sample with , where the late and early type fractions seem to reveal a break at around . However, an investigation of the Poissonian errorbars (not shown) suggests that this break is not significant.
At fixed halo mass, the luminosity dependence is surprisingly weak, especially over the magnitude range . The early and late type fractions only reveal some luminosity dependence at the very bright and the very faint end of the distribution (cf. Fig. 4).
Panels in the middle and lower row of Fig. 5 show the various type fractions as function of halo mass for central and satellite galaxies, respectively. There is a weak hint that the mass dependence is stronger for central galaxies (just like their luminosity dependence is stronger, see Fig. 3). A confirmation of this trend, however, has to await a larger sample of (SDSS) data.
Note that the functional form of the mass dependence at fixed luminosity is very similar for all magnitude bins considered. Similarly, the functional form of the luminosity dependence at fixed halo mass is very similar for all mass bins. This suggests a simple, separable form for the early and late type fractions as function of luminosity and mass, i.e., , with and two (monotonic) functions. Such a separable form was adopted by van den Bosch et al. (2003) and Cooray (2005) in their studies of the conditional luminosity functions of early and late type galaxies in the 2dFGRS. The results presented here provide support for these functional forms, albeit in retrospect.
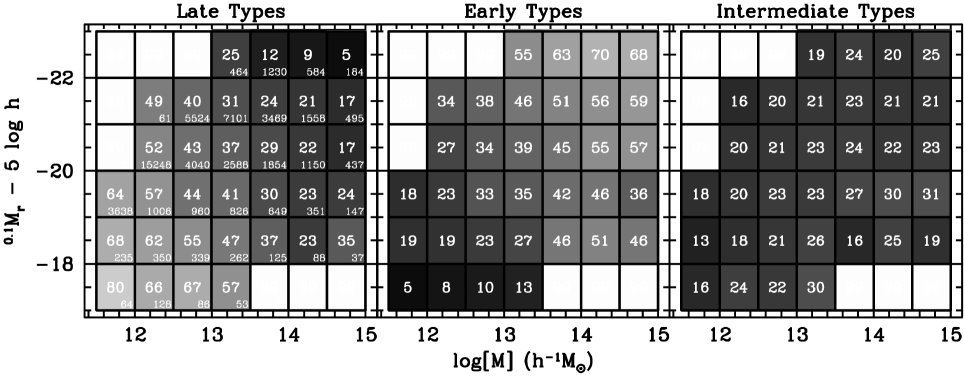
Finally, for completeness, Fig. 6 shows the same results once more, but now in a two-dimensional representation. The grayscale represents the fraction of late, early, and intermediate type galaxies in each mass-luminosity bin. The reader can read off these percentages (big, white number in the center of each cell), as well as the total number of galaxies in each bin (small, white number in lower right corner of each cell).
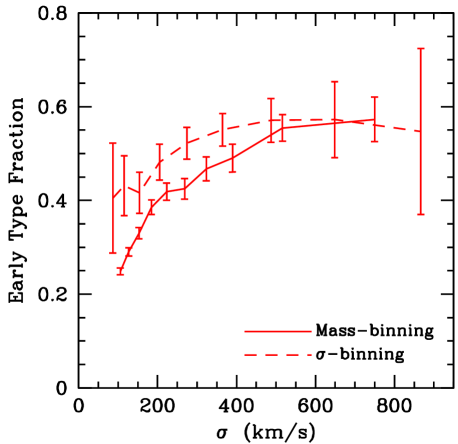
Our finding that the late type fraction decreases with increasing halo mass is in agreement with previous results from Martínez et al. (2002) and Yang et al. (2005c). On the other hand, Tanaka et al. (2004), de Propris et al. (2004) and Balogh et al. (2004b) find no significant dependence of the late or early type fraction on the velocity dispersion of massive groups and clusters. There are two reasons for this apparent discrepancy. First of all, our sample is significantly larger than that of previous studies. This not only results in significantly smaller errorbars, but also allows us to consider a much larger dynamic range in halo masses. Secondly, as we show in Appendix B, using the velocity dispersion as a mass estimator naturally tends to smear out the mass dependence. This is also illustrated in Fig. 7, were we plot the early-type fraction of galaxies with (using a volume limited sample) as function of the group velocity dispersion. The solid lines use our mass estimator (based on group luminosity), converted to velocity dispersion using equation (A5). Dashed lines use a binning based on the actual velocity dispersion of the member galaxies. Only groups with 6 members or more are included, although the results look similar when using all groups with 3 members or more. Note that over the range , which is the range used in Balogh et al. (2004a), the early-type fraction is basically flat when using the velocity dispersion of the member galaxies. This explains the discrepancy between the results presented here and those in the previous studies listed above.
Finally, there have been a number of recent studies that used the clustering properties of early and late type galaxies to constrain the type fractions as function of halo mass. Magliocchetti & Porciani (2003), van den Bosch et al. (2003), and Collister & Lahav (2005) all used the two-point correlation functions of early and late type galaxies in the 2dFGRS to infer that the late type fraction has to decrease smoothly with halo mass, in good, qualitative agreement with the results presented here. See also Cooray (2005) for a somewhat different analysis, but with the same result. An exception to this behavior was found by Zehavi et al. (2004), who inferred a late type fraction from the correlation functions extracted from the SDSS DR2 that decreases with halo mass down to a minimum at , followed by a subsequent increase. Unfortunately, as demonstrated in van den Bosch et al. (2003), the uncertainties on the type fractions as inferred solely from the clustering data are fairly large, so that we do not consider the results of Zehavi et al. (2004) to be in serious conflict with those presented here.
4.3 Dependence on Halo-centric Radius
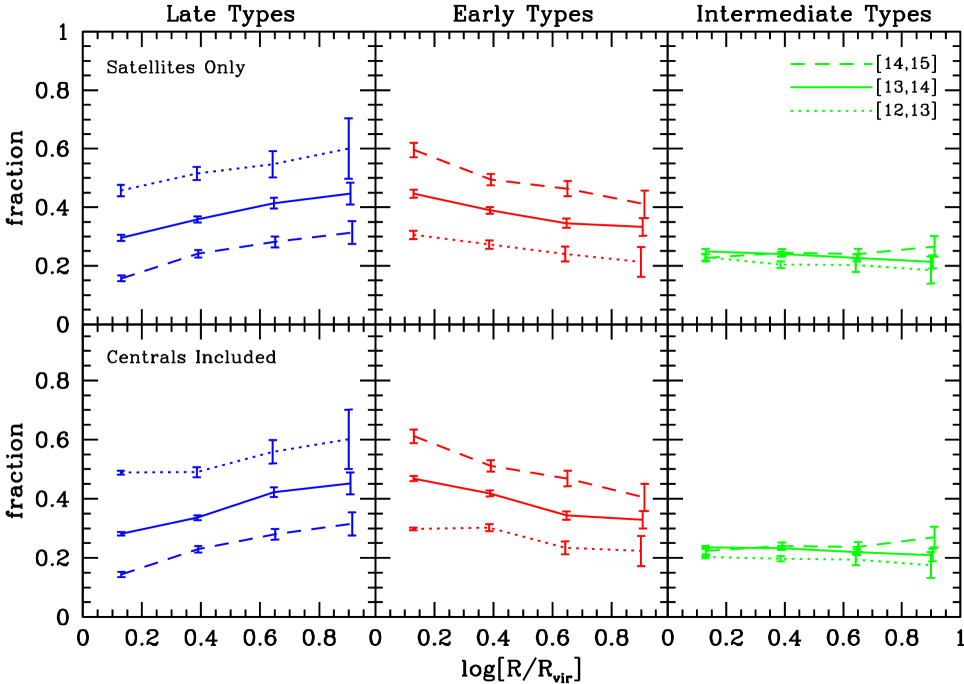
Thus far we have focussed on the luminosity and mass dependence of galaxy type fractions. Here we address the dependence on halo-centric radius, i.e., we explore the environment dependence on scales . In order to be able to discriminate type segregation from luminosity segregation we investigate the radial dependence for four magnitude bins. As above, for each magnitude bin we construct a volume limited sample, in which we only include haloes that fall entirely within this volume. For each galaxy we compute the projected distance, , to the (luminosity weighted) group center, at the (luminosity weighted) redshift of the group. In order to allow groups of different masses to be stacked together, we normalize these radii to the group’s virial radius 444Virial radii are computed from our group masses, which we convert to virial masses using the relation between halo mass and concentration in Bullock et al. (2001). Results are shown in Fig. 8 for groups in two separate mass ranges. Since central galaxies are special, we have excluded them from our analysis, so that Fig. 8 only reflects the type fractions of satellites.
In agreement with previous studies (e.g., Postman & Geller 1984; Biviano et al. 2002; Domínguez et al. 2002; Girardi et al. 2003; Gómez et al. 2003; Goto et al. 2003; Goto et al. 2004) we find that the late type fractions increase towards the outskirts of the groups. Since this trend is virtually identical for all four magnitude bins, it is not a reflection of luminosity segregation (see also Girardi et al. 2003).
Having established that there is no significant luminosity dependence at fixed halo mass and radius, we now increase the signal to noise by computing the type fractions over the entire magnitude range from and over the entire redshift range . Note that this is not a volume limited sample. However, since we have shown that there is no significant luminosity dependence, Malmquist bias should not affect these results. We have verified that using a weighting yields virtually identical results. Due to the increase in the signal to noise we can now also probe the radial dependence in haloes with masses in the range (results for this mass bin are not shown in Fig. 8 because they are too noisy). Results are shown in the upper panels of Fig. 9. Except for a normalization offset, which reflects the halo mass dependence of the type fractions, the radial dependence is the same for all three mass bins. In all cases, the late type fraction increases by percent going from to . Although this may seem a relatively small increase, it is important to realize that we observe the radial dependence in projection. Furthermore, typical orbits in dark matter haloes have fairly large apo- to pericenter ratios of or larger (e.g., Ghigna et al. 1998; van den Bosch et al. 1999), which together with the projection makes the observed trend appear much weaker than the real trend.
Our result that the radial trend is independent of halo mass is in conflict with Domínguez et al. (2002) who, using the 100K data release of the 2dFGRS, found no significant radial dependence of the late type fraction in haloes with . There are two reasons for this discrepancy. First of all, our sample is significantly larger, resulting in smaller errorbars. Secondly, as far as we can tell, Domínguez et al. (2002) included the central galaxies in their analysis. If we do the same, we obtain the results shown in the lower panels of Fig. 8. Note that the inclusion of central galaxies slightly boosts the late type fraction in the inner most radial bin, especially for low mass haloes. This reduces the overall radial trend, and for the mass bin with the data is now consistent with no significant radial dependence, in agreement with Domínguez et al. (2002). Since central galaxies are special in many respects, we feel, however, that it is more appropriate to study any radial dependence using satellite galaxies only.
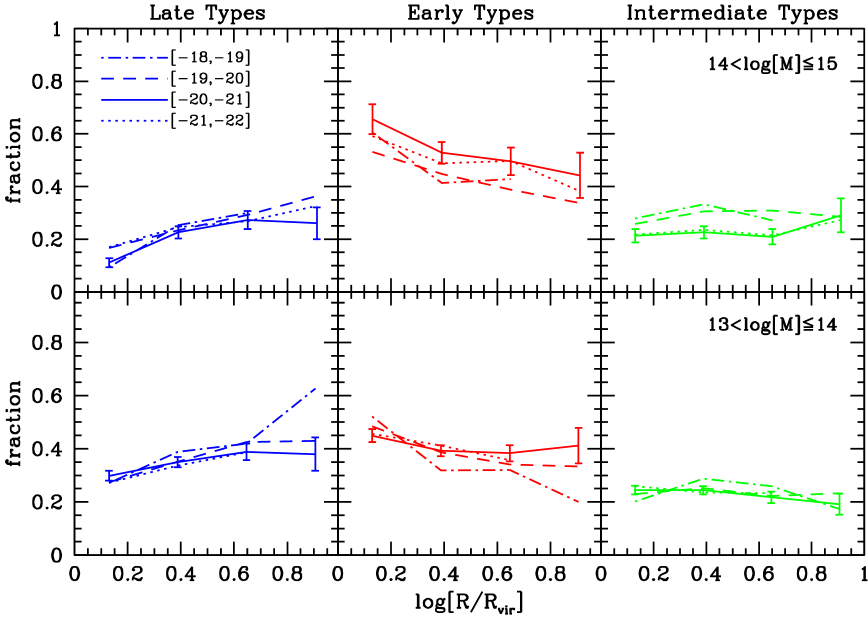
Finally we note that the intermediate type fraction is, in addition to being independent of galaxy luminosity and group mass, also independent of halo-centric radius (in all mass bins, and for all luminosity bins). Thus, a randomly selected galaxy, whether faint or bright, whether in a low mass halo or a cluster, and whether close or far from the group/halo center, has a percent chance of being an intermediate type galaxy (see Section 5.3 for discussion).
4.4 Dependence on Central Galaxy Type
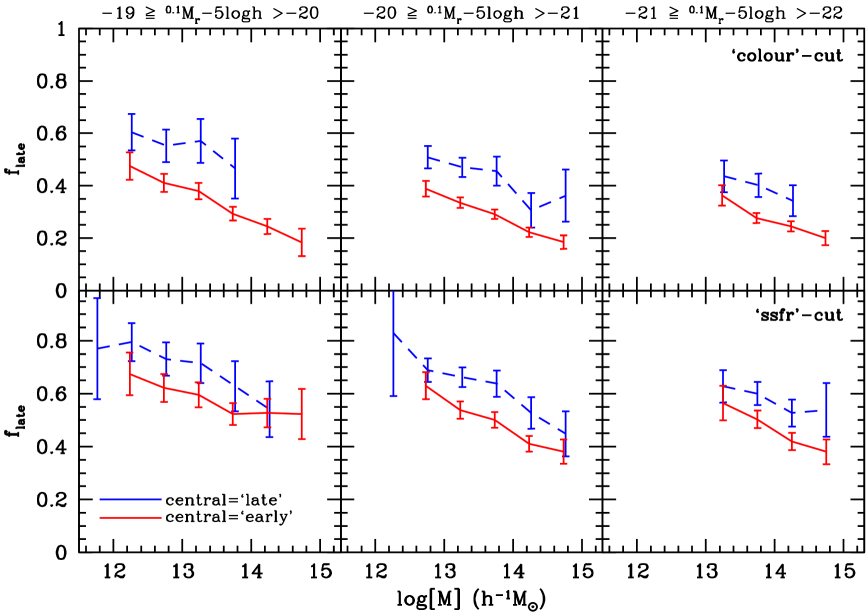
Next we investigate whether the properties of satellite galaxies correlate with those of their central galaxy. Fig. 10 plots the late type fraction as function of halo mass for three different magnitude bins (again computed using volume limited samples). Here we use a different type classification than in the rest of this paper. In the upper panels we split galaxies in late and early types only (i.e., no intermediate types are defined here), using the colour cut given by equation (1). Galaxies that are bluer than this cut are termed late types. In the lower panels the split in early and late types is based on the SSFR cut of equation (2). Galaxies with a SSFR that is higher than this cut are called late types. In each panel in Fig. 10 blue, dashed lines indicate the late type fraction of satellites in haloes in which the central galaxy is also a late type. Red, solid lines correspond to haloes with an early type central galaxy. Note that the luminosity of the central galaxy is not restricted to fall within the magnitude bin indicated.
As is evident from Fig. 10, haloes with a late type central galaxy have a significantly higher fraction of late type satellites than haloes of the same mass but with an early type central galaxy. This difference is evident over the entire ranges of masses and luminosities explored. Apparently, satellite galaxies ‘know’ about the properties of their central galaxy.
This phenomenon, which we term ‘galactic conformity’, is a new result that has not been noticed before. Some studies, however, have found correlations that point in the same direction. Wirth (1983), studying the galaxy content of groups and clusters using photographic plates, noted that the direct environment of elliptical galaxies contain a higher fractions of early types than the average of the field. Hickson et al. (1984), studying compact groups, noticed that if the brightest galaxy is a spiral the fainter group members also tend to be spirals. Ramella et al. (1987), analyzing the morphological content of loose groups in the catalogue of Geller & Huchra (1983), noticed that the fraction of elliptical galaxies is significantly higher if the first-ranked group member is also an elliptical. None of these studies, though, performed the analysis as a function of group mass. Since the early type fraction increases with halo mass for both central and satellite galaxies (see Section 4.2), a type-correlation between the central galaxy and its satellites arises naturally when using a sample of groups that span a range in masses. Indeed, Osmond & Ponmon (2004), studying a sample of 60 galaxy groups with existing X-ray data, also noticed that the spiral fraction was significantly higher if the brightest group galaxy also was a late type. The corresponding groups, however, where found to have a lower velocity dispersion and no detected X-ray emission, suggesting that they had a lower mass on average. What is special about the ‘galactic conformity’ presented here, is that such a correlation exists at a fixed halo mass, and for satellites of a fixed range in magnitudes. This finding puts intriguing new constraints on galaxy formation models, which we briefly address in Section 5.2.
4.5 The Correlation between Galaxy Properties and Halo Mass
Thus far we have only focussed on the fractions of early, late and intermediate type galaxies. We now examine how the median colour, SSFR, and concentration of galaxies scale with halo mass. As before, we discriminate between luminosity dependence and halo mass dependence by splitting the galaxy population in a number of magnitude bins. For each bin we construct a volume limited sample, and only consider groups that fall entirely within this volume. Results are shown in Fig. 11, which plots the median colour (upper panels), SSFR (panels in middle row), and concentration (lower panels) as function of halo mass555We have also examined the average properties (not shown), and found the relations to be extremely similar.. Results are shown for five magnitude bins and separately for all galaxies, late type galaxies, early type galaxies and intermediate type galaxies.
If we first focus on the relations for all galaxies (panels in left column), one notices that the correlations of all three galaxy properties with halo mass are fairly weak at fixed luminosity. To make this a bit more quantitative, we estimate the gradients of the median properties as function of mass at fixed luminosity, and as function of luminosity at fixed mass. For the luminosity and mass dependence of the median colour we find
| (4) |
For the SSFR these gradients are
| (5) |
and for the concentration we find
| (6) |
Although these numbers are fairly rough estimates, it is clear that in all three cases the luminosity dependence is stronger than the halo mass dependence (when both luminosity and mass are expressed in solar units).
Note that this contrasts strongly with the type fractions, which depend more strongly on halo mass than on luminosity (see Section 4.2). We can reconcile this with the strong luminosity dependence of the median colour and SSFR by realizing that the cuts in colour and SSFR used to define the galaxy types scale with luminosity according to
| (7) |
(cf. equations [1] and [2]). Note that these gradients are comparable to those of the median properties at fixed mass. This shows that at fixed halo mass, the median colour and SSFR scale roughly with luminosity in the same way as the corresponding bimodality scales. The fractions of galaxies on either site of this bimodality scale, however, only depend weakly on luminosity at fixed halo mass.
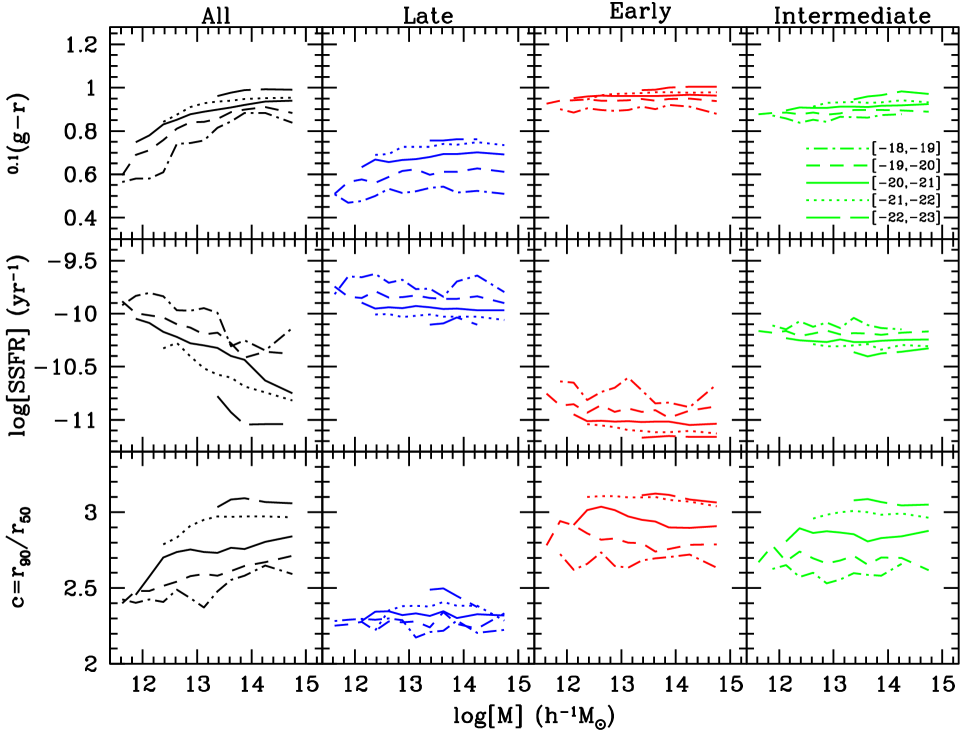
As is evident from the three right-hand columns of Fig. 11 the median properties of a galaxy of given luminosity and type are virtually independent of halo mass. The mass dependence of the median properties of all galaxies, therefore, owes entirely to the mass dependence of the type fractions. In as far as halo mass is a reliable proxy for the local surface density of galaxies, this is in agreement with Balogh et al. (2004a) and Tanaka et al. (2004) who found that although the fraction of star forming galaxies (defined according to the equivalent width of the H line) depends strongly on , the median equivalent width of star forming galaxies (those with Å) does not show any -dependence. Our results also agree with those of Kauffmann et al. (2004), who found that the concentration parameter of galaxies is independent of galaxy number density at fixed stellar mass.
4.6 Conditional Probability Distributions
The type fractions and medians discussed thus far are simple scalars expressing some properties of the underlying probability distributions. For completeness, we now present, for some illustrative cases, these full distributions. First we split our sample of galaxies (those that have been assigned to groups) according to type and luminosity (using five volume limited magnitude bins). For each galaxy in each luminosity-type bin we look up the mass of the group of which it is a member. Fig. 12 plots the resulting conditional mass functions , with the luminosity in the -band. The histograms in the upper panels show . As expected, bright galaxies always reside in massive haloes. The conditional mass function for faint galaxies, however, reveals a bimodal distribution: a narrow peak at low halo masses, corresponding to central galaxies, and a very broad wing to high halo masses, corresponding to satellite galaxies. Note that the functional form of derived here is in good agreement with predictions based on the conditional luminosity function presented in Yang et al. (2003) and Cooray (2005). The blue, red and green histograms in the upper panels indicate the contributions to due to late, early and intermediate type galaxies, respectively. In agreement with the results shown above, bright galaxies in massive haloes are predominantly early types, while faint galaxies in low mass haloes are dominated by late types. However, one can also see that those faint galaxies that reside in the most massive haloes are more likely to be an early type.
The latter is more evident when one compares the conditional mass functions of early and late type galaxies, shown in the panels in the middle two rows. For faint galaxies, and are clearly different, in that the former is clearly more skewed towards low . This implies that a faint, early type galaxy lives in a halo that, on average, is more massive than a halo hosting a late type galaxy of the same luminosity. This is in good agreement with other studies. In particular, Blanton et al. (2005b) studied the relationship between environment and various properties of galaxies in the SDSS. They computed the mean local overdensity as function of both luminosity and several other parameters, including colour and Sersic index. Although their overdensities are measured using a fixed metric scale of , which, as we have argued in Section 1, is difficult to interpret in terms of halo masses, their results paint a very similar picture: blue faint galaxies live in low density regions (i.e., are central galaxies in their own, low mass haloes), while red faint galaxies reside in regions with a similar overdensity as that of red bright galaxies (i.e., they are satellite galaxies in clusters). This is also consistent with clustering data. In particular, Norberg et al. (2002) have shown that the correlation length of faint early types is much higher than that of late type galaxies of the same luminosity, indicating that they live in more massive haloes.
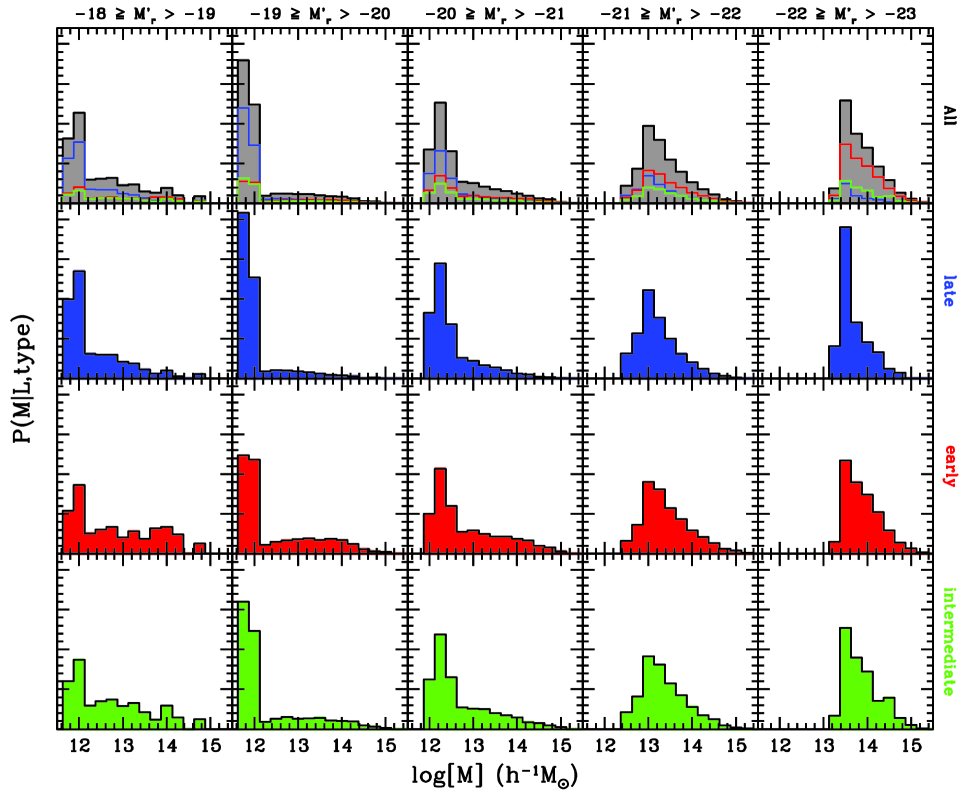
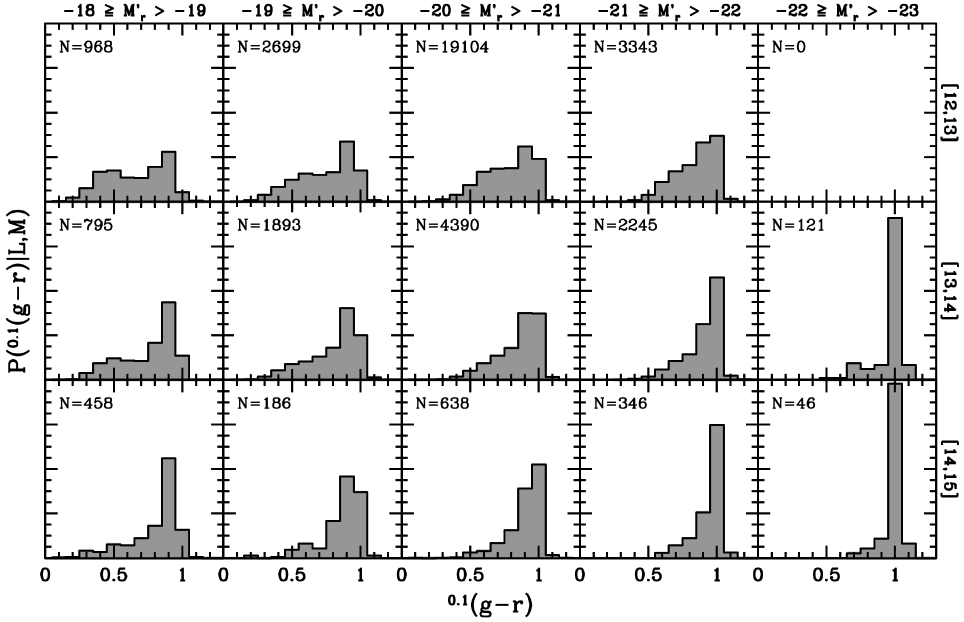
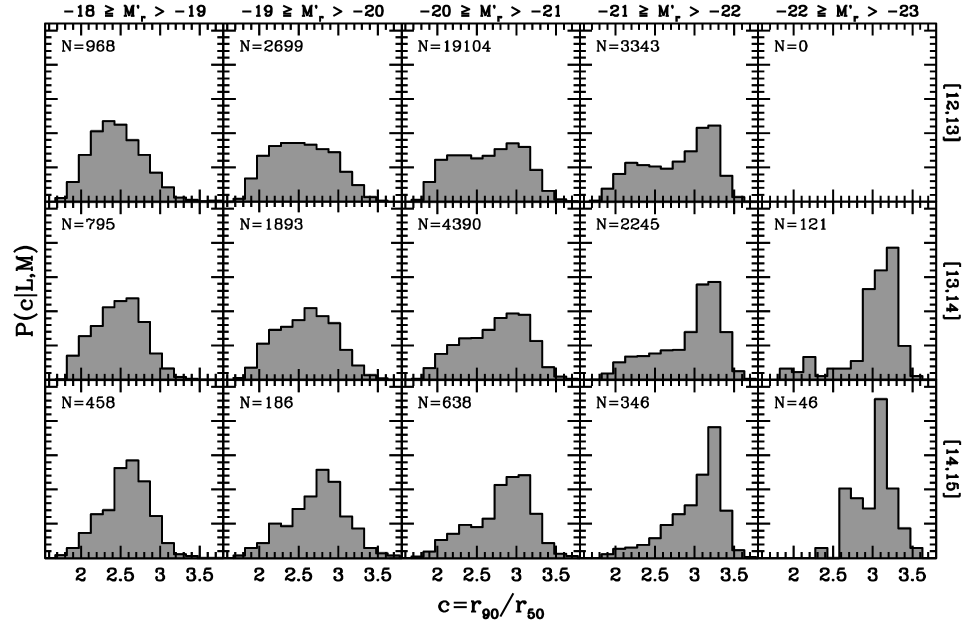
Fig. 13 plots the conditional colour distributions for three bins in halo mass and five (volume limited) bins in absolute magnitude. There is a clear trend that the fraction of red galaxies increases with both luminosity and with halo mass, in agreement with the results presented above. Note also that, at fixed halo mass, the colour distributions for and for are remarkably similar, consistent with the fact that the galaxy type fractions are independent of luminosity over this magnitude range (cf. Fig. 4). Finally, Fig. 14 plots the distributions of galaxy concentration conditional on luminosity and halo mass. These nicely illustrate how the average concentration increases with both halo mass and luminosity, as already shown in Fig. 11. Although all main trends visible in Figs. 12 – 14 are already evident from the previous discussion based on type fractions and median properties, the full distributions shown here contain useful, additional information not evident from the fractions or the means.
5 Discussion
5.1 Implications for Galaxy Formation & Evolution
In the current paradigm of galaxy formation, galaxies form in extended dark matter haloes. In the pure ‘nature’ scenario, the properties of a galaxy depend only on the mass and formation history of the dark matter halo in which it resides. However, a galaxy also experiences interactions of various kinds with its environment. Examples of these are ram-pressure stripping, strangulation, and galaxy harassment. These, and other, ‘nurture’ processes may also play an important role in setting the final properties of a galaxy.
Ever since the discovery that galaxy properties correlate with their environment, their has been an ongoing debate as to the relative importance of nature versus nurture processes in regulating galaxy properties. In this paper we have analyzed how a variety of galaxy properties depend on halo mass, using a sample of galaxies distributed over haloes (galaxy groups). These results provide a testbed for comparison with galaxy formation models, and may provide important insights regarding the nature-versus-nurture debate.
Unfortunately, many poorly understood, intertwined processes play a role in galaxy formation, so that an interpretation of our results is far from straightforward. For example, although the mere presence of a correlation between galaxy properties and environment is often taken as evidence for a dominant role of ‘nurture’ processes, it is important to realize that many, if not all, of these correlations can equally well be explained within a pure ‘nature’ scenario (see below). This makes it extremely difficult to discriminate between the various physical processes. Below we briefly discuss some of these processes, and emphasize how their (often crude and speculative) predictions compare to the results presented above.
5.1.1 The nature scenario
In the ‘nature’ scenario, the global properties of the galaxy population owe mainly to the formation history of their dark matter haloes. During quiescent growth phases gas can cool and form a centrifugally supported disk. Star formation slowly and continuously converts the gas into stars, resulting in a typical late-type galaxy with blue colors and an ongoing SFR. During a major merger of two dark matter haloes, the (central) galaxies are likely to merge as well due to dynamical friction. If their mass ratio is sufficiently small, the outcome of this merger event will most likely resemble a spheroid (e.g., Toomre & Toomre 1972), while most gas is likely to be consumed in a starburst (e.g., Mihos & Hernquist 1996). If new accretion of gas can somehow be prevented, for example by invoking AGN feedback (Croton et al. 2005), the resulting galaxy will quickly become ‘red and dead’, characteristic of a genuine early-type. If, however, the accretion of new gas can not be prevented, a new disk may start to grow around the spheroid, slowly transforming the early type into a late type.
This is the standard picture adopted in virtually all semi-analytical models for galaxy formation. When assigning galaxy types according to their bulge-to-disk ratio, these models yield an increasing fraction of early types with increasing halo mass and with decreasing halo-centric radius (Diaferio et al. 2001; Okamoto & Nagashima 2001; Springel et al. 2001; Berlind et al. 2003), all in qualitative agreement with observations. This suggests that the global morphology-density relation is built in at a very fundamental level in hierarchical formation theories and can be explained within the ‘nature’ scenario (see also Evrard, Silk & Szalay 1990). However, all models have problems in trying to match the radial dependence of S0s, which seems to require additional (‘nurture’) processes.
In addition, a more detailed comparison between the model predictions and the results presented here indicates another potential problem. Since galaxy-galaxy merging is inefficient in massive haloes, all semi-analytical models predict a ‘saturation’ of the early type fraction in haloes above a certain mass. For example, the models of Diaferio et al. (2001) predict that the fraction of early types (defined according to bulge-to-disk ratio) increases with halo mass up to , after which the early type fraction reveals a modest decline. This is inconsistent with our results, which show that the early type fraction continues to decrease up to the most massive haloes analyzed (). Berlind et al. (2003) and Zheng et al. (2004) have shown that the semi-analytical models of Cole et al. (2000) predict that the fraction of ‘young’ galaxies decreases with increasing halo mass up to , after which the fraction remains constant. Although ‘young’ galaxies are not necessarily the same as our late types, this again seems inconsistent with the findings reported here. It remains to be seen whether this inconsistency disappears when for example AGN feedback is taken into account, or whether it signals the need for additional processes to describe type transformations.
5.1.2 Ram pressure stripping
Whenever a galaxy orbits a hot, gaseous halo it may experience ram-pressure stripping (Gunn & Gott 1972). This causes a rapid removal of gas, shutting off star formation, and transforming a late type into an early type. Note, however, that the morphology of the galaxy is not modified: a disk will remain a disk. Ram pressure stripping is therefore mainly invoked as a mechanism to transform spirals into S0s. Since the latter are typically red and passive, they are part of the early types in our classification scheme.
In order to estimate how the effectiveness of ram pressure stripping depends on the masses of the host halo and the galaxy, consider a halo of mass and circular velocity . In addition, we assume that the galaxy is embedded in a subhalo of mass and circular velocity . We assume that both and obey the virial relations so that and . Now consider a disk with surface density , consisting of both stars and gas, embedded within . The pressure exerted on the gas in this disk due to the hot gas associated with is , where is the baryonic mass fraction of that is in a hot component (note that all virialized haloes have the same average density, independent of halo mass). The restoring force per unit area on the gas disk due to the self-gravity of the disk is , with the disk mass fraction in stars. To relate to the subhalo mass we use the disk formation models of Mo, Mao & White (1998), according to which .
Ram pressure stripping occurs when , which is the case whenever
| (8) |
with some constant. If we (naively) assume that satellite luminosity is a reasonable proxy for , we can use equation (8) to predict qualitatively how the late type fractions should scale with halo mass and halo-centric radius. According to (8), at fixed luminosity the ram pressure efficiency scales as , or even stronger if increases with halo mass as suggested by X-ray measurements. This predicts a late type fraction that decreases with halo mass, as observed. At fixed halo mass , however, equation (8) predicts that the efficiency of ram pressure stripping scales as . This implies a late type fraction, at fixed halo mass, which increases with increasing luminosity, which is clearly inconsistent with the data. Furthermore, if ram pressure stripping is the main process responsible for the radial type dependence, one predicts the effect to be more pronounced in more massive haloes, and in haloes of fixed mass to be less pronounced for more luminous satellites. Both of these predictions are inconsistent with the data, which shows no luminosity dependence at fixed halo mass, and an equally strong radial trend for all halo masses. We therefore conclude that ram pressure stripping can not be the dominant effect that causes type transformations. A similar conclusion was recently obtained by Goto (2005) based on a detailed study of the velocity distribution of galaxies within clusters.
5.1.3 Strangulation
As long as a (central) galaxy continues to accrete new gas, it can continue to form stars. As soon as it enters a larger system, and becomes a satellite galaxy, it is deprived of its hot gas reservoir. This shuts off the accretion of new gas, so that the star formation rate will come to a halt after the galaxy has consumed (part of) its cold gas. This supply-driven decline in star formation rates of satellite galaxies was first suggested by Larson, Tinsley & Caldwell (1980), and is often called ‘strangulation’ (Balogh, Navarro & Morris 2000).
The main difference between strangulation and ram pressure stripping is that the time scale for strangulation is much longer than for stripping. It has been argued that such long quenching time scales are inconsistent with the observation that the distribution of H equivalent widths of starforming galaxies is independent of environment (Balogh et al. 2004a). However, using the relations between three different SFR indicators, Kauffmann et al. (2004) have actually argued in favor of a long time scale ( Gyr) for star formation suppression. More detailed modeling is required to investigate these issues in more detail. Important constraints may also come from the pronounced bimodality in the colour magnitude relation (e.g., Balogh et al. 2004b; Bell et al. 2004).
Unlike ram pressure stripping and harassment, strangulation is a standard ingredient in most semi-analytical models for galaxy formation (Kauffmann, White & Guiderdoni 1993; Diaferio et al. 2001), where it helps to explain the enhanced early type fraction in more massive haloes, simply because they contain more satellite galaxies. As with ram pressure stripping, however, strangulation will only modify the colours and SFRs, but not the actual morphologies. Thus, while it may be an important process to explain the enhanced fraction of S0 galaxies in dense environments, it can not explain the enhancement of spheroidals.
5.1.4 Harassment
Dark matter haloes are populated with numerous subhaloes of a wide range of masses (e.g., Gao et al. 2004; van den Bosch, Tormen & Giocoli 2005c). A satellite galaxy embedded in one of these subhaloes, is subject to frequent high speed encounters with other subhaloes (some of which may not host a luminous satellite galaxy). The impulsive heating due to these numerous encounters is termed galaxy harassment (Moore et al. 1996), and may cause morphological transformations. In the tidal approximation (Spitzer 1958), the amount of heating per encounter scales as , with the impact parameter. To get an estimate of the total heating due to impulsive encounters, it is therefore important to accurately account for the encounters with small impact parameters. Unfortunately, the tidal approximation is only valid for relatively large impact parameters (Aguilar & White 1985). This makes it extremely difficult to make accurate predictions regarding the scaling of the harassment efficiency with halo mass.
Nevertheless, one point is worth making. Galaxy harassment is often considered a mechanism that only operates in clusters of galaxies. This seems to be motivated by the fact that clusters contain hundreds to thousands of galaxies, very different from groups and galaxy sized haloes. However, in terms of dark matter subhaloes, the CDM paradigm predicts that lower mass haloes are simply scaled-down versions of cluster-sized haloes, albeit with a relatively small, mass dependent normalization (e.g., van den Bosch et al. 2005c). Since dark matter subhaloes without a luminous satellite galaxy can also cause impulsive heating, galaxy harassment is expected to occur in haloes of all masses.
Although we cannot make a robust prediction for how the harassment efficiency scales with halo mass, we may use the tidal approximation to estimate how it scales with the mass of the perturbed system. Consider a system , with mass , that experiences an impulsive encounter with a perturbed of mass . The energy increase of is given by
| (9) |
(Spitzer 1958), with the impact parameter, the encounter velocity, and the mean square radius of . We can express the harassment efficiency as the ratio of this energy change to the gravitational binding energy of , . If we use that , which holds as long as all systems have a similar density distribution, and we assume that the virial relation holds, we obtain that
| (10) |
Note that this is independent of . If harassment is the main cause of type transformations, and is a reasonable proxy for satellite luminosity, this scaling relation predicts that the type fraction should be independent of luminosity at fixed halo mass. As we have shown in Section 4.2 this is in reasonable agreement with the data, but only over the luminosity range . However, this argument is based on the assumption of self-similarity. Although this is a reasonable assumption for dark matter subhaloes, it does not apply for the satellite galaxies that reside in these subhaloes. As shown by Moore et al. (1999), low surface brightness (LSB) galaxies are much more vulnerable to harassment than high surface brightness (HSB) galaxies in a halo of the same mass. Since LSB galaxies have typically lower luminosities than HSB systems, they are expected to reside in lower mass subhaloes, on average. In this case, harassment will tend to have a bigger impact on lower mass systems. If harassment transforms late type galaxies into early type galaxies, this will result in a late-type fraction that increases with increasing luminosity (in a halo of fixed mass), in disagreement with the data. Although clearly more detailed studies of the impact of galactic harassment are needed, these simple arguments seem to disfavor harassment as a dominant physical process.
5.2 Galactic Conformity
In the standard ‘nature’ picture, adopted in all semi-analytical models of galaxy formation, the morphology of a central galaxy is related to the epoch of the last major merger, and thus to the assembly history of its dark matter halo: haloes that experienced a recent major merger, and thus assembled recently, are more likely to host a central early type. Interestingly, using a large numerical simulation, Gao, Springel & White (2005) have recently shown that haloes of given mass that assemble later are less strongly biased (i.e., are less strongly clustered). If, for some reason, a less strongly biased region produces a larger fraction of early types, this correlation between assembly redshift and halo bias might provide an explanation for galactic conformity. However, this picture has two important shortcomings. First of all, it is well known that less massive haloes are less strongly biased (e.g., Mo & White 1996). If a higher bias indeed results in a smaller early type fraction, one would therefore expect an early type fraction that decreases with increasing halo mass, opposite to what is observed. Secondly, Gao et al. (2005) have shown that the bias only depends on halo assembly time for haloes less massive than . Our results, however, indicate that galactic conformity is present in haloes both more massive and less massive than this.
Alternatively, galactic conformity might owe to ‘nurture’ processes. For example, X-ray observations show that haloes with pronounced X-ray emission contain virtually always an early type central galaxy (e.g., Ebeling, Voges & Böhringer 1994; Osmond & Ponmon 2004). Since the presence of X-ray emission indicates a relatively dense, hot gas halo, conformity might simply reflect an enhanced early type fraction of satellites due to ram pressure stripping. However, as we have argued above, if ram pressure stripping is the dominant process responsible for type transformations, one would expect that, at given halo mass, the early type fraction decreases with increasing satellite luminosity, opposite to what is observed. Alternatively, conformity might be related to strangulation, in which case satellites in haloes with a late type central galaxy need to have been accreted more recently (so that their SFRs are not yet completely quenched). It is unclear, however, why this would be the case. The final nurture process that we have discussed in this paper, harassment, does not seem to provide a natural explanation for conformity either: there is no obvious reason why haloes with an early type central should have an enhanced harassment rate compared to haloes of the same mass, but with a late type central.
Clearly, galactic conformity poses an intriguing, new challenge for galaxy formation models. It remains to be seen whether the latest semi-analytical models that include AGN feedback (Croton et al. 2005) can explain conformity, or whether additional, new model ingredients are required.
5.3 The Physical Nature of Intermediate Type Galaxies
We have shown that the fraction of intermediate type galaxies is , independent of luminosity, independent of halo mass, independent of halo-centric radius, and independent of whether the galaxy is a central galaxy or a satellite. Intermediate type galaxies are defined as galaxies that are ‘active’, yet ‘red’ (both with respect to the magnitude-dependent bimodality scales). They occupy the region in the colour-SSFR plane where the early and late type branches overlap. Therefore, it seems natural to assume that they consist of a mix of dusty late types (probably due to an edge-on appearance, which enhances the amount of extinction) and early types with a SSFR that is overestimated. As discussed in Brinchmann et al. (2004), the star formation rate of galaxies with colours redder than are uncertain by an order of magnitude, due to degeneracies between age, metallicity and dust.
If the intermediate types are predominantly early (late) types, their halo occupation statistics should reflect those of the early (late) types, which they clearly do not. Therefore, if indeed the intermediate types consist of early and late types, their fractional contribution must be close to 50 percent at all luminosities, in haloes of all masses, and at all halo-centric radii. This seems extremely contrived. However, alternative explanations seem even more implausible. For example, if the intermediate types are a class of galaxies that are truly distinct from early and/or late types, it is at least as puzzling why they account for 20 percent of all galaxies independent of luminosity, mass, or radius. Clearly, a more in-depth investigation regarding the nature of this class of galaxies is required to provide more insight into their nature.
6 Summary
Using the halo-based group finder of Yang et al. (2005a), we have constructed a large galaxy group catalogue from the SDSS NYU-VAGC of Blanton et al. (2005a). Group (halo) masses are determined from the group luminosity, which, as we have demonstrated, yields more reliable halo masses than using the velocity dispersion of the group members. Our catalogue also contains ‘groups’ (haloes) with only a single member. This allows us to consider a significantly larger dynamic range of halo masses. The final catalogue consists of galaxies in groups with masses . For 97 percent of these galaxies we have obtained the stellar masses and SFRs from the catalogues Kauffmann et al. (2003) and Brinchmann et al. (2004), respectively.
In this first paper in a series, we have investigated the correlation between various galaxy properties and halo mass. Using the magnitude dependent bimodality scale in the colour-magnitude relation we have split the population of galaxies into ‘red’ and ‘blue’ subsamples. In addition, we have used the relation between magnitude and SSFR to split the galaxies into ‘active’ and ‘passive’. The majority of galaxies are either ‘red’ and ‘passive’ (we call these early types) or ‘blue’ and ‘active’ (which we call late types). About 20 percent of all galaxies, however, are ‘red’ and ‘active’, while only one percent are ‘blue’ and ‘passive’. Except for this latter minority class, galaxies follow a tight correlation between colour and SSFR, with two distinct branches: one populated by early types, the other by late types. These two branches overlap at and , where the ‘red’ and ‘active’ galaxies are located. Without further information it is unclear whether these are a physically distinct class of galaxies, or whether they are mainly early types (probably with an overestimated SSFR) or mainly late types (probably edge-on disks). Therefore, we have provisionally called them intermediate types.
Using our group catalogue, we have investigated the various type fractions as function of halo mass, halo-centric radius, and central galaxy type. The main results are:
-
•
The early (late) type fraction increases (decreases) strongly with increasing luminosity. This luminosity dependence is stronger for central galaxies than for satellite galaxies (Section 4.1).
-
•
At fixed halo mass, the early type fraction increases only weakly with increasing luminosity. Most of the luminosity dependence is only evident at the bright and faint end. In the regime the luminosity dependence is insignificant. This holds over the entire mass range probed (), and implies that halo mass is more important for determining the properties of a galaxy than is galaxy luminosity. A significant part of the strong luminosity dependence is simply a reflection of the fact that more luminous galaxies reside in more massive haloes (Section 4.2).
-
•
At fixed luminosity, the early (late) type fraction increases (decreases) with increasing halo mass. Most importantly, we find that this mass dependence is smooth and that it persists over the entire mass range probed: there is no break or feature at any mass scale. This differs from previous work. In particular, various studies have found that the environment dependence becomes weaker, or completely vanishes, below a characteristic density scale. This has been interpreted as indicating that group-specific processes are the dominant cause of type transformations. We have argued, however, that this characteristic scale merely reflects the scale at which the physical meaning of the density estimator transits from a local density () estimator to a global, large scale density () estimator. Our results, based on halo masses, find no indication whatsoever that group- and/or cluster-specific processes play a dominant role in type transitions (Section 4.2).
-
•
The early (late) type fraction decreases (increases) with increasing halo-centric radius. Contrary to previous studies, who found no radius dependency in haloes with , we find a self-similar dependence in haloes of all masses probed (). This discrepancy is most likely due to the fact that previous studies included the central galaxies and were based on significantly smaller samples (Section 4.3).
-
•
The intermediate type fraction is percent, independent of luminosity, independent of halo mass, independent of halo-centric radius, and independent of whether the galaxy is a central galaxy or a satellite galaxy. Probably the easiest explanation is that intermediates consist of an equal mix of early and late types. Although consistent with the fact that intermediate types lie in the region in the colour-SSFR plane where the early and late type branches overlap, it is extremely puzzling that the fractional mix does not scale with luminosity, halo mass, or halo-centric radius. A more in-depth study is required to investigate the nature of this class of galaxies in more detail (Sections 4.2 and 4.3).
-
•
The properties of a satellite galaxy are strongly correlated with those of its central galaxy. In particular, we have shown that the early type fraction of satellites is significantly higher for a halo with an early type central galaxy than for a halo of the same mass but with a late type central galaxy. This phenomenon, which we call ‘galactic conformity’, is present in haloes of all masses and for satellites of all luminosities (Section 4.4).
-
•
The median physical properties of late, early, and intermediate type galaxies of a given luminosity do not depend on halo mass. The relative fractions of these types, however, do. Since different galaxy types have different median properties, this halo mass dependence of the type fractions causes a halo mass dependence of the median properties of the full galaxy population (Section 4.5).
We have discussed the possible implication of these findings for our understanding of galaxy formation and evolution. Using simple scaling arguments, we have argued that both ram pressure stripping and galaxy harassment are not the major processes responsible for galaxy transformations, as they predict an increasing late type fraction with increasing luminosity in haloes of fixed mass, opposite to what is observed. We therefore suggest that merger history and strangulation (i.e., the quenching of star formation as soon as a galaxy becomes a satellite galaxy) are the main ingredients required to predict whether a galaxy ends up as an early or a late type galaxy.
This conclusion, however, is still extremely speculative. For example, it still needs to be seen, whether the semi-analytical models that use strangulation and the merger history to predict galaxy types, are indeed consistent with the various observational trends presented here. In particular, we have argued that galactic conformity poses an intriguing new challenge for galaxy formation models. Although the correlations between galaxy properties and halo mass presented here provide an interesting testbed for galaxy formation models, a definite explanation for the origin of the bimodality of galaxy properties will most likely have to await a similar analysis as performed here, but at different epochs (i.e., different redshifts). It is reassuring that promising work in this direction is already under way (e.g., Gerke et al. 2005; Cooper et al. 2005).
Acknowledgements
We are extremely grateful to Michael Blanton, Guinevere Kauffmann, Jarle Brinchmann and all other people within the SDSS collaboration for producing a wonderful data set and for making their various catalogues publicly available. Michael Blanton is also acknowledged for his help with the NYU-VAGC. FvdB acknowledges useful discussions with Eric Bell, Aaron Dutton, and Anna Pasquali.
References
- [] Abazajian, K. et al, 2004, AJ, 128, 502
- [] Aguilar L.A., White S.D.M., 1985, ApJ, 295, 374
- [] Baldry I.K., Glazebrook K., Brinkmann J., Ivezić Ž., Lupton R.H., Nichol R.C., Szalay A.S., 2004, ApJ, 600, 681
- [] Balogh M.L., Morris S.L., Yee H.K.C., Carlberg R.G., Ellingson E., 1997, ApJ, 488, L75
- [] Balogh M.L., Morris S.L., Yee H.K.C., Carlberg R.G., Ellingson E., 1999, ApJ, 527, 54
- [] Balogh M.L., Navarro J.F., Morris S.L., 2000, ApJ, 540, 113
- [] Balogh M.L., et al., 2004a, MNRAS, 348, 1355
- [] Balogh M.L., Baldry I.K., Nichol R., Miller C., Bower R., Glazebrook K., 2004b, ApJ, 615, L101
- [] Beers T.C., Flynn K., Gebhardt K., 1990, AJ, 100, 32
- [] Bell E.F., Wolf C., Meisenheimer K., Rix H.-W., Borch A., Dye S. Kleinheinrich M., Wisotzki L., McInthosh D.H., 2004, ApJ, 608, 752
- [] Berlind A.A., Weinberg D.H., Benson A.J., Baugh C.M. Cole S., Davé R., Frenk C. S., Jenkins A., Katz N., Lacey C.G., 2003, ApJ, 593, 1
- [] Biviano A., Katgert P., Thomas T., Adami C., 2002, A&A, 387, 8
- [] Blair M., Gilmore G., 1982, PASP, 94, 741
- [] Blanton M. R. et al. , 2001, AJ, 121, 2358
- [] Blanton M. R. et al. , 2003a, ApJ, 592, 819
- [] Blanton M. R. et al. , 2003b, ApJ, 594, 186
- [] Blanton M. R. et al. , 2003c, AJ, 125, 2348
- [] Blanton M.R., Eisenstein D., Hogg D.W., Zehavi I., 2004, preprint (astro-ph/0411037)
- [] Blanton M.R. et al. , 2005a, AJ, 129, 2562
- [] Blanton M.R., Eisenstein D., Hogg D.W., Schlegel D.J., Brinkman J., 2005b, ApJ, 629, 143
- [] Brainerd T.G., Specian M.A., 2003, ApJ, 593, L7
- [] Brinchmann J., Charlot S., White S.D.M, Tremonti C., Kauffmann G., Heckman T., Brinkmann J., 2004, MNRAS, 353, 713
- [] Bryan G., Norman M., 1998, ApJ, 495, 80
- [] Bullock J.S., Kolatt T.S., Sigad Y., Somerville R.S., Kravtsov A.V., Klypin A.A., Primack J.R., Dekel A., 2001, MNRAS, 321, 559
- [] Byrd G., Valtonen M., 1990, ApJ, 350, 89
- [] Cole S., Lacey C.G., Baugh C.M., Frenk C.S., 2000, MNRAS, 319, 168
- [] Colless M., The 2dFGRS team, 2001, MNRAS, 328, 1039
- [] Collister A.A., Lahav O., 2005, MNRAS, 361, 415
- [] Cooper M.C., Newman J.A., Madgwick D.S., Gerke B.F., Yan R., Davis M., 2005, preprint (astro-ph/0506518)
- [] Cooray A., Sheth R., 2002, Phys. Rep. 372, 1
- [] Cooray A., 2005, preprint (astro-ph/0505421)
- [] Cooray A., Milosavljević M., 2005, ApJ, 627, L89
- [] Croton D.J., et al., 2005, MNRAS, 356, 1155
- [] De Propris R., et al., 2004, MNRAS, 351, 125D
- [] Diaferio A., Kauffmann G., Balogh M.L, White S.D.M, Schade D., Ellingson E., 2001, MNRAS, 323,
- [] Domínguez M.J., Muriel H., Lambas D.G., 2001, AJ, 121, 1266
- [] Domínguez M.J., Zandivarez A.A., Martínez H.J., Merchán M.E., Muriel H., Lambas D.G., 2002, ApJ, 335, 825
- [] Dressler A., 1980, ApJ, 236, 351
- [] Ebeling H., Voges W., Böhringer H., 1994, ApJ, 436, 44
- [] Efstathiou G., 1992, MNRAS, 256, 43
- [] Eke V.R.& The 2dFGS team, 2004a, MNRAS, 348, 866
- [] Eke V.R.& The 2dFGS team, 2004b, MNRAS, 355, 769
- [] Evrard A.E., Silk J., Szalay A.S., 1990, ApJ, 365, 13
- [] Faber S.M., et al., 2005, preprint (astro-ph/0506044)
- [] Fukugita M., Ichikawa T., Gunn J.E., Doi M., Shimasaku K., Schneider D.P., 1996, AJ, 111, 1748
- [] Gao L., White S.D.M., Jenkins A., Stoehr F., Springel V., 2004, MNRAS, 355, 819
- [] Gao L., Springel V., White S.D.M., 2005, preprint (astro-ph/0506510)
- [] Geller M.J., Huchra J.P., 1983, ApJS, 47, 139
- [] Gerke B.F. et al., 2005, ApJ, 625, 6
- [] Ghigna S., Moore B., Governato F., Lake G., Quinn T., Stadel J., 1998, MNRAS, 300, 146
- [] Girardi M., Rigoni E., Mardirossian F., Mezzetti M., 2003, A&A, 406, 403G
- [] Gómez P.L., et al., 2003, ApJ, 584, 210
- [] Goto T., Yamauchi C., Fujita Y., Okamura S., Sekiguchi M., Smail I., Bernardi M., Gomez P.L., 2003, MNRAS, 346, 601
- [] Goto T., Masafumi Y., Tanaka M., Okamura S., 2004, MNRAS, 348, 515
- [] Goto T., 2005, MNRAS, 356, L6
- [] Gunn J.E., Gott J.R., 1972, ApJ, 176, 1
- [] Hashimoto Z., Oemler A., Lin H., Tucker D.L., 1998, ApJ, 499, 589
- [] Hashimoto Z., Oemler A., 1999, ApJ, 510, 609
- [] Hickson P., Ninkov Z., Huchra J., Mamon G., 1984, in Clusters and Groups of Galaxies, eds. F. Mardirossian, G. Giuricin, M. Mezzetti, Reidel, Dordrecht, Holland, p. 367
- [] Hogg D.W., et al., 2003, ApJ, 585, L5
- [] Hogg D.W., et al., 2004, ApJ, 601, L29
- [] Hoyle F., Rojas R.R., Vogeley M.S., Brinkmann J., 2005, ApJ, 620, 618
- [] Huchra J.P., Geller M.J., 1982, ApJ, 257, 423
- [] Jing Y.P., Suto, Y., 2002, ApJ, 574, 538
- [] Kauffmann G., White S.D.M, Guiderdoni B., 1993, MNRAS, 264, 201
- [] Kauffmann G., et al. , 2003, MNRAS, 341, 33
- [] Kauffmann G., White S.D.M, Heckman T.M., Ménard, Brinchmann J., Charlot S., Tremonti C., Brinkmann J., 2004, MNRAS, 353, 713
- [] Kelm B., Focardi P., Sorrentino G., 2005, preprint (astro-ph/0506531)
- [] Kepner J., Fan X., Bahcall N., Gunn J., Lupton R., Xu G., 1999, ApJ, 517, 78
- [] Kim R.J.S. et al, 2002, AJ, 123, 20
- [] Kochanek C.S., White M., Huchra J., Macri L., Jarrett T.H., Schneider S.E., Mader J., 2003, ApJ, 585, 161
- [] Kuehn F., Ryden B.S., 2005, preprint (astro-ph/0508337)
- [] Larson R.B., Tinsley B.M., Caldwell C.N., 1980, ApJ, 237, 692
- [] Lemson G. & Kauffmann G., 1999, MNRAS, 302, 111
- [] Lewis I, et al., 2002, MNRAS, 334, 673
- [] Loveday J., Peterson B.A., Efstathiou G., Maddox S.J., 1992, A&A, 390, 338
- [] Madgwick D.S. & the 2dFGRS team, 2002, MNRAS, 333, 133
- [] Magliocchetti M. & Porciani C., 2003, MNRAS, 345, 186
- [] Martínez H.J., Zandivarez A., Domínguez M., Merchán M.E., Lambas D.G., 2002, MNRAS, 333, L31
- [] Marzke R.O., da Costa L.N., 1997, AJ, 113, 185
- [] Marzke R.O., da Costa L.N., Pellegrini P.S., Willmer C.N.A., Geller M.J., 1998, ApJ, 503, 617
- [] McKay T.A., et al, ApJ, 2002, 571, L85
- [] Merchán M., Zandivarez A., 2002, MNRAS, 335, 216
- [] Mihos J.C., Hernquist L., 1996, ApJ, 464, 641
- [] Mo H.J., White S.D.M., 1996, MNRAS, 282, 347
- [] Mo H.J., Mao S., White S.D.M., 1998, MNRAS, 295, 319
- [] Mo H.J., Yang X., van den Bosch, F.C., Jing Y.P., 2004, MNRAS, 349, 205
- [] Mo H.J., Yang X., van den Bosch, F.C., Katz N., 2005, preprint (astro-ph/0506516)
- [] Moore B., Katz N., Lake G., Dressler A., Oemler A., 1996, Nature, 379, 613
- [] Moore B., Lake G., Quinn T., Stadel J., 1999, MNRAS, 304, 465
- [] Navarro J.F., Frenk C.S., White S.D.M, 1997, ApJ, 490, 493
- [] Norberg P., et al., 2002, MNRAS, 332, 827
- [] Oemler A., 1974, ApJ, 194, 1
- [] Okamoto T., Nagashima M., 2001, ApJ, 547, 109
- [] Osmond J.P.F., Ponman T. J., 2004, MNRAS, 350, 1511
- [] Poggianti B.M., Smail I., Dressler A., Couch W.J., Barger A.J., Butcher H., Ellis R.S., Oemler A.J., 1999, ApJ, 518, 576
- [] Postman M. Geller M.J., 1984, ApJ, 281, 95
- [] Postman M. et al, 1996, AJ, 111, 615
- [] Prada F., Vivitska M., Klypin A., Holtzman J.A., Schlegel D.J., Grebel E.K., Rix, H.-W., Brinkmann J., McKay T.A., Csabai I., 2003, ApJ, 598, 260
- [] Ramella M., Giuricin G., Mardirossian F., Mezzetti M., 1987, A&A, 188, 1
- [] Ramella M., Geller M.J., Huchra J.P., 1989, ApJ,344, 57
- [] Schlegel D.J., Finkbeiner D.P., Davis M., 1998, ApJ, 500, 525
- [] Shectman S.A., Schechter P.L., Oemler A., Tucker D.L., Kirshner R.P., Lin H., 1996, ApJ, 470, 172
- [] Sheth R.K., Mo H.J., Tormen G., 2001, MNRAS, 323, 1
- [] Spitzer L.Jr., 1958, ApJ, 127, 17
- [] Springel V., White S.D.M., Tormen G., Kauffmann G., 2001, MNRAS, 328, 726
- [] Stoughton C., et al., 2002, AJ, 123, 485
- [] Strateva I., et al., 2001, ApJ, 122, 1861
- [] Tanaka M., Goto T., Okamura S., Shimasaku K., Brinkman J., 2004, AJ, 128, 2677
- [] Tanaka M., Kodama T., Arimoto N., Okamura S., Umetsu K., Shimasaku K., Tanaka I., Yamada T., 2005, MNRAS, 362, 268
- [] Toomre A., Toomre J., 1972, ApJ, 178, 623
- [] Tran K.-V., Simard L., Zabludoff A.I., Mulchaey J.S., 2001, ApJ, 549, 172
- [] Tucker D.L., et al., 2000, ApJS, 130, 237
- [] van den Bosch F.C., Lewis G.F., Lake G., Stadel J., 1999, ApJ, 515, 50
- [] van den Bosch F.C., Yang X., Mo H.J., 2003, MNRAS, 340, 771
- [] van den Bosch F.C., Norberg P., Mo H.J., Yang X.H., 2004, MNRAS, 352, 1302
- [] van den Bosch F.C., Yang X.H., Mo H.J, Norberg P., 2005a, MNRAS, 356, 1233
- [] van den Bosch F.C., Weinmann S.M., Yang X.H., Mo H.J, Li C., Jing Y.P., 2005b, MNRAS, 361, 1203
- [] van den Bosch F.C., Tormen G., Giocoli C., 2005c, MNRAS, 359, 1029
- [] Weiner B.J., et al., 2005, ApJ, 620, 595
- [] White M. & Kochanek C.S., 2002, ApJ, 574, 24
- [] Whitmore B.C., 1995, Groups of Galaixes, ASP Conference Series, Vol. 70, 41
- [] Whitmore B.C., Gilmore D.M., Jones C., 1993, ApJ, 407, 489
- [] Wirth A., 1983, AJ, 274, 541
- [] Yang X., Mo H.J., van den Bosch F.C., 2003, MNRAS, 339, 1057
- [] Yang X., Mo H.J., van den Bosch F.C., Jing Y.P., 2005a, MNRAS, 356, 1293 (YMBJ)
- [] Yang X., Mo H.J., van den Bosch F.C., Jing Y.P., 2005b, MNRAS, 357, 608
- [] Yang X., Mo H.J., Jing Y.P., van den Bosch F.C., 2005c, MNRAS, 358, 217
- [] Yang X, Mo H.J., van den Bosch F.C., Weinmann S.M., Li C., Jing Y.P., 2005d, MNRAS, in press (astro-ph/0504477)
- [] York D.G., et al., 2000, AJ, 120, 1579
- [] Zabludoff A.I., Mulchaey J.S., 1998, ApJ, 496, 39
- [] Zabludoff A.I., Mulchaey J.S., 2000, ApJ, 539, 136
- [] Zehavi I., et al, 2004, submitted to ApJ, astro-ph/0408569
- [] Zheng Z., et al., 2004, preprint (astro-ph/0408564)
- [] Zucca E., et al., 1997, A&A, 326, 477
Appendix A The Group-Finding Algorithm
The group finder, used in Section 3 to construct our SDSS group catalogue uses some virial properties of dark matter haloes. Throughout this paper we define dark matter haloes as virialized structures with a mean over-density of and a NFW (Navarro, Frenk & White 1997) density distribution:
| (11) |
Here is a characteristic radius, is the average density of the Universe, and is a dimensionless amplitude which can be expressed in terms of the halo concentration parameter as
| (12) |
with the radius within which the halo has an average over-density of . We use the relation given by Bullock et al. (2001) to compute as function of halo mass, properly converted to our definition of halo mass.
Our group finder consists of the following steps:
Step 1: We combine two different methods to identify the centers of potential groups. First we use the traditional FOF algorithm to assign galaxies to groups. Since we are working in redshift space, we separately define linking lengths along the line of sight () and in the transverse direction (). Since the purpose here is only to identify the group centers, we use relatively small linking lengths: and , both in units of the mean separation of galaxies. Note that for an apparent magnitude limited survey the mean separation of galaxies is a function of redshift, which we take into account. The geometrical, luminosity weighted, centers of all FOF groups thus identified with two galaxies or more are considered as centers of potential groups. Next, from all galaxies not yet linked together by these FOF groups, we select bright, relatively isolated galaxies which we also associate with the centers of potential groups. Following an approach similar to McKay et al. (2002), Prada et al. (2003) and Brainerd & Specian (2003), we identify a galaxy as ‘central’, and thus as the center of a potential group, when it is the brightest galaxy in a cylinder of radius and a velocity depth of .
Step 2: We estimate the luminosity of a selected potential group using
| (13) |
Here is the -band luminosity of the galaxy in the group and is the SDSS survey-completeness at the corresponding location. The total group luminosity is approximated by
| (14) |
where is the minimum luminosity of a galaxy that can be observed at the redshift of the group, and is the galaxy luminosity function in the -band, which we model using the Schechter function fit of Blanton et al. (2003a).
Step 3: From and a model for the group mass-to-light ratio (see below), we compute an estimate of the halo mass associated with the group in consideration. From this mass estimate we compute the halo radius , the virial radius 666The virial radius is defined as the radius inside of which the average density is times the critical density, with given by Bryan & Norman (1998), and the line-of-sight velocity dispersion . For the latter we use
| (15) |
This fitting function accurately describes the relation between and the mass-weighted one-dimension velocity dispersion (see equation (14) in van den Bosch et al. 2004).
Step 4: Using the sizes, masses, velocity dispersions and centers of the groups thus obtained, we now assign group memberships to all galaxies in the survey. We assume that the phase-space distribution of galaxies follows that of the dark matter particles. In that case the number density contrast of galaxies in redshift space around the group center (which we associate with the center of the dark matter halo) at redshift is given by
| (16) |
Here and is the projected surface density of a (spherical) NFW halo:
| (17) |
with
| (18) |
The function describes the redshift distribution of galaxies within the halo for which we adopt a Gaussian form
| (19) |
where is the rest-frame velocity dispersion.
Thus defined, is the three-dimensional density contrast in redshift space. In order to decide whether a galaxy should be assigned to a particular group we proceed as follows. For each galaxy we loop over all groups, and compute the corresponding distance between galaxy and group center. Here is the projected distance at the redshift of the group. If , with an appropriately chosen background level (see below), the galaxy is assigned to the group. If a galaxy can be assigned to more than one group, it is only assigned to the group for which has the highest value. Finally, if all members of two groups can be assigned to one group according to the above criterion, the two groups are merged into a single group.
Step 5: Using the group members thus selected we recompute the geometrical, luminosity weighted group center and go back to Step 2, iterating until there is no further change in the memberships of groups. Note that, unlike with the traditional FOF method, this group finder also identifies groups with only one member.
The group finding algorithm thus defined requires an assumed , possibly as function of halo mass , and has one free parameter, namely the background level . In this paper we use , which corresponds roughly to the redshift-space density contrast at the edge of a halo (see YMBJ). As shown in YMBJ, the group catalogue is not very sensitive to the exact value of used. For we use the average mass-to-light ratios as function of halo mass obtained by van den Bosch, Yang & Mo (2003; their model D). Since mass-to-light ratio corresponds to the photometric band, we compute in both the and band (-corrected to ), which we convert to the band using (Fukugita et al. 1996; Blair & Gilmore 1982). Detailed tests in YMBJ have shown that the completeness and contamination levels of our group catalogue are extremely insensitive to the exact values of assumed. We have verified that very significant changes in this assumption have no significant effect of any of the results presented in this paper. This is easy to understand; even if our estimate for is wrong by a factor of 3, the implied radius and velocity dispersion, used in the membership determination, are only off by 44 percent.
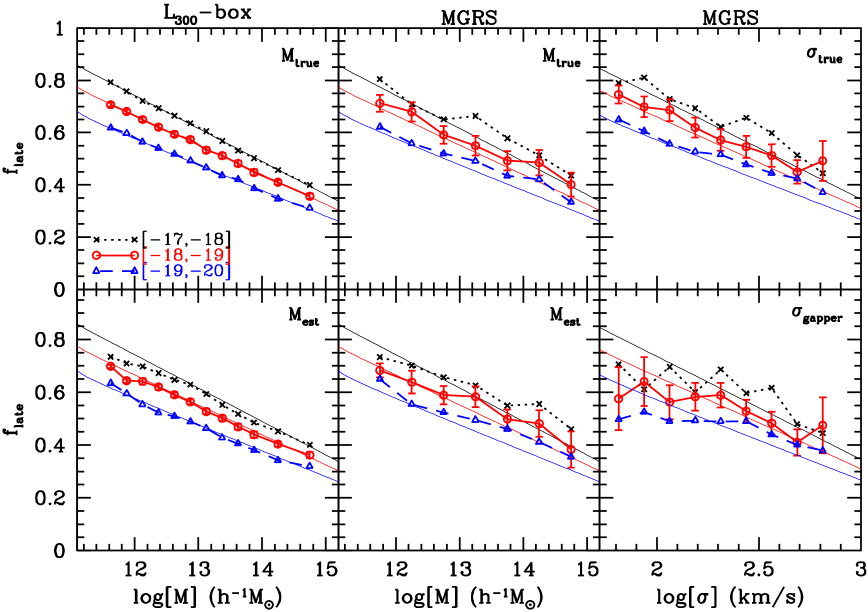
Appendix B Testing the Robustness of our Results with Mock Surveys
In order to address the robustness of our results we construct a mock galaxy redshift survey (hereafter MGRS), which we analyze in exactly the same way as the data described in the previous sections. Even though our data is based on the SDSS, we follow Yang et al. (2005a) and construct a mock version of the 2dFGRS. There are two reasons for this. First of all, we do not yet have accurate models for the conditional luminosity function of SDSS galaxies, which is required for the construction of reliable MGRSs (see below). Secondly, our mock versions of the 2dFGRS have been well tested and are accurate representations of the actual 2dFGRS (see Yang et al. 2005a; van den Bosch et al. 2005a,b). Since the main purpose of this exercise is to test the methodologies used in this paper, the use of a mock 2dFGRS rather than a mock SDSS should not make a significant difference. If anything, since the SDSS sample used here is somewhat larger than the 2dFGRS, and since the redshift errors are substantially smaller, our results regarding the reliability and robustness of the analysis should be considered conservative.
The MGRS is constructed by populating dark matter haloes with galaxies of different luminosities. The distribution of dark matter haloes is obtained from a set of large -body simulations (dark matter only) for a CDM ‘concordance’ cosmology with , , and . In this paper we use two simulations with particles each, which are described in more detail in Jing & Suto (2002). The simulations have periodic boundary conditions and box sizes of (hereafter ) and (hereafter ). Dark matter haloes are identified using the standard FOF algorithm with a linking length of times the mean inter-particle separation.
To populate these dark matter haloes with galaxies of different luminosities and different types, we use the conditional luminosity function (hereafter CLF), , which gives the average number of galaxies of luminosity that resides in a halo of mass (Yang, Mo & van den Bosch 2003). The sample of galaxies is split in ‘early types’ and ‘late types’ using a probability function (see van den Bosch, Yang & Mo 2003). Details of these models are not important for what follows, but we do point out that these models accurately fit the luminosity functions (Madgwick et al. 2002) and the correlation lengths as function of luminosity (Norberg et al. 2002) for both galaxy types.
Having populated the various simulation boxes with galaxies we first proceed as follows. In each halo we count the number of early and late type galaxies in a given magnitude range, and compute the average late type fraction as function of halo mass. The results for the box are shown, for three different magnitude ranges as indicated, in the upper left-hand panel of Fig. 15 (symbols connected by thick lines). The thin, lines are the theoretical predictions corresponding to the input CLF, given by
| (20) |
Here and are the luminosities that correspond to the magnitude limits. Not surprisingly, the late type fractions derived are in excellent agreement with these input values; this figure is just to illustrate that the box contains a sufficient number of haloes so that the Poisson errors are negligibly small.
The lower left-hand panel shows the results obtained when using the estimated halo mass, rather than the true halo mass. Halo masses are estimated using a similar procedure as described in Section 3.2: for each halo we determine , the total luminosity of all halo galaxies with , and we compute the number density, , of haloes with larger than that of the halo considered. Using the halo mass function of Sheth, Mo & Tormen (2001), we determine the corresponding halo mass by finding the mass for which the number density of more massive haloes is equal to . As discussed in Section 3.2 this method thus assigns masses based on the rank order of the haloes. As is evident from the lower left-hand panel of Fig. 15, this method of assigning halo masses results in small, systematic errors in the derived late type fractions for haloes with , in the sense that the luminosity-dependence is underestimated. This owes to the fact that the luminosities themselves are used to estimate the halo masses. For more massive haloes, however, the resulting is virtually indistinguishable from the true relation. This demonstrates that our method of assigning halo masses does not introduce any systematic errors in the mass and/or luminosity dependence of the galaxy types for haloes with . We emphasize that the relation between and in the MGRS has a realistic amount of scatter.
The above test, however, is idealized. In reality we have to select haloes using a group finder applied to a redshift survey. Since the survey suffers from observational biases and peculiar velocity distortions, and since the group finder unavoidably suffers from interlopers and incompleteness effects, a more realistic check of our methodology requires a comparison with a proper MGRS. Using the and simulation boxes described above we create a large virtual universe. We follow Yang et al. (2005a) and replicate the box on a grid. The central boxes, are replaced by a stack of boxes, and the virtual observer is placed at the center (see Fig. 11 in Yang et al. 2005a). This stacking geometry circumvents incompleteness problems in the mock survey due to insufficient mass resolution of the simulations, and allows us to reach the desired depth of in all directions. Next we construct a mock 2dFGRS using the following steps (see van den Bosch et al. 2005a for details):
-
1.
We define a -coordinate frame with respect to the virtual observer at the center of the stack of simulation boxes, and remove all galaxies that are not located in the areas equivalent to those of the 2dFGRS.
-
2.
For each galaxy we compute the apparent magnitude according to its luminosity and distance, to which we add a rms error of 0.15 mag.
-
3.
For each galaxy we compute the redshift as ‘seen’ by the virtual observer. We take the observational velocity uncertainties into account by adding a random velocity drawn from a Gaussian distribution with dispersion .
-
4.
To take account of the position- and magnitude-dependent completeness of the 2dFGRS, we randomly sample each galaxy using the completeness masks provided by the 2dFGRS team.
-
5.
We also take account of the fiber-collision induced incompleteness as well as the incompleteness due to image blending.
As shown in Yang et al. (2005a) and van den Bosch et al. (2005a), this procedure results in a mock 2dFGRS that accurately mimics all the various incompleteness effects, allowing for a direct, one-to-one comparison with the true 2dFGRS.
Next we apply the YMBJ halo-based group finder to this MGRS, and compute the late type fraction as function of halo mass using both the true halo masses (defined as the true halo mass associated with the brightest group member) and the estimated halo masses (using the ranking method described above). The results are shown in the panels in the middle column of Fig. 15. Since there are much fewer galaxies/haloes involved than in the case shown in the left-hand panels, and since the group-finder is not perfect, the results are significantly more noisy. Nevertheless, when using the true halo masses, the resulting late type fractions are in good agreement with the input values (eq. [20]), except for a small, systematic overestimate at the massive end due to interlopers and incompleteness effects. When the estimated halo masses are used instead, one again notices a small but systematic underestimate of the luminosity dependence of for haloes with . For more massive haloes, the results are very comparable to those based on the true halo masses. This indicates that our group finder allows for a fairly accurate determination of . In particular, the method accurately recovers the luminosity dependence. (at least for ). Recall that since the SDSS sample used in this paper is larger than the 2dFGRS, and since the redshift errors in the SDSS are significantly smaller than in the 2dFGRS (resulting in smaller interloper fractions), we may actually expect the SDSS results presented in the previous section to be more robust than the MGRS results shown here.
Finally, the panels on the right-hand side show the late type fractions obtained from the MGRS as function of velocity dispersion. In the upper right-hand panel we plot the fractions as function of the true velocity dispersion, which is the one-dimensional velocity dispersion of the dark matter particles corresponding to the halo that hosts the brightest group galaxy. As expected, these results look very similar to those in the upper panel in the middle column. In the lower right-hand panel, however, we plot as function of the velocity dispersion of the group members, measured using the gapper estimator, which is insensitive to outliers (Beers, Flynn & Gebhardt 1990; see YMBJ for our implementation). Only groups with at least three members are taken into account. This time, the dependence of on the halo velocity dispersion is much flatter than for the input model. Especially for haloes with (corresponding to ), the late type fractions are significantly underestimated. This demonstrates that our mass estimates based on the -group ranking are more reliable than those based on the velocity dispersion, especially for low mass haloes.