11email: m.branchesi@ira.inaf.it 22institutetext: Istituto di Radioastronomia, INAF-CNR, Via Gobetti 101, 40129 Bologna, Italy
22email: gioia@ira.inaf.it 33institutetext: Dipartimento di Fisica, Università di Bologna, Via Irnerio 46, 40126 Bologna, Italy
33email: rfanti@ira.inaf.it, cfanti@ira.inaf.it 44institutetext: National Radio Astronomy Observatory, P.O. Box O, Socorro, NM 87801, USA
44email: rperley@nrao.edu
The Radio Luminosity Function of the NEP Distant Cluster Radio Galaxies
A complete sample of 18 X-ray selected clusters of galaxies belonging to the ROSAT North Ecliptic Pole (NEP) survey has been observed with the Very Large Array at 1.4 GHz. These are the most distant clusters in the X-ray survey with redshift in the range 0.3 z 0.8. Seventy-nine radio sources are detected within half an Abell radius with an observed peak brightness 0.17 mJy beam-1, except for three sources, belonging to the same cluster, which have a higher peak brightness limit of 0.26 mJy beam-1. The NEP field source counts are in good agreement with the source counts of a comparison survey, the VLA-VIRMOS deep field survey, indicating that the NEP sample is statistically complete. Thirty-two out of the 79 sources are within 0.2 Abell radii, twenty-two of them are considered cluster members based on spectroscopic redshifts or their optical magnitude and morphological classification. The cluster radio galaxies are used to construct the Radio Luminosity Function (RLF) of distant X-ray selected clusters. A comparison with two nearby cluster RLFs shows that the NEP RLF lies above the local ones, has a steeper slope at low radio powers ( 1024 W Hz-1) and shows no evidence for a break at 1024 W Hz-1 which is observed in the nearby cluster RLFs. We discuss briefly the origin and possible explanations of the differences observed in the radio properties of nearby and distant clusters of galaxies. The main result of this study is that the RLF of the distant X-ray clusters is very different from that of the local rich Abell clusters.
Key Words.:
Galaxies: clusters: general – high-redshift – evolution; Radio continuum: general – galaxies; Cosmology: observations1 Introduction
One of the most fascinating topics in cluster astrophysics is the study of the effects produced by cluster formation on the properties of the radio sources embedded in the Intra Cluster Medium (ICM) and on the evolution of the cluster radio galaxies. Since the pioneering work of Hill & Lilly (1991) (see also Ellingson et al., 1991), who showed that powerful classical radio sources at high redshift (z 0.5) preferentially inhabit rich environments, several other authors have investigated the link between cluster environment and radio source morphology, or between cluster formation and radio galaxy triggering, or cluster mergers and star formation triggering (see among others: Odea & Owen, 1985; Best et al., 2002; Simpson & Rawlings, 2002; Owen et al., 1999, 2005). Extremely distant cluster environments, or proto-clusters, have been found by targeting objects near powerful radio sources (Crawford & Fabian, 1996; Pentericci et al., 1997; Pentericci, 1999) with a redshift up to z 4 (Venemans et al., 2002). Other lines of investigation, dating back to the 1970s (Owen & Rudnick, 1976; Burns et al., 1979) involve the morphology and radio power of nearby cluster radio sources (Owen & Laing, 1989; Owen & White, 1991).
A different approach from those studies which try to understand the environment effects by studying individual sources (i.e. Pentericci et al., 1999; Venemans et al., 2002) or individual clusters (i.e. Owen et al., 1999, 2005), would be to start from a well defined sample of clusters of galaxies and to obtain moderately deep radio observations to investigate the properties of radio sources in clusters and their evolution. Exhaustive and in depth studies of optical/radio properties of radio galaxies in nearby (z 0.25) Abell clusters have appeared in the literature (over 500 Abell clusters studied with the VLA by Owen, Ledlow & collaborators; see Owen & Ledlow, 1997, and references therein). For more recent work on the subject see Morrison & Owen (2003). An equivalent study for distant clusters (i.e. up to z0.7–0.8) is still missing even if radio surveys of a small number of high-z, rich, X-ray selected clusters have been conducted (e.g. Stocke et al., 1999; Perlman et al., 2003) mainly with the goal of investigating the evolution of the cluster radio galaxy population. According to these authors an apparent dearth of radio sources below log P (W Hz-1) 24.5 is due to incompleteness rather than to a weak negative evolution. New, deeper radio observations would discriminate on the reality of this possible evolution in the cluster radio population. Also, better optical identifications of radio sources with cluster members would help in addressing the issue of evolution.
We present in this paper the results from a VLA survey which uses a new sample of X-ray selected, distant clusters of galaxies extracted from the ROSAT North Ecliptic Pole (NEP) survey (Gioia et al., 2003). The goals are to provide an additional sample of distant objects observed in radio to be compared with the detailed studies of radio galaxies in nearby clusters, and to relate the radio properties of the cluster galaxies with the X-ray and optical properties of the clusters. Searching for differences in the radio luminosity function between local and distant galaxy clusters will provide a valuable perspective on the evolution of radio galaxies, and on the influence of the environment on radio galaxy populations.
Throughout the paper we assume H 75 km s-1 Mpc-1 and q 0.1. Even though we are aware that this is not the currently-favored cosmological concordance model, the cosmology we adopted allows us to make a direct comparison to previous work in the field. As explained in Section 8, the results obtained here would be strengthened if one adopts the concordance cosmology.
2 The X-ray Selected Cluster Sample
A complete sample of 18 X-ray selected galaxy clusters was extracted from the ROSAT NEP survey catalogue (Gioia et al., 2003) for observations with the VLA at 1.4 GHz. The sample contains the most distant clusters in the survey with redshifts in the range 0.3z0.8. The NEP survey (Mullis, 2001; Henry et al., 2001; Voges et al., 2001) covers a 87.4 deg2 contiguous region of the ROSAT All-Sky Survey (RASS) (Voges et al., 1999), at a moderate Galactic latitude of , around the North Ecliptic Pole (, +). The region around the NEP possesses the deepest exposure and consequently the greatest sensitivity of the entire RASS. Hence, the 9∘ 9∘survey region covers the deepest, wide-angle contiguous region ever observed in X-rays. This unique combination of depth plus wide, contiguous solid angle provides the capabilities of detecting both high-redshift objects and large scale structure. The survey catalogue contains 445 X-ray sources above a flux of 2 ergs cm-2 s-1 in the 0.5–2.0 KeV energy band. A comprehensive program of optical follow-up observations to determine the nature of each of the X-ray sources in the NEP sample led to the identification of 63 clusters of galaxies. The identification of a X-ray source as a cluster of galaxies usually requires the absence of emission lines, the absence of a non-thermal continuum, which identifies a BL Lac object, coupled with a centrally concentrated galaxy overdensity either from the POSS or from deep optical CCD images taken for more distant clusters, and at least two concordant galaxy redshifts. The optical identification spectroscopy was done using the University of Hawai′i (UH) 2.2m Wide-Field Grism Spectrograph (WFGS), the Multi-Object-Spectrograph (MOS) on the Canada-France-Hawai′i 3.6m telescope, and the Low-Resolution Imaging Spectrograph (LRIS) on Keck. A detailed description of the X-ray sources and their optical identifications can be found in Mullis (2001) and Gioia et al. (2003). The 18 X-ray selected clusters and their basic parameters are listed in Table LABEL:tab1. The columns contain the following information:
-
•
Column 1: Source name formed by the acronym RX J (ROSAT X-ray source, Julian 2000 position), and the X-ray centroid position
-
•
Column 2: Internal NEP source identification number
-
•
Column 3-4: Right ascension and declination of the optical Brightest Cluster Galaxy (BCG) from the DSS II (J2000, HH MM SS.S, DD MM SS)
-
•
Column 5: Total unabsorbed flux in the 0.5-2.0 KeV band in units of erg cm-2 s-1
-
•
Column 6: Spectroscopic redshift
-
•
Column 7: Abell radius (R 2 Mpc) in arcmin
-
•
Column 8: Rest frame K-corrected X-ray luminosity in the 0.5-2.0 KeV band in units of erg s-1
-
•
Column 9: Apparent red magnitude of the BCG from the SuperCosmos POSS II (except for three cases indicated by an asterisk: for RXJ 1753.36631 and RXJ 1821.66827 no magnitudes are available while for RX J1751.57013 only the POSS I magnitude is available).
3 Radio Observations and Data Reduction
Observations of the 18 X-ray clusters were carried out at 1.4 GHz, with two 50 MHz IF pairs, on 2003, November 30 and December 7, using the Very Large Array (VLA) in B-configuration for a total integration time of 20 hours. The B configuration was optimal to map extended areas with an acceptable nominal resolution of 3.9in both coordinates down to a faint brightness limit ( 0.17 mJy beam-1, see below). The 18 galaxy clusters were observed in continuum mode, using the full available bandwidth per IF. For each cluster one hour integration, divided into three ”snapshot” scans, was obtained by pointing the array at the position of the brightest central galaxy, or BCG, listed in Table LABEL:tab1. A typical plot of the coverage is shown in Fig. 1.
| Cluster Name | NEP | RA | DEC | z | RA | LX | BCG | ||
|---|---|---|---|---|---|---|---|---|---|
| Id # | J2000 | J2000 | 10 | ′ | 10 | mR | |||
| RX J1753.36631 | 200 | 17 57 19.4 | 66 31 31 | 3.87 | 0.691 | 5.51 | 0.50 | —– * | |
| RX J1758.96520 | 310 | 17 58 56.5 | 65 21 05 | 4.53 | 0.365 | 7.58 | 0.14 | 20.1 | |
| RX J1727.47035 | 1730 | 17 27 33.6 | 70 35 47 | 50.20 | 0.306 | 8.46 | 1.02 | 18.4 | |
| RX J1728.67041 | 1780 | 17 28 38.2 | 70 41 03 | 28.26 | 0.551 | 6.08 | 2.01 | 19.9 | |
| RX J1743.46341 | 2420 | 17 43 30.4 | 63 41 41 | 50.49 | 0.327 | 8.11 | 1.18 | 17.7 | |
| RX J1745.26556 | 2560 | 17 45 18.2 | 65 55 42 | 7.09 | 0.608 | 5.81 | 0.67 | 19.7 | |
| RX J1746.76639 | 2770 | 17 46 46.8 | 66 39 04 | 8.81 | 0.386 | 7.33 | 0.31 | 18.5 | |
| RX J1747.56343 | 2870 | 17 47 31.1 | 63 45 23 | 15.71 | 0.328 | 8.09 | 0.38 | 18.3 | |
| RX J1748.67020 | 2950 | 17 48 39.1 | 70 20 42 | 13.84 | 0.345 | 7.84 | 0.38 | 18.6 | |
| RX J1749.07014 | 2980 | 17 49 04.5 | 70 14 45 | 23.79 | 0.579 | 5.94 | 1.90 | 18.0 | |
| RX J1751.57013 | 3130 | 17 51 32.6 | 70 13 22 | 13.10 | 0.493 | 6.42 | 0.76 | 19.8* | |
| RX J1752.26522 | 3200 | 17 52 08.2 | 65 22 53 | 6.44 | 0.392 | 7.27 | 0.24 | 17.2 | |
| RX J1754.56904 | 3320 | 17 54 34.2 | 69 05 07 | 7.39 | 0.511 | 6.30 | 0.48 | 19.7 | |
| RX J1755.96314 | 3450 | 17 55 57.8 | 63 14 09 | 17.92 | 0.385 | 7.34 | 0.61 | 18.5 | |
| RX J1806.16813 | 4150 | 18 06 04.8 | 68 13 16 | 19.91 | 0.303 | 8.51 | 0.41 | 19.0 | |
| RX J1811.36447 | 4560 | 18 11 19.3 | 64 47 23 | 13.53 | 0.451 | 6.72 | 0.65 | 20.1 | |
| RX J1812.16447 | 4610 | 18 12 08.2 | 63 53 32 | 17.25 | 0.541 | 6.13 | 1.20 | 20.4 | |
| RX J1821.66827 | 5281 | 18 21 32.9 | 68 27 55 | 10.22 | 0.811 | 5.20 | 1.76 | —– * |
Our primary flux density calibrator was 3C286, whose flux density at 1.4 GHz was 14.9 Jy. The phase calibrators were 1748700, 1634627, 1849670, which were given 2 minutes integration time at approximately 40 minute intervals to monitor instrumental and atmospheric phase and gain variations. The data were reduced using the NRAO AIPS (Astronomical Image Processing System) package, following the standard procedure: calibration, Fourier inversion with a uniform uv-weight, clean and restore. For each pointing an area of 1024 1024 pixels centered on the optical BCG was imaged. Given the size of each pixel (1 pixel 1.5′′) each image measures 25.6 25.6 arcmin.
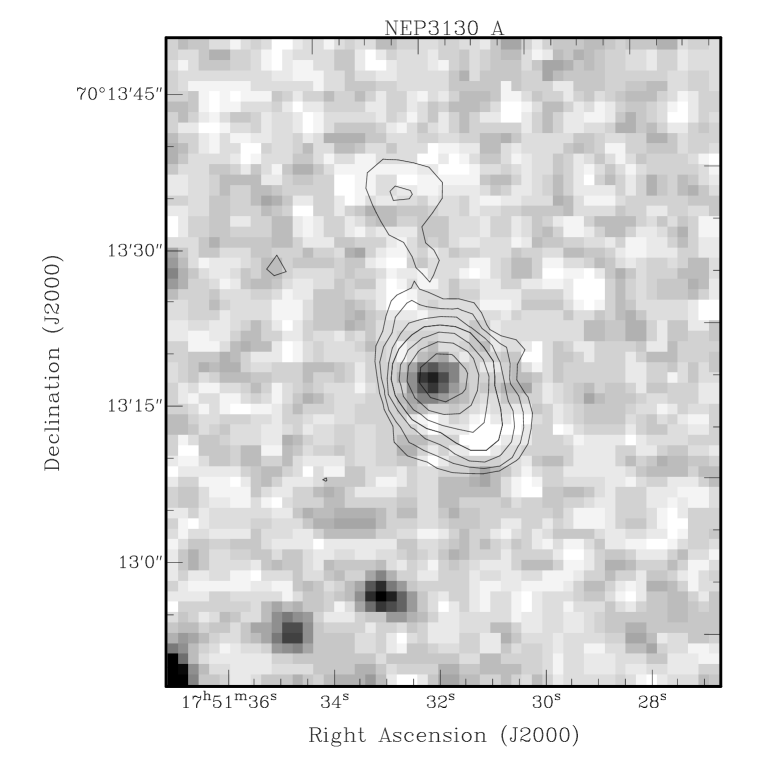
Strong radio sources far away from the field center, but within the primary field of view, have sidelobes that might contaminate the inner portion of the field. To keep under control the confusion effects from these sources a multi-field reduction was applied. The NVSS (NRAO VLA Sky Survey, Condon et al. 1998) catalogue was used to select all the sources with an attenuated peak brightness higher than 5 mJy beam-1 within a radius of 30 arcmin from each pointing and not included in the 1024 1024 pixel region (even though 2048 2048 pixel dirty images were created to check that no additional confusing sources, other than the NVSS sources, were present). For each field an AIPS “RUN file” was produced to define extra fields (64 64 pixels in size) containing these confusing sources. Several iterations of self calibration and imaging were simultaneously applied to the main field and to these additional satellite fields. At the beginning of each iteration the cleaning procedure was guided by setting boxes around the stronger sources of the central field and adding progressively other boxes around the fainter sources which were becoming visible. At the end a general cleaning was applied. The adopted clean gain was 0.05. The clean was generally halted when the residuals reached a flux density comparable to three times the nominal noise level. The typical number of independent components searched in the main field was about ten thousand. The a–priori calibration uncertainties are for flux densities and for diameters. The noise in the final maps is in the range 0.026–0.034 mJy beam-1 (see Table LABEL:tab2, column 2). Exceptions are RX J1751.57013 (NEP 3130) and RX J1751.57014 (NEP 2980) where the presence of very strong confusing sources, far from the field center, degraded the quality of the maps. The high level of the noise (1 mJy beam-1 ) in the RX J1751.57014 field prevented detection of any source. For this reason NEP 2980 is not listed in Table LABEL:tab2 and is not used in any subsequent analysis.
Radio sources with peak brightness 0.17 mJy beam-1 have been systematically searched over the whole area within half an Abell radius (0.5 RA), namely within 1 Mpc in the cosmology adopted here, in all clusters except for NEP 3130. A peak brightness of 0.17 mJy beam-1 corresponds to five times the highest of all maps (except for the two higher noise maps). The limiting brightness of 0.17 mJy beam-1 corresponds to a limit in the radio power of P W Hz-1 for the nearest cluster (z0.303) and of P W Hz-1 for the most distant one (z0.811). Since one half Abell radius corresponds to arcmin for the closest clusters (or less for the more distant ones) the corrections to the flux densities for the primary beam attenuation are negligible. A more serious effect is produced by the bandwidth smearing which depresses the peak brightness of the sources (thus lowering the sensitivity at the map periphery) and radially distorts them as a function of the distance from the field center (see Appendix, Section A.1). The peak response of a point source declines while the total flux density is conserved. All peak brightnesses are corrected for this effect (see Appendix, Section A.2).
4 The Sample of Radio Sources
The final radio source sample contains 79 sources within half an Abell radius with an observed peak brightness S 0.17 mJy beam-1 except for the three sources in NEP 3130, which have a peak brightness S 0.26 mJy beam-1. A more detailed description of the data analysis is given in the Appendix. Here we mention that the source parameters listed below were obtained by a Gaussian fit, when acceptable, using the AIPS task JMFIT. The parameters are: position, maximum and minimum angular size, both observed () and deconvolved () for the map beam, peak brightness (SP) and total flux density (ST) of the sources. Following Condon et al. (1998) we considered as resolved in each direction those sources for which the fitted sizes, , exceed the beam Full Width Half Maximum (FWHM) by more than 2.33 times the estimated errors. Since the probability that this is due to statistical errors is 2%, only 1 source would be mistakenly classified as slightly resolved instead of point–like. Since images appear convolved with a position–dependent, radially elongated beam due to smearing, we adopted the FWHM of the synthesized beam, , for the minor axis and the smeared FWHM (see eq. 1) for the major axis, taking into account also the direction of the elongation.
When the source structure was too extended to be reliably fitted by a multi-gaussian model, the peak and total flux densities were computed using the AIPS task TVSTAT, which allows integration of the image brightness values over irregular areas. Sizes were derived from the lowest reliable contour in the image map. Both peak brightness and total flux density are optimized by accounting for noise and algorithm effects on the direct parameter determinations (see Appendix, Section A.2). Parameter errors are derived as in Appendix (Section A.3).
4.1 The Radio Source Catalogue
The 79 radio sources detected within half an Abell radius and their properties are listed in Table LABEL:tab2. The columns contain the following information:
-
•
Column 1: Cluster name
-
•
Column 2: Average image noise within half an Abell radius in mJy beam-1
-
•
Column 3: Source identification letter
-
•
Column 4-5: Source radio position - Right Ascension and Declination (J2000). For sources with a multiple structure the coordinates refer to the radio centroid while for all the others, including complex morphology sources, the coordinates refer to the position of the radio peak. Exception is source NEP 2420 D where the radio position refers to the midpoint between the two brightest peaks
-
•
Column 6: Distance from the cluster center in units of Abell radius defined as R/RA
-
•
Column 7-8: Bandwidth smearing corrected peak brightness and integrated flux density with respective errors according to the Appendix. For sources too extended for a multi–gaussian fit the integrated flux density comes from the AIPS task TVSTAT
-
•
Column 9-10: Beam deconvolved angular sizes for resolved sources in arcsec. For multi-component sources the source total size is listed. For clearly extended sources the size was measured directly on the radio images from the lowest reliable contour. Details on the source structure are given in Section 6.1
-
•
Column 11: Source major axis position angle, in degrees, measured fromNorth through East
-
•
Column 12: Notes relative to the radio morphology based on the criteria given at the beginning of Section 4. For sources reliably fitted by a Gaussian model the following letters are used: unresolved, partially resolved, resolved (see A.2). Multi–component sources or sources too extended for a Gaussian fit are indicated by .

4.2 Optical counterparts
Radio source positions were cross-correlated with the SuperCOSMOS/POSS II (Second Palomar Sky Survey) catalogue within a search box of 10′′. When more than one optical object was present within the search area the one closest to the radio position was considered as the most probable counterpart. All radio source contours were then overplotted on the optical red Digitized Sky Survey DSS II images and visually inspected. Typical limiting magnitudes reached by the POSS II are B22.5 and R20.8 (Reid et al., 1991). When no optical counterpart was present on the POSS II additional optical information was considered if available.
The SuperCOSMOS catalogue has a claimed positional accuracy of 0.2at B19 and R18, rising to 0.3at B22 and R21. Radio positional errors in right ascension and declination have been estimated according to Condon et al. (1998). The positional uncertainty derived for the faintest point-like sources (S 0.17 mJy beam-1) is approximately 0.3in each coordinate. Therefore the combined positional error is estimated to be . An optical object is considered the counterpart of an unresolved radio source if the radio to optical distance is less then , i.e. 2.1′′. The distribution of the radio-optical positional offsets is given Fig. 2. Shaded areas indicate extended sources (i.e. , , and in Tab. LABEL:tab2). The curve overimposed to the observed distribution in Fig. 2 indicates the expected distribution, represented by a Rayleigh law (see e.g. de Ruiter et al., 1977), with a of the optical to radio distance equal to 0.6′′. The expected distribution accounts very well for the observed one within . Larger radio–optical offsets either correspond to extended sources or presumably to incorrect identifications. There are only 6 extended sources in Fig. 2 with an offset larger than 2.1′′. Four of them were used in the radio luminosity function (RLF) derivation, namely NEP 2870 B with an offset of 2.6′′, NEP 2870 A at an offset of 2.7′′, NEP 2770 A with an offset of 3.5′′ and NEP 2420 D with an offset of 6.5′′ (see Notes on Individual Sources for NEP 2420 D, Section 6.1). A careful examination of the available data makes us confident that the four radio sources have been correctly identified. The remaining two sources (NEP 2950 C with an offset of 4.9′′ and NEP 2420 F with an offset of 6.1′′) could be less secure identifications. However they are not used in the evaluation of the radio luminosity function since they are at a distance R/RA (where RA is the Abell radius) larger than 0.2 from the cluster center. Forty of the radio sources of Fig. 2 have an optical counterpart on the POSS II, 32 of which within a radius of 1.5′′. Three additional sources (NEP 5281 A, B and C) were identified on a I-band image taken at the UH 2.2m telescope by Gioia et al. (2004), who measured the redshifts listed in Table LABEL:tab3. For a fourth source, NEP 3130, we used the APM/POSS I catalogue since the source is close to a very bright star which is less dominant than in the POSS II plates. The optical counterparts of these last four objects are all within 1.5of the radio position. In total 44 radio sources have a possible optical counterpart.
Ten of the proposed optical counterparts are classified as star-like objects in the red plates of the SuperCOSMOS/POS II catalogue, all the others are classified as galaxies. For 15 sources a spectroscopic redshift is available (Gioia et al., 2003). Fourteen of them are cluster members, two of the 14 are classified as star-like in the SuperCOSMOSS/POSS II catalogue. The 44 optical counterparts are listed in Table LABEL:tab3. The columns contain the following information:
-
•
Column 1: Cluster name
-
•
Column 2: Source identification letter
-
•
Column 3-4: Coordinates of the optical counterpart (J2000), from the on-line SuperCOSMOS/POSS II red catalogue. The APM/POSS I catalogue was used for NEP 3130. Exceptions are the coordinates for sources A, B and C in NEP 5281, which were derived from the I-band image taken at the UH 2.2m telescope
-
•
Column 5-6: Offset between the optical and the radio coordinates ( RA and DEC in arcsec)
-
•
Column 7-8: POSS apparent red (R) and blue (BJ) magnitudes
-
•
Column 9: Optical classification according to SuperCosmos/POSS II (APM/POSS I catalogue for NEP 3130): G = galaxy, S = star-like
-
•
Column 10: Spectroscopically measured redshift. Typical uncertainty is 0.001. The asterisk after the redshift denotes that the radio source is a cluster member.
5 Field Contamination and Cluster Membership
Since spectroscopic redshifts for the optical counterparts are available for only 15 NEP radio sources (14 of which are cluster members belonging to 11 different clusters) we have to evaluate the contamination of field sources in order to correctly derive the RLF. As described below two methods were used, namely a statistical estimate of field sources and a best-guess allocation of cluster members on the basis of their absolute magnitude and optical classification.
5.1 Field Radio Source Counts
To correctly determine, in a statistical sense, how many radio sources are field objects and how many radio sources are cluster members we need to have a knowledge of the background source density as a function of flux density. For this purpose we used the VLA-VIRMOS deep field survey source counts (Bondi et al., 2003) which have good statistics at our frequency and flux density levels. At the same time we performed an analysis of our data in order to check their consistency with the literature data. The comparison was also aimed at verifying our completeness level down to the limiting flux density.
We used the complete subsample of 16 clusters with the observed brightness limit of 0.17 mJy beam-1 and proceeded as follows. The radial distribution of the source density at various projected angular distances from the cluster center was obtained by counting objects within concentric, 30wide circular annuli centered on the cluster itself, and up to a distance of 4.5′ from the clusters center. The search radius of 0.5 RA does not extend up to 4.5′ for all clusters. Thus the more external annuli are not covered by every cluster. Therefore the number of sources found in each annulus was normalized by the area actually examined. The resulting radial distribution of the source density, in the top panel of Fig. 3, shows a very high concentration in proximity of the cluster center. The data presented in the panel have a bandwidth smearing-dependent sensitivity limit folded in. The true flux density limit in each annulus decreases as a function of the radial distance according to the curve shown in Fig. 14 in the Appendix. Therefore the distribution in Fig. 3 (top panel) converts directly into the integral surface density of sources stronger than the flux density limit at the middle point of each radial interval shown in the lower panel. Here the bandwidth smearing is accounted for by considering the varying flux density limit of each annulus. It has to be noted that although these are integral source counts all points are independent of each other as they refer to different sky areas. Essentially it is like having many integral log N(S)-Log S down to different flux density limits in independent regions of sky. We believe that this is a good way to show the background counts in our data, and compare them with literature data.
Similarly to the radio source density of the top panel, the first two points of the NEP log N(S)-Log S in the lower panel shows an overdensity of radio sources due to the presence of the cluster and a flattening as one moves to higher flux densities, representative of the field sources. The solid line in the bottom panel represents the power law fit of the integral logN(S)-LogS of the VLA-VIRMOS deep field survey (Bondi et al., 2003). Within the errors, the slope of the integral VIRMOS counts (-1.28) and its normalization are a good representation of the radio counts of the NEP field sources indicating that the NEP sample is statistically complete.
We then proceeded to evaluate the contamination due to non-cluster sources in the following way. For each cluster (including NEP 3130) five radial intervals in R/RA, in steps of 0.1 were defined. Using the background source density we computed for each cluster the expected number of sources in each annulus above the flux density limit corresponding to the mean radius of that annulus. The number of non cluster sources in the various bins can be obtained by summing in each annulus the expected numbers from the 17 clusters. The results are an estimate of 10 non-cluster sources for 0.2, and 45 non-cluster sources for 0.2 0.5, to be compared with the numbers actually found of 32 and 47, respectively. Consequently all the sources at 0.2 are essentially non-cluster sources. In order to stress that the source excess is in the inner radii we plot in Fig. 4 the number of NEP radio sources per Mpc2 in bins of R/RA (the solid triangles) and the expected field contaminations (the open triangles). An examination of the plot shows that the source excess lies in the first two bins. For this reason we will limit our analysis only to sources within 0.2.


5.2 Optical Magnitude Criterion
In order to be conservative on the estimate of cluster membership we adopt a stringent optical criterion to discriminate between cluster members and field sources based on the cluster galaxy absolute magnitude and their optical classification. Assuming that each radio source is at the redshift of the associated cluster, the absolute red magnitude of each object, , has been calculated from its apparent magnitude with the K-correction applied as in Fukugita et al. (1995). The magnitude limit of the POSS II, or POSS I surveys has been assigned as upper limit to those radio sources with no optical counterpart, except for the radio source NEP 3130 C which is obscured by a bright star in both surveys.
Figure 5 (top) shows the red band apparent magnitude of the sample radio sources as a function of redshift. Solid lines indicate constant absolute magnitudes. Filled circles refer to sources with a spectroscopically measured redshift. The filled triangles (some are overplotted) indicate cluster sources with redshift but with no optical counterpart on the POSS. The filled square represents a galaxy towards the cluster NEP 4560 (z0.451) which has a measured spectroscopic redshift of 0.174, but is plotted here as though it were at the redshift of the cluster. Open circles indicate radio sources with an optical counterpart in the POSS II or POSS I survey, open triangles (some are overplotted) indicate lower limits to the magnitude. Bottom panel is the same as top panel but with only the sources within R/R 0.2. Analysis of this plot suggests that all bona-fide cluster members lie in the range 21. The only non-cluster member with a measured redshift (the filled square) lies outside this range. The bottom panel plot is a convenient tool to estimate from the apparent magnitude which of the radio sources without redshift could fall in the 21 range and thus be considered cluster members. It is also clear from the figure that there are more contaminations at low z, as expected, since the area occupied by the low-z clusters is larger.

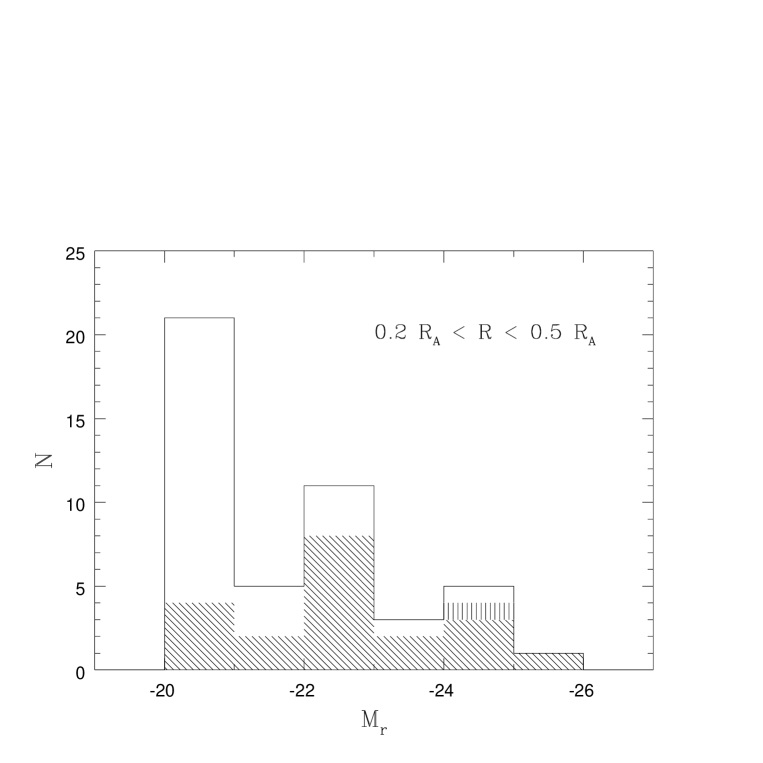
The histograms in Fig. 6 show the distribution of the absolute magnitude for all the radio sources with R/R (top histogram) and R/R (bottom histogram). Histograms highlighted by diagonal lines in both panels indicate radio sources with an optical counterpart in the POSS II-red or in the POSS I-red plates. Areas highlighted by vertical lines indicate all the bona-fide cluster members with a spectroscopic redshift. The three objects at with vertical lines are members of the z 0.81 cluster NEP 5281 and do not have a POSS II counterpart but are visible in the ESO DSS II infrared images and on the I-band UH 2.2m telescope image. Thus only lower limits to the red and blue magnitudes are available. The object in the top panel at , indicated by the filled square in Figure 5, is the foreground galaxy at z0.174. The top panel clearly shows that the thirteen bona-fide cluster members (vertical lines) are in the range . According to previous results (e.g. Ledlow & Owen, 1996) it is likely that the remaining genuine cluster sources are in this same magnitude range and that objects with are mostly background objects. Finally, three sources within satisfying the optical magnitude criterion are classified as star-like objects and are possible non-cluster galaxies. However, we cannot exclude that they are genuine cluster members or background quasars. It follows that up to 10 sources within 0.2 are not cluster members. This estimate is consistent with the estimate of 10 obtained in Section 5.1. On the other hand, the bottom histogram of Fig. 6 (), when allowance is made for the upper limits, does not show any preferred magnitude, therefore the majority of these sources are most probably non-cluster sources, in agreement with the estimate of Section 5.1. In conclusion we estimate a number of 22 genuine cluster radio galaxies.
6 Radio Morphology
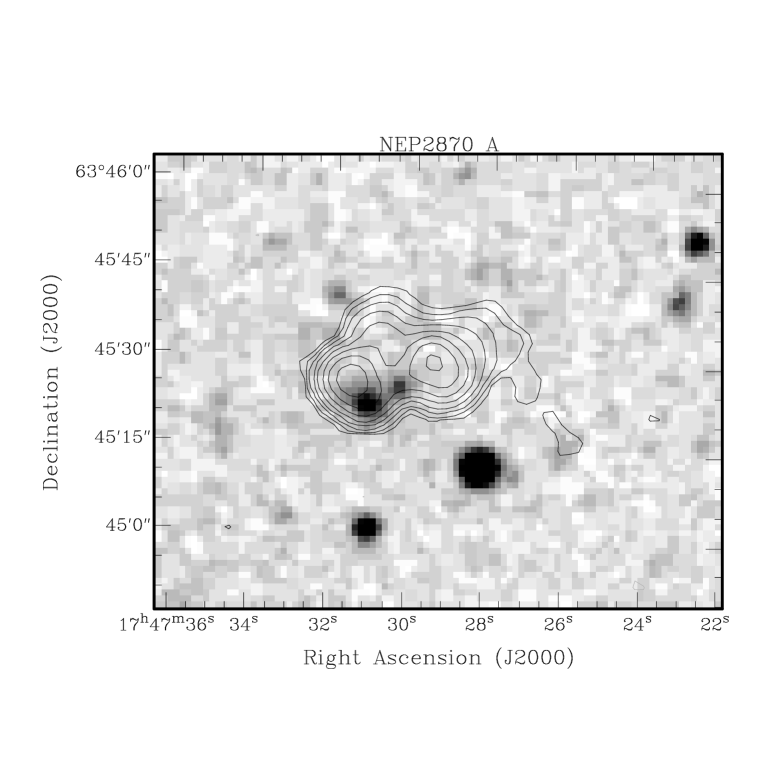
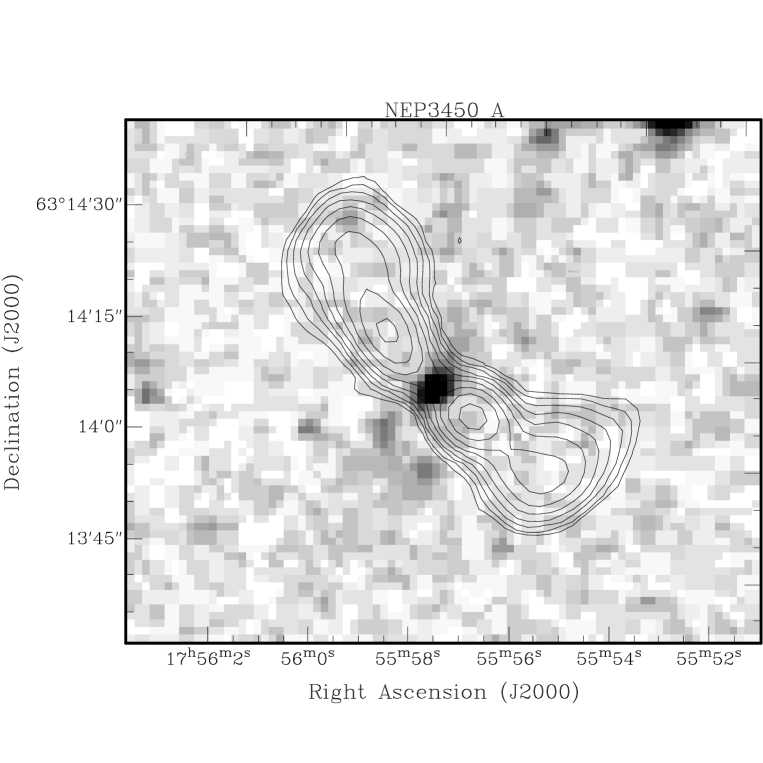
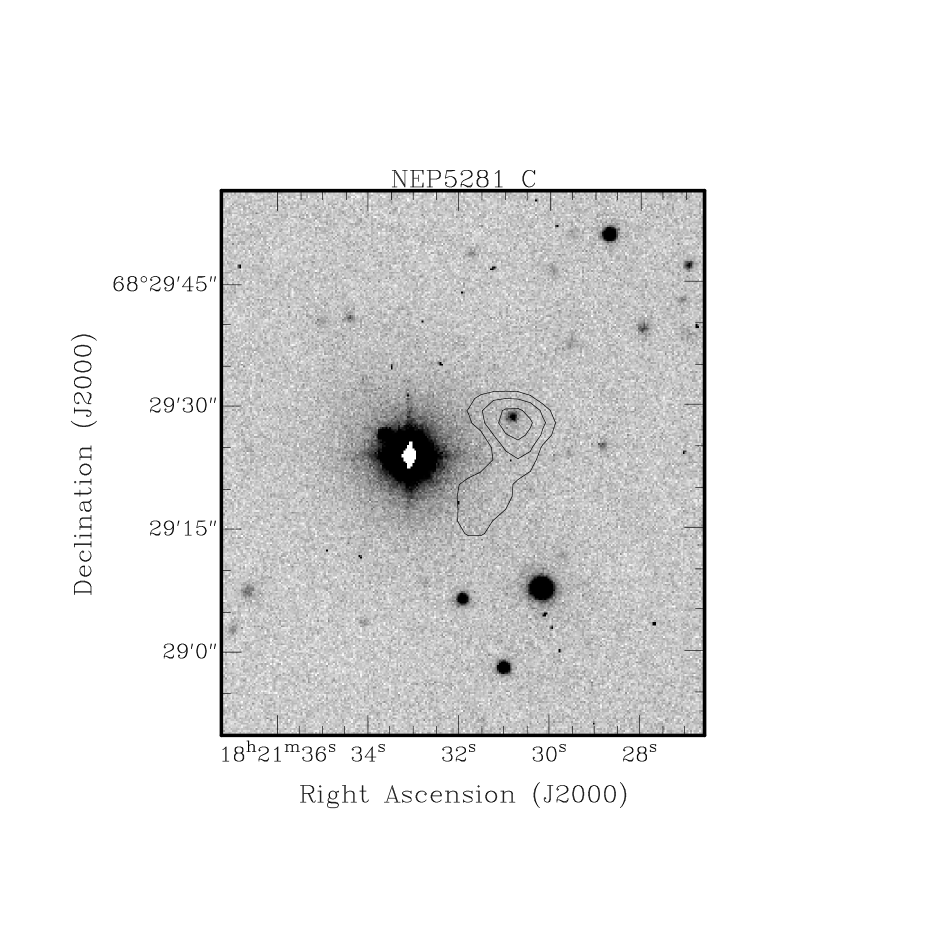
Approximately 68% of the NEP radio sources are unresolved with an estimated maximun deconvolved angular size of 1.2beam size for fainter sources ( 0.2 mJy), and 0.33 beam size for sources with a flux density 1 mJy. Approximately 16% (13 sources) have angular sizes in the range to and the remaining sources have sizes less than 8′′. Five of the 14 sources labelled as in Table LABEL:tab2 exhibit a head–tail morphology, four are double sources, one is a triple source and four have an uncertain morphological classification. Fifty percent of the 14 sources are within 0.2 RA and five of them are associated with the brightest central galaxies, or BCGs. Four more sources (one classified as and three classified as ) coincide with the BCG. In total 9 radio sources are associated with the cluster brightest central galaxies, that is about half of the 17 clusters have a radio emitting central galaxy. If we limit our analysis to the assumed 22 cluster radio galaxies the resolved and unresolved sources divide equally. Although the statistics are very small there is a correlation between source linear size and radio power as shown in Fig. 7. Filled symbols indicate cluster radio sources with redshift, open symbols indicate radio sources considered to be cluster members according to the optical magnitude criterion. The circles indicate the resolved, partially resolved and extended sources while the triangles refer to unresolved sources. The sizes of the unresolved sources are obtained by assigning appropriate upper limits to the maximum deconvolved angular sizes (see Section 4). About half of the sources with log P 24.0 has a linear size 40 kpc, while most of the sources with log P 24.0 have a linear size less than 30 kpc. Fig. 11, 12 and 13 show radio contours of the more extended radio sources overplotted onto optical POSS II red images (greyscale). For NEP 5281 C the I-band image obtained at the UH 2.2m telescope was used. In all images North is up and East to the left.

6.1 Notes on Individual Sources
– NEP 1730 B: This source has a component with S 0.56 mJy, which coincides with the optical BCG, plus a second fainter component with a S 0.22 mJy.
– NEP 1730 D: Small double source with no optical counterpart. The radio source component flux densities are S 0.19 mJy (North) and S 0.17 mJy (South).
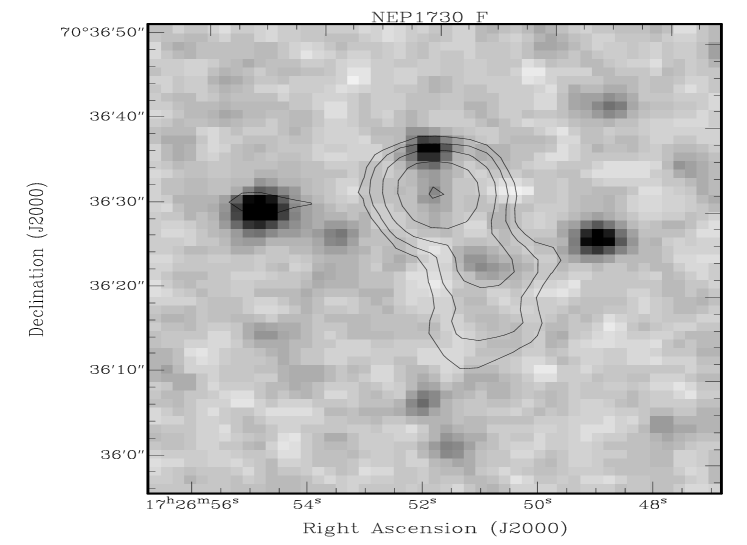
– NEP 1730 F: This radio source is associated with a weak galaxy (m20.6) coinciding with the source peak which was considered the identification (see top panel of Fig. 11). The radio morphology resembles a small head-tail source thus not excluding its cluster membership in spite of the faint galaxy red magnitude (Section 5.2). There is a similar magnitude object coinciding with the South-West radio extension of the source.
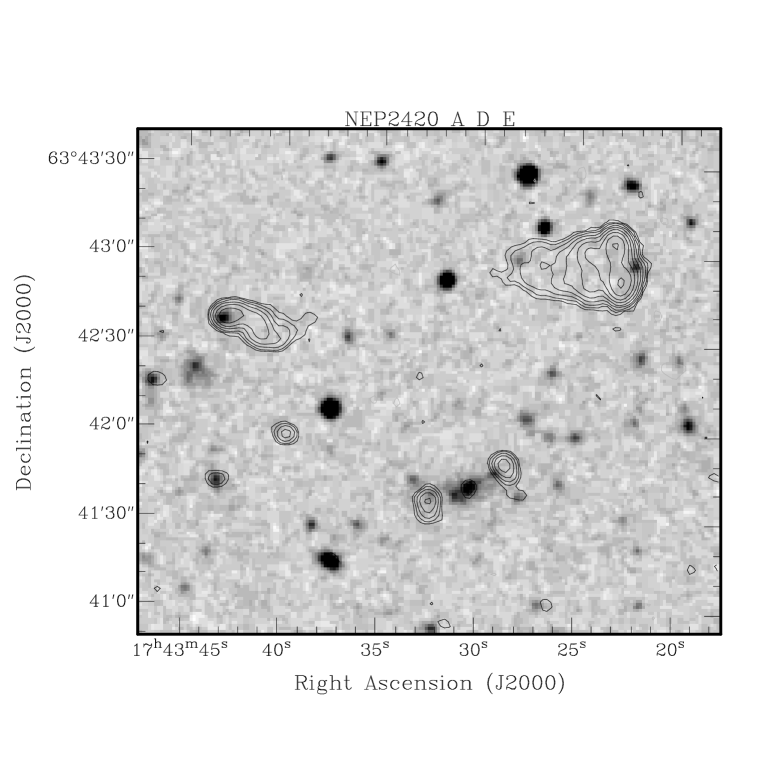
– NEP 2420 A: Located at the center of the cluster A2280, this is a triple straight source with a linear size of 116.8 kpc (the southermost source in bottom panel of Fig. 11). Although we have no radio spectral information we tentatively assume that the central component is the radio core. The lobes appear oriented roughly perpendicular to the source major axis. A higher resolution map would be required to properly describe the source structure, in particular to check if the brightness peaks are hotspots. In this case the source could be classified as an FRII, quite unusual for a central cluster radio source. The radio source components flux densities are: S 2.72 mJy (East), S 0.31 mJy (Center) and S 3.39 mJy (West).
– NEP 2420 D: The overall head-tail morphology of the source is dominated by two bright components, a very extended emission to the East of the two main components and a slight extension to the West. At first sight an inspection of Fig. 11 could give the impression that NEP 2420 D and the source to the East NEP 2420 E described below are components of the same single radio source hosted by the bright object at 17h43m31.5s 63∘42′51.9′′. However the object is classified as a star by SuperCosmos and APM surveys and it also shows spikes (confirming its stellar nature) in much deeper proprietary images taken with the Canada-France-Hawai′i Telescope (CFHT) that we can access. In addition both NEP 2420 D and E have an head-tail morphology which goes against the double radio source hypothesis. Lacy et al. (1993) studied the field of NEP 2420 D and identified this radio source with a faint galaxy about 4′′ North of the midpoint of the radio hotspots. In Lacy et al. (1999) the radio source is identified with a faint object at the midpoint of the radio hotspots. Both radio galaxies are consistent, according to Lacy and collaborators, with being members of the A2280 cluster at z0.324. However, Lacy et al. (1999) are surprised by the fact that, whichever is the identification, the radio source is very unusual in having an apparently very subluminous optical counterpart. This consideration prompted us to examine the whole A2280 area by inspecting CFHT images much deeper than the DSS II. We believe that the correct identification is the brighter galaxy to the West which has an absolute magnitude comparable to the other cluster galaxies (see Table LABEL:tab3). Please note that the radio contours are clearly distorted and denser at the location of this galaxy in our Fig. 11. Lacy et al. (1992) could barely detect either the very extended tail to the East and the extension to the West given their A-array high-resolution and low sensitivity observations (see Figure 5 of their paper where only the structure of this double radio source, called 8C 1743637, is clearly outlined). In conclusion NEP 2420 D is classified by us as a head-tail radio source and the optical galaxy to the West is assumed to be the source optical counterpart. The radio source has been used in the evaluation of the RLF since it lies within 0.2 RA from the cluster center. We have also considered the case where the bright object in between the two radio sources D and E in Fig. 11 is a field quasar and thus is the optical identification. The RLF remains unchanged within the errors.
– NEP 2420 E: The radio source appears to have a head-tail morphology (eastern source in bottom panel of Fig. 11) and it is very likely associated to the cluster given the absolute optical magnitde of the associated galaxy. Since the source is located at = 0.21, it was not used for the computation of the radio luminosity function.
– NEP 2420 F: The source is elongated in North-South direction and does not show a well defined morphology. The galaxy at 6to North-East of the radio peak is suggested as the radio source optical counterpart. On the basis of the magnitude criterion of Section 5.2 this galaxy might be a cluster galaxy.
– NEP 2420 H: The radio source shows an amorphous morphology without any visible optical counterpart.
– NEP 2770 A: The radio source is located at the cluster center and shows a bright peak and a faint tail to the South. The galaxy identified as the optical counterpart is a cluster member and is located 3to North-East of the brightness peak. The source could be classified as a small head-tail source but a higher resolution map is required to confirm this interpretation.
– NEP 2870 A: This is a double radio source at the cluster center with faint extensions off axis to the North (see top panel of Fig. 12). The object suggested as the optical counterpart is classified as star-like in the SuperCOSMOS/POSS II catalogue. For this reason we have not used it in the computation of the RLF (Section 7). Should it be a compact galaxy according to the magnitude criterion of Section 5.2 then it might be a cluster member.
– NEP 2950 C: Double radio source whose component flux densities are: S 0.35 mJy (North) and S 0.44 mJy (South). The assumed optical counterpart, located close to the peak of the brighter southern component, is classified as a star-like object in the SuperCOSMOS/POSS II catalogue.
– NEP 3130 A: The optical image is shown in the bottom panel of Fig. 12. The radio source is located at the cluster center.
– NEP 3200 A: This object is at the redshift of the cluster and shows a broad H emission line in its optical spectrum. It is thus classified as a broad line radio galaxy. According to the SuperCOSMOS catalogue the galaxy is blue with a BR0.8.
– NEP 3450 A: This is the largest linear size radio source of the sample (180 kpc; see Fig. 13). It is at the cluster center and shows a double radio structure of the FRI type.
– NEP 4150 H: This source is a second example of a broad emitting line object at the cluster redshift. The optical spectrum shows Balmer lines with FWHM 2500 km s-1 and it is thus classified as a broad line radio galaxy. According to the SuperCOSMOS catalogue the galaxy is blue with a BR1.3.
– NEP 5281 C: This radio source was identified on a I-band image of the UH 2.2m telescope taken specifically for this cluster which is the most distant cluster in the survey (z0.81). An image is shown in the bottom panel of Fig. 13. The radio source resembles a small head-tail source.
7 The NEP Radio Luminosity Function
The radio luminosity function is a powerful statistical tool to investigate the radio properties of a galaxy population. It is reasonable to expect that any difference in the radio properties of a sample of galaxies should be reflected in the radio luminosity function, either as a change in shape, amplitude or both. In absence of optical counts of ellipticals for the clusters under study it is not possible to determine the fractional radio luminosity function (i.e. the fraction of cluster galaxies able to produce a radio source) as was done by Ledlow & Owen (1996). Following Fanti (1984) we have adopted the following approach: the RLF represents the number of radio galaxies per cluster as a function of radio power. Given the very high contamination by field sources for 0.2 (see Section 5) only radio sources lying inside this radius have been used to derive the RLF. The sample of 32 objects used for the computation of the RLF is listed in Table LABEL:tab4 where the columns contain the following information:
-
•
Column 1: Internal NEP cluster identification number
-
•
Column 2: Source identification letter
-
•
Column 3, 4: K-corrected peak and integral radio luminosities (see text). For the K-correction a spectral index 0.8 (Sν ) has been assumed
-
•
Column 5: Absolute red magnitude, (see Section 5.2)
-
•
Column 6: Largest linear size in kpc
-
•
Column 7: Source weight used for the computation of the RLF (see text)
-
•
Column 8: Comment on cluster membership, see footnote to the table.
For each radio source both peak and integral radio luminosities (Ppeak, PI) have been computed. K-corrections were calculated assuming a spectral index 0.8 (Sν ) and then applying the relation K(z)(1+z)-(1+α). In the same way a luminosity limit , corresponding to the peak brightness limit of 0.17 mJy beam-1, has been calculated for each cluster except for NEP 3130, for which its own flux density limit has been used. The contribution (column 5 of Table LABEL:tab4) of each source i to the RLF is computed as:
where is the number of clusters in which that source could have been detected (). Then the individual source contributions within logarithmic bins of total luminosity have been summed. The bins may have different widths since they were chosen so as to always have at least two objects per bin. Each bin occupation has been normalized to the interval log P 0.5. In order to estimate the effect of the 10 non cluster radio sources on the RLF two different approaches were adopted. The first one is simply to omit sources which are unlikely to be cluster members, namely those objects with or (seven objects) and the three objects which are classified as star-like objects. The second approach is based on the statistical estimate of the field sources (see Section 5.1). The number of contaminant field sources, computed for each cluster as described in Section 5.1, was distributed into logarithmic bins of flux density according to the logN-LogS of the field sources. The geometric mean of each flux density interval has been assigned to these contaminant ”fractions” of sources. Their spurious contribution was computed in the same way as for the radio sources and subtracted from the RLF. The differential logarithmic RLFs, computed with the two methods, are given in Table LABEL:tab5 and Table LABEL:tab6 and are shown in the top panel of Fig. 8. They agree pretty well within the statistical errors. The bottom panel of Fig. 8 shows the integral RLFs, also given in Table LABEL:tab5 and Table LABEL:tab6.


8 Comparison with Other Cluster RLFs
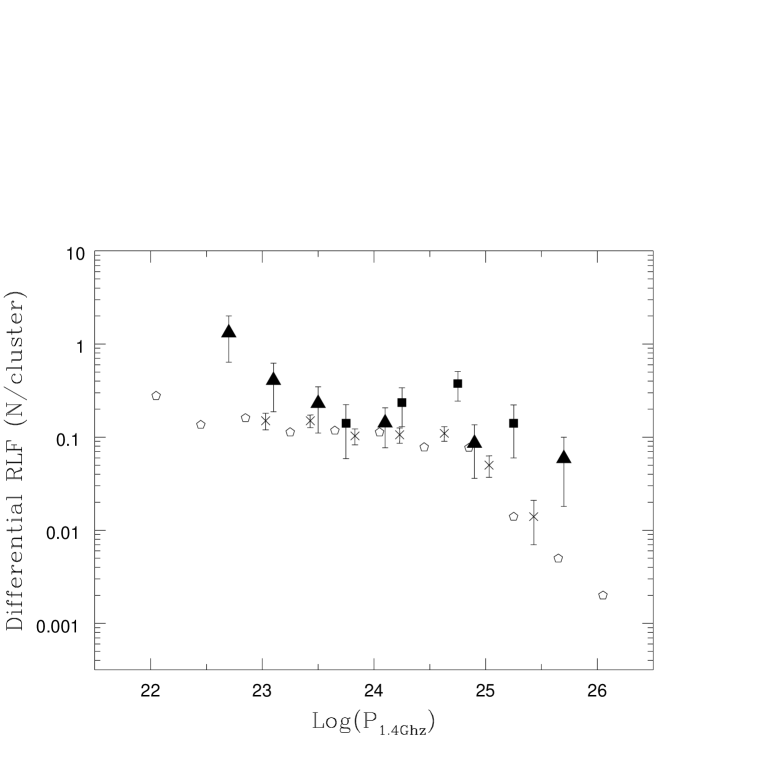
To verify if any similarities exist in the radio properties of local and distant clusters of galaxies, the RLF of the radio galaxies of the NEP cluster sample has been compared with the radio luminosity function of distant clusters by Stocke et al. (1999) (see column 2 of their Table 8) reanalized using our method. We have also compared the NEP RLF with the RLFs for nearby rich Abell clusters. For this purpose we used the RLF by Fanti (1984) and Ledlow & Owen (1996) reanalized by us. To compare our data with the RLFs in the literature, a bin log P 0.4 has been used. Such a comparison is shown in Fig. 9. We note that the comparison RLFs refer to R/R 0.3 (the one by Fanti, which was computed within 1 RA, has been rescaled using the radial distribution given in that paper) while the NEP RLF is for R/R 0.2. According to the radial distributions of cluster radio sources given in Fanti (1984) and Ledlow & Owen (1995) a multiplicative factor of would have to be applied to the NEP counts in order to make them comparable to the R/R 0.3 radio counts, thus even strengthening the conclusions of the present study.
As it can be seen from the figure, the NEP RLF lies above the local RLFs. The significance of this difference was checked by computing the number of cluster radio galaxies expected in the NEP survey from a RLF similar to the local ones. Down to log P1.4 (W Hz-1) 22.5 we would have expected 8 cluster radio sources within against 22 (contamination corrected) objects found. The difference is significant at 2.5 level. In addition we have no evidence of the break at log P1.4 (W Hz-1) 24.8 (e.g. Ledlow & Owen, 1996). Actually, according to the Ledlow & Owen (1996) RLF we would have expected one source above the break, while we have four. In addition the slope of the NEP RLF appears steeper than the one found in the local samples. To stress further these findings we have applied the Maximum Likelihood Method to the NEP and Ledlow & Owen (1996) data. Both datasets have been fitted with a power law of the form , where is the number of sources per cluster in an interval centered on . The results of the fit are given in Table LABEL:tab7. The results of the Ledlow and Owen data are the same as those given in Ledlow & Owen (1996). The Fig. 10 shows the areas of 1 and 2 confidence level contours for the two fits.

The probability that the two RLFs are drawn from the same distribution is 0.25% and even less if we take into account that the NEP RLF refers to a cluster area smaller than the one of the comparison sample. Finally, we note that the RLF by Stocke et al. (1999) is higher than ours by a factor about two except in their lower radio power bin where the same authors suspect some incompleteness.
Although at present we cannot exclude evolutionary effects in the cluster source population, we have to evaluate whether the differences we see between high and low redshift clusters could be due to a selection effect. It is worth noting that the two high redshift cluster samples were X-ray selected and therefore they are overluminous in the X-ray band as compared to the low redshift samples. Abramopoulos & Ku (1983) and earlier Bahcall (1977) suggested that the X ray luminosity of a cluster is related to the central ( 0.5 Mpc) galaxy density approximately as a square law (). On this basis Stocke et al. (1999) computed a fractional RLF per galaxy assuming a higher galaxy population density (see Figure 8 and Table 8, column 3 in Stocke et al., 1999) and found no differences with the one of Ledlow and Owen (1996). The median X-ray luminosities of the Ledlow & Owen (1996), NEP and Stocke et al. (1999) samples are (see Ledlow et al., 2003), and erg/sec respectively. According to the scaling relations of Abramopoulos & Ku (1983) and Bahcall (1977), we would expect central galaxy population ratios of 1, 2.4 and 6.8. These ratios of galaxy populations would explain the differences in amplitude of the luminosity functions, even though Rizza et al. (2003) find a weak anticorrelation in X-ray bright z0.2 clusters between the radio fraction and optical richness. A different or additional explanation is required to justify the steeper slope, and the absence of a break in the NEP RLF of cluster galaxies. We may speculate that different X-ray cluster luminosities are related to different shapes of the optical luminosity function of the cluster galaxies. A higher fraction of optically very bright galaxies could explain the apparent lack of the break in the NEP RLF, as the break increases with optical luminosity (Ledlow & Owen, 1996). However, Best et al. (2005) find no evidence for any dependence of the break luminosity on black hole mass by examining the properties of the host galaxies of a well defined sample of over 2000 radio loud AGN from the Sloan Digital Sky Survey (SDSS). Thus this explanation could not be viable in our case. On the other hand at lower radio luminosities a strongly enhanced star formation activity extending up to W Hz-1 could explain the steeper slope at the fainter radio end. This evolution of the radio galaxy population as a function of redshift was already observed in z0.4 clusters by Morrison (1999) who suggested that low-power radio sources are presumably linked to an increase in the star formation. In our sample there is a fraction of low power radio galaxies with bluer SuperCOSMOS colors (3 out of 5 galaxies with log(P23 have colors of order B-R 0.8–1.3) which might represent star-forming galaxies. However the presence of broad emission lines in their optical spectra rules out the star formation scenario. In general the optical spectroscopic data available for most of the sample sources do not have the sufficient quality to discriminate an AGN from a star forming galaxy. If one adopts the currently-favored cosmological concordance model ( = 0.73, =0.27 and H 71 km s-1 Mpc-1, Spergel et al., 2003) the derived luminosities of the NEP sources would have been 29% higher at z 0.3 and 39% higher at z 0.8. Part of these percentages (12%) is due to the different Hubble costant adopted and is redshift independent. With the concordance cosmology the search area radius of 0.2 becomes smaller by 10% at z 0.8 and by 7% at z 0.3. The use of the concordance cosmology does not affect the number of sources used for the computation of the RLF but instead shifts the RLF towards higher radio luminosities, although not by a constant factor. The effect of the new cosmology on the nearby cluster sample is very small. The shift to higher luminosity due to the concordance model is mainly due to the different (12%). So the difference found between distant and nearby cluster samples would be even slightly enhanced.
Any interpretation of these new results has to await for more data and information both on the radio side, in terms of better statistics, and on the optical side, in terms of complete spectroscopic and photometric data, galaxy classification, proper galaxy counts and optical luminosity functions.
9 Summary and Conclusions
We have used the complete NEP sample of distant galaxy clusters (0.3 z 0.8) as targets for a deep VLA continuum survey at 1.4 GHz down to 0.17 mJy beam-1. The radio survey has discovered 79 radio sources within half Abell radius (1 Mpc in the cosmology adopted here) of which 32 are within 0.2 Abell radius. This radio sample is the most numerous sample of distant objects to compare with the detailed studies of radio galaxies in nearby Abell clusters conducted by Fanti (1984) and by Owen and collaborators (among others Odea & Owen, 1985; Ledlow & Owen, 1995, 1996; Owen & Ledlow, 1997; Owen et al., 1999; Morrison & Owen, 2003). The field source counts of the NEP radio sources are in agreement within the errors with the VLA-VIRMOS deep field survey indicating that the NEP sample is statistically complete.
Approximately 68% of the NEP radio sources are unresolved, 16% (13 sources) have angular sizes in the range 8′′ to 40′′. The extended sources exhibit all kinds of morphology, from head–tail morphology, to double sources and even one triple source. The identification of a radio source with a cluster member has been made on the basis of the spectroscopic redshift (available only for 14 galaxies, belonging to 11 different clusters), of the absolute magnitude of the associated object (see Section 5.2) and on its optical classification on the SuperCOSMOS/POSS II catalogue (see Section 4.2). Radio powers of the cluster sources range from log P1.4 (W Hz-1) 22.5 to log P1.4 (W Hz-1) 26.0.
The RLF for the NEP distant clusters has been computed as the number of radio galaxies per cluster as a function of radio power, and using only those radio galaxies within R/R 0.2 where field contamination is minimum. Previous radio observations of X-ray distant galaxy clusters were performed by Stocke et al. (1999) and Perlman et al. (2003). Neither study found any significant evidence for evolution in the population of distant cluster radio galaxies when compared to lower redshift clusters. The above mentioned authors normalize their RLF by a higher central galaxy population (according to the correlation between X-ray luminosity and galaxy counts of Abramopoulos & Ku, 1983) when comparing their RLF with the low-z cluster RLF. Thus it was surprising to discover a change in the NEP RLF, both in slope and amplitude with respect to the local cluster samples, and the absence of a break at about log P1.4 (W Hz-1) 24.8 observed by Fanti (1984) and Ledlow & Owen (1996) in nearby rich Abell clusters.
Although it is tempting to claim a kind of density evolution in the RLF of distant clusters, coupled with a luminosity evolution at higher redshift, we believe that better statistics and sample complete optical identification are required. Even if evolutionary effects cannot be completely excluded, the higher amplitude of the NEP cluster RLF could be explained in terms of higher X-ray luminosity and thus higher central galaxy population density in the present sample with respect to the Ledlow & Owen (1996) sample, as invoked by Stocke et al. (1999). We may consider other, ad hoc, effects to explain the absence of a break in the NEP RLF and the steepness of the slope. For instance a higher fraction of optically very bright galaxies would shift the break to higher radio powers (Ledlow & Owen, 1996) (although Best et al., 2005, find no evidence for a dependence of the radio break with the black hole mass of the radio loud AGN hosted by the galaxies). On the other hand a strongly enhanced star formation activity at the faint radio end extending up to roughly log P (W Hz 23 would steepen the RLF slope (Morrison, 1999). In absence of more data these are only speculations awaiting to be confirmed by a much better statistics and deeper optical and radio data.
The main result of this study is that the RLF of the distant X-ray clusters is very different from that of the local rich Abell clusters.
Acknowledgements.
This research uses data obtained with the National Radio Astronomy Observatory Very Large Array: NRAO is operated by Associated Universities, Inc., under cooperative agreement with the National Science Foundation. The authors wish to thank an anonymous and competent referee for several helpful comments and suggestions.References
- Abramopoulos & Ku (1983) Abramopoulos, F. & Ku, W. H.-M. 1983, ApJ, 271, 446
- Bahcall (1977) Bahcall, N. A. 1977, ApJ, 217, L77
- Best et al. (2005) Best, P. N., Kauffmann, G., Heckman, T. M., et al. 2005, astro-ph/0506269
- Best et al. (2002) Best, P. N., van Dokkum, P. G., Franx, M., & Röttgering, H. J. A. 2002, MNRAS, 330, 17
- Bondi et al. (2003) Bondi, M., Ciliegi, P., Zamorani, G., et al. 2003, A&A, 403, 857
- Burns et al. (1979) Burns, J. O., Owen, F. N., & Rudnick, L. 1979, AJ, 84, 1683
- Condon (1997) Condon, J. J. 1997, PASP, 109, 166
- Condon et al. (1998) Condon, J. J., Cotton, W. D., Greisen, E. W., et al. 1998, AJ, 115, 1693
- Crawford & Fabian (1996) Crawford, C. S. & Fabian, A. C. 1996, MNRAS, 281, L5
- de Ruiter et al. (1977) de Ruiter, H. R., Arp, H. C., & Willis, A. G. 1977, A&AS, 28, 211
- Ellingson et al. (1991) Ellingson, E., Yee, H. K. C., & Green, R. F. 1991, ApJ, 371, 49
- Fanti (1984) Fanti, R. 1984, in ASSL Vol. 111: Clusters and Groups of Galaxies, 185–+
- Fukugita et al. (1995) Fukugita, M., Shimasaku, K., & Ichikawa, T. 1995, PASP, 107, 945
- Gioia et al. (2003) Gioia, I. M., Henry, J. P., Mullis, C. R., et al. 2003, ApJS, 149, 29
- Gioia et al. (2004) Gioia, I. M., Wolter, A., Mullis, C. R., et al. 2004, A&A, 428, 867
- Henry et al. (2001) Henry, J. P., Gioia, I. M., Mullis, C. R., et al. 2001, ApJ, 553, L109
- Hill & Lilly (1991) Hill, G. J. & Lilly, S. J. 1991, ApJ, 367, 1
- Lacy et al. (1993) Lacy, M., Hill, G. J., Kaiser, M. E., & Rawlings, S. 1993, MNRAS, 263, 707
- Lacy et al. (1999) Lacy, M., Rawlings, S., Hill, G. J., et al. 1999, MNRAS, 308, 1096
- Lacy et al. (1992) Lacy, M., Rawlings, S., & Warner, P. J. 1992, MNRAS, 256, 404
- Ledlow & Owen (1995) Ledlow, M. J. & Owen, F. N. 1995, AJ, 109, 853
- Ledlow & Owen (1996) Ledlow, M. J. & Owen, F. N. 1996, AJ, 112, 9
- Ledlow et al. (2003) Ledlow, M. J., Voges, W., Owen, F. N., & Burns, J. O. 2003, AJ, 126, 2740
- Morrison (1999) Morrison, G. E. 1999, Ph.D. Thesis
- Morrison & Owen (2003) Morrison, G. E. & Owen, F. N. 2003, AJ, 125, 506
- Mullis (2001) Mullis, C. R. 2001, Ph.D. Thesis
- Odea & Owen (1985) Odea, C. P. & Owen, F. N. 1985, AJ, 90, 954
- Owen & Laing (1989) Owen, F. N. & Laing, R. A. 1989, MNRAS, 238, 357
- Owen & Ledlow (1997) Owen, F. N. & Ledlow, M. J. 1997, ApJS, 108, 41
- Owen et al. (1999) Owen, F. N., Ledlow, M. J., Keel, W. C., & Morrison, G. E. 1999, AJ, 118, 633
- Owen et al. (2005) Owen, F. N., Ledlow, M. J., Keel, W. C., Wang, Q. D., & Morrison, G. E. 2005, AJ, 129, 31
- Owen & Rudnick (1976) Owen, F. N. & Rudnick, L. 1976, ApJ, 205, L1
- Owen & White (1991) Owen, F. N. & White, R. A. 1991, MNRAS, 249, 164
- Pentericci (1999) Pentericci, L. 1999, Ph.D. Thesis
- Pentericci et al. (1999) Pentericci, L., Röttgering, H. J. A., Miley, G. K., et al. 1999, A&A, 341, 329
- Pentericci et al. (1997) Pentericci, L., Roettgering, H. J. A., Miley, G. K., Carilli, C. L., & McCarthy, P. 1997, A&A, 326, 580
- Perlman et al. (2003) Perlman, E. S., Frye, C., Ebeling, H., et al. 2003, astro-ph/0303533
- Reid et al. (1991) Reid, I. N., Brewer, C., Brucato, R. J., et al. 1991, PASP, 103, 661
- Rizza et al. (2003) Rizza, E., Morrison, G. E., Owen, F. N., et al. 2003, AJ, 126, 119
- Simpson & Rawlings (2002) Simpson, C. & Rawlings, S. 2002, MNRAS, 334, 511
- Spergel et al. (2003) Spergel, D. N., Verde, L., Peiris, H. V., et al. 2003, ApJS, 148, 175
- Stocke et al. (1999) Stocke, J. T., Perlman, E. S., Gioia, I. M., & Harvanek, M. 1999, AJ, 117, 1967
- Venemans et al. (2002) Venemans, B. P., Kurk, J. D., Miley, G. K., et al. 2002, ApJ, 569, L11
- Voges et al. (1999) Voges, W., Aschenbach, B., Boller, T., et al. 1999, A&A, 349, 389
- Voges et al. (2001) Voges, W., Henry, J. P., Briel, U. G., et al. 2001, ApJ, 553, L119
| Cluster | rms | Source | RA(J2000) | DEC(J2000) | R/RA | S | SI | P.A. | Notes | ||
|---|---|---|---|---|---|---|---|---|---|---|---|
| mJy beam-1 | mJy beam-1 | mJy | ∘ | ||||||||
| NEP 200 | 0.034 | A | 17 57 21.36 | 66 29 45.1 | 0.32 | 0.430.03 | 0.430.03 | u | |||
| NEP 310 | 0.033 | A | 17 59 03.58 | 65 20 02.5 | 0.17 | 0.940.04 | 1.060.06 | 2.6 | 166.2 | ru | |
| B | 17 59 05.07 | 65 20 57.8 | 0.12 | 0.300.03 | 0.300.03 | u | |||||
| C | 17 59 05.67 | 65 18 47.9 | 0.33 | 0.340.03 | 0.340.03 | u | |||||
| D | 17 59 28.67 | 65 21 41.5 | 0.45 | 0.410.03 | 0.410.03 | u | |||||
| NEP 1730 | 0.032 | A | 17 27 36.49 | 70 35 23.4 | 0.05 | 0.420.03 | 0.580.06 | 4.4 | 97.9 | ru | |
| B | 17 27 33.60 | 70 35 47.0 | 0.00 | 0.260.03 | 0.780.14 | 8 | 35 | ext | |||
| C | 17 27 57.97 | 70 34 54.6 | 0.26 | 0.310.03 | 0.310.03 | u | |||||
| D | 17 27 57.38 | 70 35 40.9 | 0.23 | 0.190.04 | 0.360.06 | 5 | 7 | ext | |||
| E | 17 28 16.73 | 70 36 34.9 | 0.43 | 0.240.03 | 0.240.03 | u | |||||
| F | 17 26 52.03 | 70 36 31.7 | 0.42 | 2.200.08 | 5.210.21 | 18 | 17 | ext | |||
| NEP 1780 | 0.033 | A | 17 28 38.38 | 70 41 02.6 | 0.00 | 4.840.15 | 4.840.15 | u | |||
| B | 17 28 55.74 | 70 40 11.4 | 0.28 | 4.300.13 | 4.300.13 | u | |||||
| C | 17 28 34.06 | 70 39 09.1 | 0.32 | 0.200.02 | 0.200.02 | u | |||||
| D | 17 28 09.03 | 70 41 04.1 | 0.39 | 0.270.03 | 0.270.03 | u | |||||
| NEP 2420 | 0.032 | A | 17 43 30.47 | 63 41 41.3 | 0.00 | 2.530.08 | 6.420.18 | 28.4 | 117 | ext | |
| B | 17 43 39.84 | 63 41 58.4 | 0.13 | 1.110.04 | 1.110.04 | u | |||||
| C | 17 43 43.31 | 63 41 42.6 | 0.18 | 0.410.03 | 0.410.03 | u | |||||
| D | 17 43 23.14 | 63 42 58.5 | 0.19 | 29.550.89 | 187.056.07 | 36 x 14 | 96 | ext | |||
| E | 17 43 43.04 | 63 42 38.0 | 0.21 | 6.750.21 | 21.140.66 | 21 | 69 | ext | |||
| F | 17 44 03.11 | 63 41 16.8 | 0.45 | 0.840.05 | 4.430.20 | 16 | 13 | ext | |||
| G | 17 44 05.82 | 63 41 16.4 | 0.49 | 0.430.03 | 0.430.03 | u | |||||
| H | 17 44 03.99 | 63 40 12.3 | 0.49 | 0.320.05 | 1.630.13 | 9 | 120 | ext | |||
| I | 17 43 37.39 | 63 41 16.3 | 0.11 | 0.210.02 | 0.210.02 | u | |||||
| L | 17 43 46.43 | 63 42 16.1 | 0.23 | 0.230.03 | 0.230.03 | u | |||||
| M | 17 43 39.55 | 63 43 49.0 | 0.29 | 0.200.03 | 0.200.03 | u | |||||
| NEP 2560 | 0.028 | A | 17 45 17.07 | 65 53 34.3 | 0.37 | 0.250.02 | 0.250.02 | u | |||
| B | 17 45 16.19 | 65 56 37.3 | 0.16 | 0.250.02 | 0.250.02 | u | |||||
| C | 17 45 32.84 | 65 57 54.8 | 0.46 | 0.310.02 | 0.310.02 | u | |||||
| D | 17 45 27.02 | 65 58 02.4 | 0.43 | 0.300.03 | 0.300.03 | u | |||||
| NEP 2770 | 0.031 | A | 17 46 46.30 | 66 39 02.5 | 0.01 | 0.490.03 | 1.050.09 | 10 | 10 | ext | |
| B | 17 46 53.41 | 66 40 21.9 | 0.20 | 0.690.04 | 0.870.06 | 3.7 | 172.4 | ru | |||
| C | 17 46 54.88 | 66 39 19.7 | 0.11 | 0.200.02 | 0.200.02 | u | |||||
| NEP 2870 | 0.027 | A | 17 47 30.58 | 63 45 27.2 | 0.01 | 17.860.54 | 74.442.24 | 29 | 115 | ext | |
| B | 17 47 42.40 | 63 45 05.6 | 0.16 | 3.480.11 | 6.180.24 | 6.7 | 38.8 | ru | |||
| C | 17 47 12.83 | 63 47 08.9 | 0.33 | 0.630.03 | 0.630.03 | u | |||||
| D | 17 47 01.15 | 63 44 46.0 | 0.42 | 9.630.29 | 9.630.29 | u | |||||
| E | 17 47 41.76 | 63 41 57.8 | 0.45 | 0.460.03 | 0.460.03 | u | |||||
| F | 17 47 34.28 | 63 43 20.7 | 0.25 | 0.260.02 | 0.260.02 | u | |||||
| G | 17 47 44.35 | 63 48 18.2 | 0.40 | 0.260.03 | 0.260.03 | u | |||||
| H | 17 47 46.49 | 63 48 24.6 | 0.43 | 0.290.03 | 0.290.03 | u | |||||
| NEP 2950 | 0.030 | A | 17 48 57.56 | 70 20 02.1 | 0.21 | 1.230.07 | 1.230.04 | u | |||
| B | 17 48 23.03 | 70 20 17.4 | 0.18 | 0.360.03 | 0.360.02 | u | |||||
| C | 17 48 13.51 | 70 19 16.8 | 0.33 | 0.440.04 | 0.790.10 | 9 | 45 | ext | |||
| D | 17 48 06.07 | 70 21 25.3 | 0.37 | 0.690.04 | 0.680.03 | u | |||||
| E | 17 48 41.91 | 70 24 13.2 | 0.45 | 0.990.06 | 0.990.04 | u | |||||
| NEP 3130 | 0.052 | A | 17 51 32.69 | 70 13 21.3 | 0.00 | 18.350.55 | 24.390.77 | 8.1 | 37 | ext | |
| B | 17 51 22.24 | 70 13 19.3 | 0.14 | 1.210.05 | 1.210.05 | u | |||||
| C | 17 51 31.09 | 70 15 01.2 | 0.26 | 3.480.12 | 3.760.15 | 2.29 | ru | ||||
| NEP 3200 | 0.028 | A | 17 52 12.94 | 65 22 36.7 | 0.08 | 0.190.02 | 0.190.02 | u | |||
| B | 17 52 01.03 | 65 22 56.9 | 0.10 | 0.940.04 | 1.240.06 | 3.9 | 148.0 | ru | |||
| C | 17 52 30.71 | 65 22 32.2 | 0.33 | 2.190.07 | 2.190.07 | u | |||||
| NEP 3320 | 0.031 | A | 17 54 37.87 | 69 06 05.2 | 0.16 | 0.230.02 | 0.230.02 | u | |||
| B | 17 54 09.36 | 69 03 01.0 | 0.48 | 6.180.19 | 6.180.19 | u | |||||
| NEP 3450 | 0.032 | A | 17 55 57.90 | 63 14 08.9 | 0.00 | 35.221.06 | 183.445.51 | 40 | 48 | ext | |
| B | 17 55 44.76 | 63 12 38.9 | 0.29 | 0.600.04 | 0.740.07 | 3.6 | 77.6 | ru | |||
| NEP 4150 | 0.031 | A | 18 05 57.23 | 68 13 27.7 | 0.08 | 0.320.03 | 0.320.03 | u | |||
| B | 18 06 04.54 | 68 10 48.8 | 0.29 | 0.710.03 | 0.710.03 | u | |||||
| C | 18 06 22.66 | 68 11 22.6 | 0.29 | 0.330.03 | 0.330.03 | u | |||||
| D | 18 05 42.68 | 68 13 22.6 | 0.24 | 0.730.03 | 0.730.03 | u | |||||
| E | 18 05 30.88 | 68 12 52.3 | 0.37 | 4.900.15 | 6.670.22 | 5.6 | 106.8 | ru | |||
| F | 18 05 30.05 | 68 10 40.5 | 0.49 | 0.340.04 | 0.340.04 | u | |||||
| G | 18 06 12.74 | 68 15 58.8 | 0.33 | 0.260.03 | 0.260.03 | u | |||||
| H | 18 06 04.78 | 68 13 16.3 | 0.00 | 0.200.02 | 0.200.02 | u | |||||
| I | 18 06 08.81 | 68 13 10.0 | 0.04 | 0.210.02 | 0.210.02 | u | |||||
| L | 18 05 54.48 | 68 14 19.5 | 0.17 | 0.180.02 | 0.180.02 | u | |||||
| M | 18 06 31.77 | 68 13 28.0 | 0.29 | 0.220.03 | 0.220.03 | u | |||||
| NEP 4560 | 0.029 | A | 18 11 16.55 | 64 47 22.4 | 0.04 | 0.770.04 | 0.950.06 | 3.3 | 140.42 | ru | |
| B | 18 11 42.74 | 64 48 56.4 | 0.44 | 0.440.03 | 0.440.03 | u | |||||
| C | 18 11 21.40 | 64 50 31.3 | 0.47 | 0.240.03 | 0.240.03 | u | |||||
| D | 18 11 09.36 | 64 49 00.6 | 0.29 | 0.210.02 | 0.210.02 | u | |||||
| NEP 4610 | 0.026 | A | 18 12 08.18 | 63 53 31.8 | 0.00 | 1.670.06 | 2.150.10 | 3.2 x 1.3 | 180.0 | r | |
| B | 18 12 19.22 | 63 52 33.9 | 0.25 | 0.320.03 | 0.320.03 | u | |||||
| C | 18 12 12.86 | 63 53 58.5 | 0.11 | 0.220.02 | 0.220.02 | u | |||||
| D | 18 11 55.59 | 63 51 25.2 | 0.41 | 0.210.02 | 0.210.02 | u | |||||
| NEP 5281 | 0.032 | A | 18 21 37.12 | 68 27 50.9 | 0.07 | 0.730.04 | 1.030.08 | 3.4 x 2.44 | 32.3 | r | |
| B | 18 21 33.10 | 68 27 55.4 | 0.00 | 0.610.03 | 0.610.03 | u | |||||
| C | 18 21 30.72 | 68 29 28.0 | 0.30 | 0.600.04 | 1.140.10 | 12 | 118 | ext | |||
| D | 18 21 15.90 | 68 29 18.0 | 0.40 | 0.360.03 | 0.36 0.03 | u |
| Cluster | Source | RA(J2000) | DEC(J2000) | RA | DEC | mR | mB | Opt. | z |
|---|---|---|---|---|---|---|---|---|---|
| optical | optical | (o-r) | (o-r) | Class | |||||
| NEP 310 | B | 17 59 05.19 | 65 20 57.4 | + 0.7 | – 0.4 | 18.7 | 20.7 | G | |
| NEP 1730 | A | 17 27 36.36 | 70 35 23.6 | – 0.6 | + 0.2 | 18.7 | 21.1 | G | |
| B | 17 27 33.47 | 70 35 47.7 | – 0.6 | + 0.7 | 18.4 | 21.2 | G | 0.306* | |
| C | 17 27 58.01 | 70 34 54.3 | + 0.2 | – 0.3 | 19.7 | 20.7 | S | ||
| E | 17 28 17.04 | 70 36 35.0 | + 1.5 | + 0.1 | 20.1 | 22.5 | G | ||
| F | 17 26 51.72 | 70 36 31.8 | – 1.5 | + 0.1 | 20.6 | – | G | ||
| NEP 1780 | A | 17 28 38.40 | 70 41 02.7 | + 0.1 | + 0.1 | 19.9 | 20.9 | S | 0.550* |
| C | 17 28 33.96 | 70 39 08.9 | – 0.5 | – 0.2 | 20.0 | 21.5 | G | ||
| D | 17 28 09.17 | 70 41 03.5 | + 0.7 | – 0.6 | 20.7 | 21.8 | S | ||
| NEP 2420 | A | 17 43 30.47 | 63 41 41.4 | 0.0 | + 0.1 | 17.6 | 20.0 | G | 0.331* |
| C | 17 43 43.32 | 63 41 42.3 | + 0.1 | – 0.3 | 18.8 | 20.5 | G | ||
| D | 17 43 22.16 | 63 42 57.8 | – 6.5 | – 0.7 | 18.9 | 21.5 | G | ||
| E | 17 43 43.14 | 63 42 37.4 | + 0.7 | – 0.6 | 18.5 | 21.2 | G | ||
| F | 17 44 04.01 | 63 41 18.3 | + 6.0 | + 1.5 | 18.5 | 21.1 | G | ||
| G | 17 44 05.94 | 63 41 14.9 | + 0.8 | – 1.5 | 17.2 | 19.2 | S | ||
| I | 17 43 37.43 | 63 41 15.9 | + 0.3 | – 0.4 | 17.3 | 18.1 | G | ||
| L | 17 43 46.74 | 63 42 15.9 | + 2.1 | – 0.2 | 18.8 | 20.3 | G | ||
| NEP 2560 | A | 17 45 17.06 | 65 53 34.9 | 0.1 | + 0.6 | 19.8 | 22.3 | G | |
| D | 17 45 26.98 | 65 58 02.5 | – 0.2 | + 0.1 | 19.3 | 21.0 | G | ||
| NEP 2770 | A | 17 46 46.74 | 66 39 04.9 | + 2.6 | + 2.4 | 18.5 | 22.0 | G | 0.392* |
| B | 17 46 53.63 | 66 40 22.2 | + 1.3 | + 0.3 | 20.5 | 22.3 | S | ||
| C | 17 46 54.90 | 66 39 20.4 | + 0.1 | + 0.7 | 18.6 | 21.7 | G | 0.384* | |
| NEP 2870 | A | 17 47 30.26 | 63 45 25.5 | – 2.1 | – 1.7 | 19.7 | 21.1 | S | |
| B | 17 47 42.06 | 63 45 04.2 | – 2.2 | – 1.4 | 18.1 | 20.8 | G | 0.326* | |
| E | 17 47 41.80 | 63 41 57.6 | + 0.3 | – 0.2 | 18.5 | 21.2 | G | ||
| F | 17 47 34.26 | 63 43 20.0 | – 0.1 | – 0.7 | 18.9 | 20.3 | G | ||
| H | 17 47 46.45 | 63 48 25.4 | – 0.3 | + 0.8 | 20.2 | – | G | ||
| NEP 2950 | C | 17 48 12.83 | 70 19 13.3 | – 3.4 | – 3.5 | 20.5 | – | S | |
| E | 17 48 41.95 | 70 24 12.9 | + 0.2 | – 0.3 | 20.9 | – | G | ||
| NEP 3130 | A | 17 51 32.57 | 70 13 21.6 | – 0.6 | + 0.3 | 19.8 | – | G | 0.491* |
| NEP 3200 | A | 17 52 12.97 | 65 22 36.0 | + 0.2 | – 0.7 | 18.6 | 19.4 | G | 0.394* |
| NEP 3450 | A | 17 55 57.84 | 63 14 08.9 | – 0.4 | 0.0 | 18.5 | 21.7 | G | 0.386* |
| B | 17 55 44.73 | 63 12 38.6 | – 0.2 | – 0.3 | 17.5 | 18.8 | G | ||
| NEP 4150 | F | 18 05 30.09 | 68 10 40.0 | + 0.2 | – 0.5 | 18.4 | 20.6 | G | |
| H | 18 06 04.91 | 68 13 16.2 | + 0.7 | – 0.1 | 19.0 | 20.3 | G | 0.295* | |
| I | 18 06 08.99 | 68 13 09.6 | + 1.0 | – 0.4 | 18.5 | 19.3 | S | ||
| NEP 4560 | A | 18 11 16.57 | 64 47 22.3 | + 0.1 | – 0.1 | 16.9 | 18.9 | G | 0.174 |
| D | 18 11 09.31 | 64 49 01.2 | – 0.3 | + 0.6 | 20.1 | – | S | ||
| NEP 4610 | A | 18 12 08.15 | 63 53 31.5 | – 0.2 | – 0.3 | 20.4 | 21.8 | S | 0.545* |
| B | 18 12 19.39 | 63 52 34.3 | + 1.1 | + 0.4 | 17.9 | 19.5 | G | ||
| C | 18 12 12.82 | 63 53 59.0 | – 0.3 | + 0.5 | 19.6 | 20.9 | G | ||
| NEP 5281 | A | 18 21 37.20 | 68 27 51.0 | + 0.4 | + 0.1 | – | – | 0.815* | |
| B | 18 21 32.90 | 68 27 55.0 | – 1.1 | – 0.4 | – | – | 0.817* | ||
| C | 18 21 30.80 | 68 29 28.8 | + 0.4 | + 0.8 | – | – | 0.820* |
| Cluster | Source | log Ppeak (W Hz-1 beam-1) | log PI (W Hz-1) | LLS (kpc) | WRLF | Commentsa | |
|---|---|---|---|---|---|---|---|
| NEP 310 | A | 23.48 | 23.53 | -20.8 | 11.4 | 0.062 | 3 |
| B | 22.98 | 22.98 | -22.9 | 0.100 | 2 | ||
| NEP 1730 | A | 22.97 | 23.11 | -22.3 | 17.3 | 0.100 | 2 |
| B | 22.76 | 23.23 | -22.6 | 31.5 | 0.167 | 1 | |
| NEP 1780 | A | 24.59 | 24.59 | -23.3 | 0.059 | 1 | |
| NEP 2420 | A | 23.81 | 24.21 | -23.6 | 116.8 | 0.059 | 1 |
| B | 23.45 | 23.45 | -20.5 | 0.062 | 3 | ||
| C | 23.01 | 23.01 | -22.5 | 0.100 | 2 | ||
| D | 24.87 | 25.67 | -22.3 | 148 | 0.059 | 2 | |
| I | 22.72 | 22.72 | -23.9 | 0.200 | 2 | ||
| NEP 2560 | B | 23.41 | 23.41 | -22.9 | 0.062 | 2 | |
| NEP 2770 | A | 23.25 | 23.58 | -23.2 | 45.5 | 0.067 | 1 |
| B | 23.40 | 23.50 | -21.3 | 16.8 | 0.062 | 4 | |
| C | 22.87 | 22.87 | -23.1 | 0.111 | 1 | ||
| NEP 2870 | A | 24.66 | 25.28 | -21.6 | 119.5 | 0.059 | 4 |
| B | 23.95 | 24.20 | -23.2 | 27.6 | 0.059 | 1 | |
| NEP 2950 | B | 23.01 | 23.01 | -20.6 | 0.100 | 3 | |
| NEP 3130 | A | 25.06 | 25.19 | - 22.9 | 42.1 | 0.059 | 1 |
| B | 23.88 | 23.88 | -22.7 | 0.059 | 2 | ||
| NEP 3200 | A | 22.85 | 22.85 | -23.2 | 0.111 | 1 | |
| B | 23.55 | 23.67 | -21.0 | 18.0 | 0.059 | 3 | |
| NEP 3320 | A | 23.19 | 23.19 | -22.0 | 0.077 | 2 | |
| NEP 3450 | A | 25.11 | 25.82 | -23.2 | 181.6 | 0.059 | 1 |
| NEP 4150 | A | 22.84 | 22.84 | -20.2 | 0.111 | 3 | |
| H | 22.63 | 22.63 | -21.9 | 0.333 | 1 | ||
| I | 22.64 | 22.64 | -22.5 | 0.250 | 4 | ||
| L | 22.58 | 22.58 | -20.2 | 0.500 | 3 | ||
| NEP4̇560 | A | 23.59 | 23.69 | -22.6b | 8.7b | 0.059 | 5 |
| NEP 4610 | A | 24.12 | 24.22 | -22.7 | 17.4 | 0.059 | 1 |
| C | 23.24 | 23.24 | -23.5 | 0.071 | 2 | ||
| NEP 5281 | A | 24.17 | 24.32 | -24.4 | 21.8 | 0.059 | 1 |
| B | 24.09 | 24.09 | -24.4 | 0.059 | 1 |
-
a
1 cluster member, radio galaxy has a measured redshift; 2 assumed to be a cluster member, radio galaxy satisfies the optical magnitude criterion described in Section 5.2; 3 possible field source, radio galaxy is a possible contaminant according to the optical magnitude criterion described in Section 5.2; 4 star-like object, possible non cluster member; 5 foreground galaxy: NEP 4560 A.
-
b
The absolute red magnitude and the large linear size are calculated using the spectrcopic redshift 0.174.
| Differential | Integral | |
|---|---|---|
| Log P1.4 a | N/cluster | N/cluster |
| 22.5–23.0 | 0.856 0.431 | 2.091 0.536 |
| 23.0–23.5 | 0.578 0.250 | 1.235 0.319 |
| 23.5–24.0 | 0.125 0.089 | 0.657 0.198 |
| 24.0–25.0 | 0.177 0.072 | 0.532 0.176 |
| 25.0–26.0 | 0.089 0.051 | 0.178 0.102 |
-
a
The bin widths are different since they were chosen so as to always have at least two objects per bin. The differential RLF values have been normalized to the interval log P 0.5.
| Differential | Integral | |
|---|---|---|
| Log P1.4 a | N/cluster | N/cluster |
| 22.5–23.0 | 1.303 0.682 | 2.532 0.751 |
| 23.0–23.5 | 0.392 0.220 | 1.229 0.314 |
| 23.5–24.0 | 0.276 0.131 | 0.837 0.224 |
| 24.0–25.0 | 0.163 0.069 | 0.561 0.181 |
| 25.0–25.5 | 0.117 0.083 | 0.235 0.117 |
| 25.5–26.0 | 0.118 0.083 | 0.118 0.083 |
-
a
The bin widths are different since they were chosen so as to always have at least two objects per bin. The differential RLF values have been normalized to the interval log P 0.5.
| NEP | Ledlow & Owen | |||
|---|---|---|---|---|
| Log P1.4 | Slope | Normalization | Slope | Normalization |
| 22.5–26.0 | 0.42 0.10 | 0.450.12 | 0.24 0.04 | 0.180.02 |
| 24.8 | 0.55 0.22 | 0.500.17 | 0.10 0.05 | 0.160.04 |
Appendix A Data Analysis
A.1 Bandwidth Smearing
The use in synthesis observations of finite bandwidths produces a sort of chromatic aberration in the images consisting in a radial source smearing which worsens with increasing distance from the phase center. The uncorrected point–source response is the convolution of the unsmeared restoring beam () with a radially extended bandwidth–smearing “beam”. Bandwidth-smeared images can be treated as if obtained with a position–dependent synthesized beam () with major axis given by eq. 1 and oriented roughly at the same position angle of the source position with respect to the field center. The peak response of a point source declines while the total flux density is conserved: i.e. decreases with increasing distance from the field center. The smeared beam is still approximately gaussian and, since variances add in the convolution, its width can be estimated from the relation:
| (1) |
The net effect is a radial degradation in the resolution and sensitivity of the array. For the VLA the dependence of bandwidth smearing on the source angular distance from the phase center (), passband width , observing frequency is well approximated by the equation (Condon et al. 1998):
| (2) |
where is the attenuation () of the source peak brightness with respect to the unsmeared () source peak value.
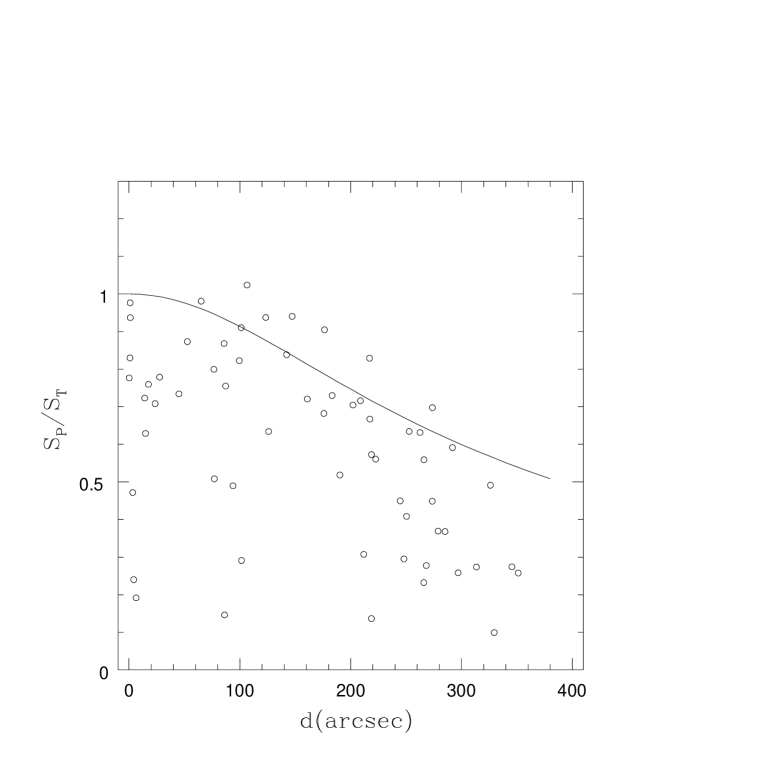
We plot in Fig. 14 the curve of eq. 2 with GHz, and MHz. The value adopted for is the average beam size (roughly round) of the experiment. The value 42 MHz was chosen since it is the best-fit effective bandwidth obtained by the NVSS survey data (Condon et al. 1998). The circles in Fig. 14 indicate the ratio as a function of the angular distance for all the sources with mJy beam-1 () within 350 arcsec from the field center. The curve describes well, within the errors, the upper envelope to the data. The curve roughly indicates the location of point-like sources, demonstrating that it is a good approximation for the peak reduction due to bandwidth smearing.
Throughout this paper, radio sources are considered point-like only when the observed major axis is similar in size and orientation to (see Section 4).
A.2 Optimization of Flux Densities
Condon et al. (1998) discuss the effects of the noise on the determination of the flux density. They demonstrate that the peak amplitude must be corrected for a general statistical bias (actually marginal for our data) caused by noise fluctuations which push the peak in the direction of the local noise increase. Then the corrected peak amplitude to use is:
| (3) |
We further correct for bandwidth smearing according to eq. 2:
| (4) |
In addition Condon (1997) and Condon et al. (1998) have shown that the optimization of the formal flux densities determined by a bidimensional Gaussian fit, depends on whether the source apparent size is significantly larger than the effective beam (see eq. 1).
For convenience of the reader we repeat below the formulae to be used. The optimum flux densities have been obtained by choosing one of the following three possibilities:
-
1.
If a source is significantly resolved in two dimensions no optimization is needed because of resolution thus the peak brightness is given simply by eq. 4, and the integrated flux density is:
-
2.
If only the major axis is significantly resolved the best estimates of the source peak amplitude and integrated flux density are:
-
3.
If neither axis is significantly resolved , the best estimate for both the peak brightness and integrated flux density is:
A.3 Errors on Source Parameters
The fractional uncertainty on source parameters can be approximated by the quadratic sum of two terms: 1) the intensity-independent calibration uncertainty, , and 2) the noise-like uncertainty, , due to the map noise. The a–priori calibration uncertainties are for flux densities and for diameters.
To estimate the noise-like error on those source parameters which are the result of two-dimensional elliptical Gaussian fits (i.e. flux density, position and size) we adopt the approach of Condon (1997) who, on the assumption of a Gaussian noise distribution, has formally derived, the appropriate expressions. Thus the total fractional errors for peak brightnesses and for the fitted major and minor axes FWHM are given by the same type of equation:
| (5) |
where is the a–priori calibration uncertainty.
Here is the image noise and the FWHM of the Gaussian correlation length of the image noise (assumed to be equal to ). The exponents are empirically determined and are equal to:
and for calculating ,
and for calculating ,
and for calculating .
The uncertainties on the optimized flux densities (Section A.2) according to Condon et al. (1998) are then given, in order, by:
-
1.
For an source:
-
2.
For an source:
-
3.
For a source:
Here and is from eq. 4. Note that we use now , instead of used Section A.1, to indicate that the integrated flux density has been optimized acccording to points 1, 2, 3 in Section A.2).
For the sources whose parameters were obtained with TVSTAT (Section 4) the noise error on the peak brightness is the image noise. The noise error on the total flux density is obtained by multiplying the image noise by the square-root of the number of independent beam areas across the source. This is a good approximation of eq. 5 when .