XMM Spectroscopy of the Transient Supersoft Source RX J0513.9-6951: probing the dynamic white dwarf photosphere
Abstract
The highly luminous ( erg s-1) supersoft X-ray sources (SSS) are believed to be Eddington limited accreting white dwarfs undergoing surface hydrogen burning. The current paradigm for SSS involves thermally unstable mass transfer from a companion. However this model has never been directly confirmed and yet is crucial for the evolution of cataclysmic variables in general, and for the establishment of SSS as progenitors of type Ia supernovae in particular. The key SSS is RX J0513.9-6951 which has recurrent X-ray outbursts every d (lasting for d) during which the optical declines by 1 mag. We present the first XMM-Newton observations of RX J0513.9-6951 through one of its optical low states. Our results show that as the optical low state progresses the temperature and the X-ray luminosity decrease, behaviour that is anti-correlated with the optical and UV emission. We find that as the optical (and UV) intensity recover the radius implied by the spectral fits increases. The high resolution spectra show evidence of deep absorption features which vary during the optical low state. Our results are consistent with the predictions of the white dwarf photospheric contraction model proposed by Southwell et al. (1996).
keywords:
binaries: close – stars: individual: RX J0513.9-6951 – Magellanic Clouds – X-rays: stars.
1 Introduction
The supersoft X-ray sources (SSS) are a class of X-ray objects discovered by the Einstein X-ray Observatory in the late 1970s (Long, Helfand & Grabelsky, 1981). During the 1990s the class of SSS has been considerably enlarged through the ROSAT All-Sky Survey (Trümper, 1992). Archetypal SSS sources include CAL 83 and CAL 87, whose defining characteristic is their extremely luminous emission (up to erg s-1) at very soft ( keV) X-ray energies. As such, the SSS are rendered undetectable in the Galactic plane due to the high level of X-ray absorption, with known sources lying predominantly in the Magellanic Clouds and M31 (see e.g. Greiner, 1996).
That the SSS are low mass X-ray binaries (LMXBs - e.g. van Paradijs & McClintock 1995) was suggested soon after their discovery by their optical spectra. Among the ROSAT discoveries are several systems which also show these hallmarks, including RX J0513.9-6951, which is the object of this paper (Cowley et al., 1993; Southwell et al., 1996, hereafter S96), and for convenience will be hereafter referred to as RXJ0513. The SSS exhibit strong emission lines of H, Heii and higher ionization species, which probably arise in a hot accretion disk or an associated wind.
Optical spectroscopic and photometric studies (e.g. Callanan et al., 1989; Smale et al., 1988) yielded some binary information, mainly orbital periods (in the range hrs), yet the nature of the compact object was not clear. “Normal” LMXBs containing neutron star or black hole accretors radiate in a wider energy range at the typical luminosities observed in the SSS. Using the observed SSS temperatures and bolometric luminosities, van den Heuvel et al. (1992, hereafter vdH92) therefore proposed that these sources in fact contain white dwarf compact objects. The near-Eddington luminosities are achieved because the white dwarf accretor is able to sustain steady nuclear burning at its surface. This requires anomalously high accretion rates (when compared, for example, to most cataclysmic variables; CVs) of yr-1. However, such rates are attainable if the donor star is comparable to or more massive than the white dwarf, so that thermally unstable mass transfer occurs (e.g. Paczyński, 1971).
The vdH92 accreting white dwarf model for the SSS still lacks convincing observational confirmation. However, circumstantial evidence in its favour was presented by S96 who showed that the observed bipolar outflow emission lines (Pakull et al., 1993; Cowley et al., 1996) in the transient SSS, RXJ0513, have velocities comparable to the escape velocity of a massive white dwarf.
RXJ0513 was discovered in the ROSAT All Sky Survey (Schaeidt et al., 1993), and the extended monitoring of the LMC showed its unique characteristic, namely a very large variability which made it a type of transient. The observations showed that the source brightness increased by a factor of during a period of 10 days. Schaeidt et al. (1993) found that the PSPC spectrum was well-fitted by a blackbody of temperature eV, with a column density of cm-2 and bolometric X-ray luminosity of ergs s-1.
A key breakthrough in our understanding of the SSS came about through the MACHO project (Alcock et al., 1995) survey of a field in the LMC that contained RXJ0513. This led to the production by S96 of an exceptional 3.5 year lightcurve of the optical counterpart which revealed recurrent low states (dropping by mag) at quasi-regular intervals (every days) and remaining low for days. More importantly, the ROSAT X-ray detections are only reported during such (optical) low states, while no outbursts have been observed during the extensive optical high states. This showed that the X-ray and optical states are anti-correlated. Furthermore, analysis of the high state optical data revealed a low amplitude modulation at a period of 18.3 hrs which S96 interpret as the orbital period of RXJ0513.
The remarkable behaviour observed in RXJ0513 is very difficult to reconcile with a regular thermonuclear flash model which is normally accompanied by radius expansion and an increased optical luminosity. Instead S96 proposed a contraction of the white dwarf from an expanded, Eddington-limited state to a steady shell-burning phase as a cause for the X-ray outburst. This is consistent with all the available data, and an X-ray phase due to contraction of the envelope during shell-burning has been established observationally for GQ Mus (Ögelman et al., 1993).
But what is the cause of such contractions? S96 proposed that this could be due to a decrease in the otherwise very high accretion rate, which would also account for the simultaneous optical low states. This then draws an analogy for RXJ0513 with the VY Scl class of CVs in that they experience downward transitions from an otherwise normal on state (Honeycutt & Kafka, 2004). Of course, the shell luminosity will be even higher in the optically bright state, but the system is then close to the top of the steady burning strip in the plane (Nomoto, 1982) which means the white dwarf is inflated (perhaps by a factor 3 in radius; Kovetz & Prialnik, 1994). Hence most of the shell luminosity would then be emitted in the UV or EUV. This leads to the prediction that, if this model is correct, as the X-ray outburst evolves it will end with its peak emission (or temperature) shifting into the EUV and UV.
We present here the first XMM-Newton observations of RXJ0513 through one of its optical low states. XMM-Newton is ideal for this study because, via its onboard Optical Monitor, we automatically obtain simultaneous UV photometry. We use these data to examine the validity of the vdH92 paradigm for SSS via the prediction of S96 for the X-ray turn-on and turn-off. If we can confirm directly the vdH92 paradigm for SSS then this will also establish them as one of the strong candidates for the progenitors of type Ia supernovae (see e.g. Livio, 1996).
2 Observations and Data Reduction
2.1 Optical Monitoring
We were granted ToO status for observations of RXJ0513 as part of the cycle 2 of XMM-Newton. When the source started its mag drop in the optical we would trigger our XMM-Newton observations. To enable this we set-up a ground based optical monitoring campaign. From 2002 December 5 (MJD 24520613.5) to 2004 June 11 (MJD 2453167.5) we obtained -band and unfiltered observations of RXJ0513 from SAAO (Sutherland, South Africa), CTIO (La Serena, Chile), and Barfold Observatory (Victoria, Australia). Table 1 gives the observing log. Aperture photometry was performed on all of the observations using custom packages. The magnitude of the source was determined using the magnitude of a comparison star (; star 2; Cowley et al. 1993). The optical light curve of RXJ0513 is shown in Figure 1.
| Date | MJD | Filter | Exp | Telescope | Date | MJD | Filter | Exp | Telescope |
|---|---|---|---|---|---|---|---|---|---|
| +2450000 | (s) | +2450000 | (s) | ||||||
| 2002-12-05 | 2613.7858 | 30 | SAAO 1.9 m | 2003-03-17 | 2715.9919 | 180 | CTIO 1.3 m | ||
| 2002-12-07 | 2615.0842 | 30 | SAAO 1.9 m | 2003-03-18 | 2716.9884 | 180 | CTIO 1.3 m | ||
| 2002-12-08 | 2616.0659 | 30 | SAAO 1.9 m | 2003-03-19 | 2717.9898 | 180 | CTIO 1.3 m | ||
| 2002-12-08 | 2616.7776 | 60 | SAAO 1.9 m | 2003-03-21 | 2719.0053 | 180 | CTIO 1.3 m | ||
| 2002-12-12 | 2620.8108 | 30 | SAAO 1.9 m | 2003-03-22 | 2720.5384 | 1800 | Barfold 14 in | ||
| 2002-12-12 | 2620.8119 | 60 | SAAO 1.9 m | 2003-03-23 | 2721.9937 | 180 | CTIO 1.3 m | ||
| 2002-12-13 | 2621.9557 | 30 | SAAO 1.9 m | 2003-03-24 | 2722.9926 | 180 | CTIO 1.3 m | ||
| 2002-12-13 | 2621.9563 | 60 | SAAO 1.9 m | 2003-03-25 | 2723.9901 | 180 | CTIO 1.3 m | ||
| 2002-12-14 | 2622.9846 | 30 | SAAO 1.9 m | 2003-03-26 | 2724.5630 | 1260 | Barfold 14 in | ||
| 2002-12-14 | 2622.9856 | 30 | SAAO 1.9 m | 2003-03-26 | 2724.9917 | 180 | CTIO 1.3 m | ||
| 2002-12-16 | 2624.0331 | 30 | SAAO 1.9 m | 2003-03-29 | 2727.4295 | 1800 | Barfold 14 in | ||
| 2002-12-16 | 2624.0343 | 30 | SAAO 1.9 m | 2003-03-27 | 2725.9853 | 180 | CTIO 1.3 m | ||
| 2003-02-04 | 2674.0530 | 180 | CTIO 1.3 m | 2003-03-29 | 2727.9840 | 180 | CTIO 1.3 m | ||
| 2003-02-05 | 2675.0242 | 180 | CTIO 1.3 m | 2003-03-30 | 2728.9740 | 180 | CTIO 1.3 m | ||
| 2003-02-06 | 2676.0441 | 180 | CTIO 1.3 m | 2003-03-31 | 2729.9751 | 180 | CTIO 1.3 m | ||
| 2003-02-06 | 2676.0674 | 180 | CTIO 1.3 m | 2003-04-01 | 2730.9747 | 180 | CTIO 1.3 m | ||
| 2003-02-07 | 2677.0340 | 180 | CTIO 1.3 m | 2003-04-02 | 2731.9723 | 180 | CTIO 1.3 m | ||
| 2003-02-07 | 2677.0832 | 180 | CTIO 1.3 m | 2003-04-03 | 2732.4571 | 1710 | Barfold 14 in | ||
| 2003-02-08 | 2678.0512 | 180 | CTIO 1.3 m | 2003-04-03 | 2732.9890 | 180 | CTIO 1.3 m | ||
| 2003-02-09 | 2679.0976 | 180 | CTIO 1.3 m | 2003-04-04 | 2733.9926 | 180 | CTIO 1.3 m | ||
| 2003-02-10 | 2680.0597 | 180 | CTIO 1.3 m | 2003-04-05 | 2734.9817 | 180 | CTIO 1.3 m | ||
| 2003-02-11 | 2681.0393 | 180 | CTIO 1.3 m | 2003-04-06 | 2735.9820 | 180 | CTIO 1.3 m | ||
| 2003-02-11 | 2681.5979 | 1800 | Barfold 14 in | 2003-04-10 | 2739.0329 | 180 | CTIO 1.3 m | ||
| 2003-02-12 | 2682.0321 | 180 | CTIO 1.3 m | 2003-04-10 | 2739.4765 | 1440 | Barfold 14 in | ||
| 2003-02-13 | 2683.0222 | 180 | CTIO 1.3 m | 2003-04-13 | 2742.9679 | 180 | CTIO 1.3 m | ||
| 2003-02-14 | 2684.0219 | 180 | CTIO 1.3 m | 2003-04-15 | 2744.4947 | 2340 | Barfold 14 in | ||
| 2003-02-14 | 2684.0281 | 180 | CTIO 1.3 m | 2003-04-19 | 2748.9734 | 180 | CTIO 1.3 m | ||
| 2003-02-16 | 2686.0188 | 180 | CTIO 1.3 m | 2003-04-19 | 2748.4462 | 1710 | Barfold 14 in | ||
| 2003-02-17 | 2687.0335 | 180 | CTIO 1.3 m | 2003-04-21 | 2750.9637 | 180 | CTIO 1.3 m | ||
| 2003-02-18 | 2688.0150 | 180 | CTIO 1.3 m | 2003-04-22 | 2751.4350 | 1800 | Barfold 14 in | ||
| 2003-02-19 | 2689.0135 | 180 | CTIO 1.3 m | 2003-04-24 | 2753.9578 | 180 | CTIO 1.3 m | ||
| 2003-02-20 | 2690.0238 | 180 | CTIO 1.3 m | 2003-04-26 | 2755.4181 | 1620 | Barfold 14 in | ||
| 2003-02-21 | 2691.0178 | 180 | CTIO 1.3 m | 2003-04-27 | 2756.9564 | 180 | CTIO 1.3 m | ||
| 2003-02-22 | 2692.0747 | 180 | CTIO 1.3 m | 2003-04-29 | 2758.4204 | 1800 | Barfold 14 in | ||
| 2003-02-22 | 2692.6165 | 1800 | Barfold 14 in | 2003-05-01 | 2760.9718 | 180 | CTIO 1.3 m | ||
| 2003-02-23 | 2693.0175 | 180 | CTIO 1.3 m | 2003-05-02 | 2761.9844 | 180 | CTIO 1.3 m | ||
| 2003-02-24 | 2694.0247 | 180 | CTIO 1.3 m | 2003-05-05 | 2764.4242 | 1800 | Barfold 14 in | ||
| 2003-02-25 | 2695.0212 | 180 | CTIO 1.3 m | 2003-05-03 | 2762.9541 | 180 | CTIO 1.3 m | ||
| 2003-02-25 | 2695.4986 | 1800 | Barfold 14 in | 2003-05-07 | 2766.9501 | 180 | CTIO 1.3 m | ||
| 2003-02-26 | 2696.0158 | 180 | CTIO 1.3 m | 2003-05-10 | 2769.4898 | 1440 | Barfold 14 in | ||
| 2003-02-27 | 2697.0121 | 180 | CTIO 1.3 m | 2003-05-13 | 2772.9565 | 180 | CTIO 1.3 m | ||
| 2003-02-28 | 2698.0524 | 180 | CTIO 1.3 m | 2003-05-14 | 2773.9495 | 180 | CTIO 1.3 m | ||
| 2003-03-01 | 2699.0354 | 180 | CTIO 1.3 m | 2003-05-15 | 2774.9516 | 180 | CTIO 1.3 m | ||
| 2003-03-01 | 2699.3983 | 180 | CTIO 1.3 m | 2003-05-16 | 2775.9548 | 180 | CTIO 1.3 m | ||
| 2003-03-03 | 2701.0018 | 180 | CTIO 1.3 m | 2003-05-17 | 2776.9572 | 180 | CTIO 1.3 m | ||
| 2003-03-04 | 2702.0000 | 180 | CTIO 1.3 m | 2003-05-18 | 2777.9529 | 180 | CTIO 1.3 m | ||
| 2003-03-04 | 2702.9992 | 180 | CTIO 1.3 m | 2003-05-21 | 2780.4894 | 1980 | Barfold 14 in | ||
| 2003-03-05 | 2703.5417 | 1890 | Barfold 14 in | 2003-05-23 | 2782.4390 | 1620 | Barfold 14 in | ||
| 2003-03-06 | 2704.0338 | 180 | CTIO 1.3 m | 2003-05-23 | 2782.9485 | 180 | CTIO 1.3 m | ||
| 2003-03-07 | 2705.0100 | 180 | CTIO 1.3 m | 2003-05-25 | 2784.9439 | 180 | CTIO 1.3 m | ||
| 2003-03-08 | 2706.0070 | 180 | CTIO 1.3 m | 2003-05-27 | 2786.5102 | 1800 | Barfold 14 in | ||
| 2003-03-09 | 2707.0093 | 180 | CTIO 1.3 m | 2003-05-30 | 2789.4389 | 1800 | Barfold 14 in | ||
| 2003-03-10 | 2708.0049 | 180 | CTIO 1.3 m | 2003-10-18 | 2930.5964 | 789 | Barfold 14 in | ||
| 2003-03-11 | 2709.0045 | 180 | CTIO 1.3 m | 2003-10-26 | 2938.6884 | 900 | Barfold 14 in | ||
| 2003-03-11 | 2709.4714 | 1890 | Barfold 14 in | 2003-11-03 | 2946.6754 | 900 | Barfold 14 in | ||
| 2003-03-12 | 2710.0174 | 180 | CTIO 1.3 m | 2003-11-08 | 2951.6811 | 450 | Barfold 14 in | ||
| 2003-03-13 | 2711.0027 | 180 | CTIO 1.3 m | 2003-12-01 | 2974.6263 | 1800 | Barfold 14 in | ||
| 2003-03-14 | 2712.0351 | 180 | CTIO 1.3 m | 2003-12-06 | 2979.5504 | 1710 | Barfold 14 in | ||
| 2003-03-14 | 2712.9966 | 180 | CTIO 1.3 m | 2003-12-11 | 2984.7006 | 135 | Barfold 14 in | ||
| 2003-03-16 | 2714.9882 | 180 | CTIO 1.3 m | 2003-12-13 | 2986.6378 | 900 | Barfold 14 in |
The SAAO observations were taken using the 1.9 m telescope with the WRT1 CCD. The CTIO observations were taken using the 1.3 m telescope with the ANDICAM-CCD and Fairchild 447 detector. The Barfold observations were made using the 14 inch @f/6.0 telescope with the Audine 401E instrument.
| Date | MJD | Filter | Exp | Telescope | Date | MJD | Filter | Exp | Telescope |
|---|---|---|---|---|---|---|---|---|---|
| +2450000 | (s) | +2450000 | (s) | ||||||
| 2003-12-16 | 2989.5318 | 1440 | Barfold 14 in | 2004-03-23 | 3087.5751 | 900 | Barfold 14 in | ||
| 2003-12-23 | 2996.4976 | 1350 | Barfold 14 in | 2004-04-16 | 3111.4529 | 900 | Barfold 14 in | ||
| 2003-12-26 | 2999.3870 | 1350 | Barfold 14 in | 2004-04-21 | 3116.6381 | 1350 | Barfold 14 in | ||
| 2004-01-08 | 3012.6388 | 900 | Barfold 14 in | 2004-04-22 | 3117.4213 | 900 | Barfold 14 in | ||
| 2004-01-14 | 3018.6219 | 900 | Barfold 14 in | 2004-04-28 | 3123.4436 | 900 | Barfold 14 in | ||
| 2004-01-17 | 3021.6854 | 810 | Barfold 14 in | 2004-05-01 | 3126.4854 | 900 | Barfold 14 in | ||
| 2004-01-28 | 3032.6385 | 1350 | Barfold 14 in | 2004-05-08 | 3133.4803 | 900 | Barfold 14 in | ||
| 2004-01-31 | 3035.6304 | 900 | Barfold 14 in | 2004-05-12 | 3137.3798 | 900 | Barfold 14 in | ||
| 2004-02-04 | 3039.6714 | 900 | Barfold 14 in | 2004-05-18 | 3143.5267 | 540 | Barfold 14 in | ||
| 2004-02-12 | 3047.5078 | 720 | Barfold 14 in | 2004-05-22 | 3147.4069 | 900 | Barfold 14 in | ||
| 2004-02-19 | 3054.5051 | 900 | Barfold 14 in | 2004-05-29 | 3154.4243 | 900 | Barfold 14 in | ||
| 2004-02-24 | 3059.5149 | 990 | Barfold 14 in | 2004-05-31 | 3156.4304 | 540 | Barfold 14 in | ||
| 2004-03-02 | 3066.4980 | 900 | Barfold 14 in | 2004-06-08 | 3164.4391 | 900 | Barfold 14 in | ||
| 2004-03-14 | 3078.4583 | 900 | Barfold 14 in | 2004-06-11 | 3167.5289 | 630 | Barfold 14 in | ||
| 2004-03-18 | 3082.5838 | 900 | Barfold 14 in |
On MJD 2452692 RXJ0513 faded by mag, but by the following day it had re-brightened to its “steady level”. A few days later it experienced another drop in brightness, mag, which lasted for days. This less pronounced reduction in brightness can be seen in earlier lightcurves of RXJ0513 (S96), and since the source did not dim by mag we did not trigger our XMM-Newton over-ride. A characteristic mag drop in brightness did subsequently occur around MJD 2452980, however we were unable to trigger our observations due to operational restrictions at the XMM-Newton Science Operations Centre prevailing at that time. Fortunately, RXJ0513 faded again by mag on 2004 April 22, and after confirming this drop over several subsequent nights, we were able to initiate our ToO on April 26. The first XMM-Newton observation occurred on 2004 April 28, followed by eight more observations, with the last being taken on 2004 May 28. The X-ray observation log is given in Table 3. The times of the start of each X-ray observation are marked in Figure 1.
| Observation | Date | MJD | Instrument | Exp |
|---|---|---|---|---|
| +2450000 | (s) | |||
| 0151410101 | 2004-04-28 | 3123.7452 | MOS1 | 0 |
| 2004-04-28 | 3123.7452 | MOS2 | 0 | |
| 2004-04-28 | 3123.7579 | PN | 0 | |
| 0151412101 | 2004-05-02 | 3127.0789 | MOS1 | 10490 |
| 2004-05-02 | 3127.0789 | MOS2 | 10562 | |
| 2004-05-02 | 3127.0784 | RGS1 | 16885 | |
| 2004-05-02 | 3127.0784 | RGS2 | 16880 | |
| 2004-05-02 | 3127.0815 | OM | 2729 | |
| 2004-05-02 | 3127.1468 | OM | 2729 | |
| 0151412201 | 2004-05-05 | 3130.8146 | MOS1 | 13865 |
| 2004-05-05 | 3130.8146 | MOS2 | 14237 | |
| 2004-05-05 | 3130.8274 | PN | 14008 | |
| 2004-05-05 | 3130.8141 | RGS1 | 17885 | |
| 2004-05-05 | 3130.8141 | RGS2 | 17880 | |
| 2004-05-05 | 3130.8173 | OM | 5000 | |
| 2004-05-05 | 3130.9088 | OM | 3497 | |
| 0151412301 | 2004-05-09 | 3134.9117 | MOS1 | 16720 |
| 2004-05-09 | 3134.9117 | MOS2 | 16897 | |
| 2004-05-09 | 3134.9453 | PN | 14049 | |
| 2004-05-09 | 3134.9111 | RGS1 | 17785 | |
| 2004-05-09 | 3134.9112 | RGS2 | 17780 | |
| 2004-05-09 | 3134.9144 | OM | 5000 | |
| 2004-05-10 | 3135.0267 | OM | 3397 | |
| 0151412401 | 2004-05-12 | 3137.6860 | MOS1 | 6231 |
| 2004-05-12 | 3137.6860 | MOS2 | 6443 | |
| 2004-05-12 | 3137.6987 | PN | 5378 | |
| 2004-05-12 | 3137.6855 | RGS1 | 25685 | |
| 2004-05-12 | 3137.6855 | RGS2 | 25680 | |
| 2004-05-12 | 3137.6887 | OM | 3888 | |
| 2004-05-12 | 3137.7673 | OM | 3397 | |
| 2004-05-12 | 3137.8403 | OM | 3397 | |
| 2004-05-12 | 3137.9133 | OM | 3397 | |
| 0151412501 | 2004-05-16 | 3141.0642 | MOS1 | 13266 |
| 2004-05-16 | 3141.0642 | MOS2 | 13287 | |
| 2004-05-16 | 3141.0769 | PN | 12192 | |
| 2004-05-16 | 3141.0636 | RGS1 | 13885 | |
| 2004-05-16 | 3141.0637 | RGS2 | 13880 | |
| 2004-05-16 | 3141.0669 | OM | 5000 | |
| 2004-05-16 | 3141.1584 | OM | 3097 | |
| 0151412601 | 2004-05-18 | 3143.3513 | MOS1 | 11882 |
| 2004-05-18 | 3143.3513 | MOS2 | 12043 | |
| 2004-05-18 | 3143.3641 | PN | 10958 | |
| 2004-05-18 | 3143.3508 | RGS1 | 13885 | |
| 2004-05-18 | 3143.3508 | RGS2 | 13880 | |
| 2004-05-18 | 3143.3540 | OM | 3819 | |
| 2004-05-18 | 3143.4319 | OM | 4278 | |
| 0151412701 | 2004-05-26 | 3151.2400 | MOS1 | 17175 |
| 2004-05-26 | 3151.2401 | MOS2 | 17304 | |
| 2004-05-26 | 3151.2528 | PN | 16174 | |
| 2004-05-26 | 3151.2395 | RGS1 | 18085 | |
| 2004-05-26 | 3151.2395 | RGS2 | 18080 | |
| 2004-05-26 | 3151.2427 | OM | 2819 | |
| 2004-05-26 | 3151.3090 | OM | 3278 | |
| 2004-05-26 | 3151.3806 | OM | 3278 | |
| 0151412801 | 2004-05-28 | 3153.2732 | MOS1 | 15252 |
| 2004-05-28 | 3153.2732 | MOS2 | 15278 | |
| 2004-05-28 | 3153.2860 | PN | 14141 | |
| 2004-05-28 | 3153.2727 | RGS1 | 15885 | |
| 2004-05-28 | 3153.2727 | RGS2 | 15880 | |
| 2004-05-28 | 3153.2759 | OM | 3094 | |
| 2004-05-28 | 3153.3454 | OM | 3094 | |
| 2004-05-28 | 3153.4149 | OM | 1000 |
2.2 XMM-Newton Observations
The OM (Mason et al., 2001) was operated in Rudi-5 imaging mode during our observations using the filter ( nm). We processed the OM images using the omichain routine under the XMM-Newton Science Analysis System (SAS) v6.0.0. The photometry was performed with omsource using a radius aperture. Background subtraction was done using counts extracted from an aperture of offset from the source, and deadtime and coincidence loss corrections were applied to the count rates.
The EPIC-MOS (Turner et al., 2001) and EPIC-PN (Strüder et al., 2001) instruments were operated in timing mode, with the thin filter. We reduced the EPIC data with SAS v6.1.0. The data were filtered to exclude times of high background. The first observation (ID 0151410101) was affected by high radiation and yielded no useful data. The remaining observations were filtered on pattern and energy. Since the data were taken in timing mode we filtered the data to include only single photon events for the MOS, and only single and double photon events for the PN. Only photons with energies in the range keV were included. The data have been filtered to exclude events that may have incorrect energies, for example those next to the edges of the CCDs and next to bad pixels. We note that there are no PN data for the second observation (ID 0151412101). The exposure times given in Table 3 reflect the filtering that was performed and provide the duration of good data.
For each EPIC instrument a spectrum for the source was extracted over the RAW-X direction, and a region of similar size offset from the source position was used to extract a corresponding background spectrum. We used an extraction region of pixels which should encompass 100% of the flux, however, this is uncalibrated. In each case we created a photon redistribution matrix (RMF) and ancillary region file (ARF). The spectra were regrouped by requiring at least 30 counts per spectral bin. The subsequent spectral fitting and analysis was performed using XSPEC, version 11.3.1. We extracted source and background light curves from the filtered event files, which had been barycentrically corrected, using the same regions.
The RGS (den Herder et al., 2001) spectra were extracted with rgsproc under SAS v6.1.0. Background subtraction was performed with the SAS using regions adjacent to that containing the source. Since SAS v6.1.0 automatically corrects the response matrices for effective area differences between RGS1 and RGS2, it was possible to combine the spectra, including both first and second order data, channel by channel for each observation using the method described by Page et al. (2003). The resulting combined RGS spectrum for each observation was analysed in SPEX 2.00 (Kaastra et al., 2002).

3 UV and Optical lightcurves
We show in Figure 2 the OM lightcurve of RXJ0513 with the contemporaneous optical data points obtained by Barfold Observatory. The UV intensity is roughly constant at the start of the observations (MJD ). By MJD 2453137 the UV flux had started to increase, this brightening continued during the remaining observations. By comparing the start of the rise in the UV intensity to the rise in the optical we can see that the UV leads the optical. The lightcurves indicate that the UV increase in brightness is more gradual than that in the optical.
We have also plotted the EPIC PN flux in the keV band (see Section 5). The overall trend for the X-rays during our observing period is a reduction in the X-ray flux. There is however a drop in X-ray flux at MJD 2453137 which coincides with the start of the rise in the UV flux. The X-ray flux increases after this date, but then continues decreasing. The fourth panel in Figure 2 shows the hardness ratio, which is seen to decrease as the UV and optical intensity increases, see Section 4 for more details.
4 X-ray lightcurves and hardness ratios
Initial inspection of the X-ray spectra indicates that there is little emission at energies keV. We therefore extracted source and background light curves from the PN data in the energy ranges , and keV. We binned the lightcurves into 300 s bins. We define the hardness ratio for our data as keV. The light curves in the different energy bands and the hardness ratios for each observation are shown in Figure 3.
The X-ray flux is variable over the course of the observations. Prominent X-ray dips occur in several observations. As the UV and optical brightness start to recover ( MJD 2453150) the X-ray flux and hardness ratio decrease (see Figure 2, fourth panel). The dynamical range of the variations in the hardness ratio is smaller than the long-term evolution of the hardness ratio e.g. in the second sequence of data in Figure 3 (Observation ID 0151412301) two dips occur separated by hr.


5 Low resolution X-ray Spectroscopy
For the spectral analysis we have only used the higher signal-to-noise PN data. Since no substantial emission is detected at energies keV we extracted the PN spectrum over keV for each observation. In each case we fitted the PN spectra with a blackbody model modified by neutral photoelectric absorption.
The initial fits to each spectrum where we allowed the equivalent hydrogen column density and the temperature to be free resulted in values for and which were poorly constrained, as expected for such low values. We modelled all the PN spectra simultaneously and found cm-2 and eV. This value for the equivalent hydrogen column density is consistent with the average Galactic absorption in this direction111http://heasarc.gsfc.nasa.gov/ftools/ (Blackburn, 1995), cm-2, and the value inferred by Gaensicke et al. (1998) from HST data, cm-2. We therefore repeated the fits to the individual PN spectra, fixing the column density at the value found from fitting all of the PN spectra simultaneously.
We find that the blackbody model does not fit the spectra well (typically ), implying that a more sophisticated model is required to describe the X-ray emission from RXJ0513. At higher energies the spectra are dominated by noise and not by real spectral features. We show in Figure 4 the PN spectra in chronological order. The last two spectra show apparent broad absorption features just below 0.5 keV. We tried adding one or more absorption edges to the fit (at the observed energy they could originate from C v and/or C vi); an edge model was unable to reproduce the form of the features. The profile of the absorption is too well defined to be explained by an edge, at the spectral resolution of the PN, and is thus more indicative of discrete line absorption (see Section 6).
While the blackbody model is a poor fit to the spectra, we can however investigate the evolution of the spectra by treating the values obtained as representative of the gross spectral properties. In Table 4 we show the results of the fits to the PN spectra. We find that the temperature varies between eV, and the blackbody luminosity between erg s-1. These values are consistent with those found by Schaeidt et al. (1993) from the ROSAT data, as is the value for . We show in Figure 5 the evolution of , blackbody luminosity, white dwarf radius and X-ray luminosity in the keV band, during our observations.


As the source starts to emerge from the optical low state we see that the temperature and X-ray luminosity both decrease. This is anti-correlated with the optical and UV emission.
| MJD | ||||||||
|---|---|---|---|---|---|---|---|---|
| +2450000 | eV | erg s-1 | cm | erg cm-2 s-1 | erg cm-2 s-1 | erg s-1 | erg s-1 | |
| 3130.8274 | 6.6 | |||||||
| 3134.9453 | 8.7 | |||||||
| 3137.6987 | 1.9 | |||||||
| 3141.0769 | 5.8 | |||||||
| 3143.3641 | 4.1 | |||||||
| 3151.2528 | 5.2 | |||||||
| 3153.2860 | 3.2 |
The value of is fixed at cm-2 for all of the fits. is the blackbody luminosity and is the radius of the white dwarf. and are the X-ray fluxes in the (a) keV and (b) keV energy ranges, respectively. and are the X-ray luminosities in the (a) keV and (b) keV energy ranges, respectively. The errors quoted are at the 90% confidence level.
6 High resolution X-ray Spectroscopy
RGS spectra were available for eight observations. All of these spectra, which are of very high statistical quality, show evidence of deep absorption features and probably some low significance narrow emission lines. A plot of all eight spectra is given in Figure 6.

The absorption lines can be identified with transitions from a range of high-ionization ions, including C vi, S xii, S xiii, S xiv, Ar xiii, Ar xiv, N vi and N vii, and possibly O vii at 21.6 Å. Figure 7 shows three individual features plotted in velocity space: C vi Ly at 33.736 Å, Ar xiii/Ar xiv at 27.463 Å (blended at the spectral resolution of the RGS), and S xiv at 30.441 Å. It is clear from this plot that the lines are blue-shifted and that there are two or more velocity components; the outflow velocity along our line of sight is anywhere between zero and km s-1.
Figure 7 also indicates that the optical depth of the absorbers increases over the course of the eight observations. This is seen most clearly in the case of C vi Ly, which is barely present in the first spectrum, deepens significantly and becomes heavily saturated by the time that the final data were taken. The velocity structure of the medium is best indicated by the S xiv and Ar xiii/Ar xiv features; although there are some apparent changes over the course of the observations, there appear to be two main velocity components at km s-1 and km s-1 respectively. The outflow velocities have not been corrected for the systematic velocity of the LMC of 280 km s-1 (c.f. Hutchings et al., 2002).

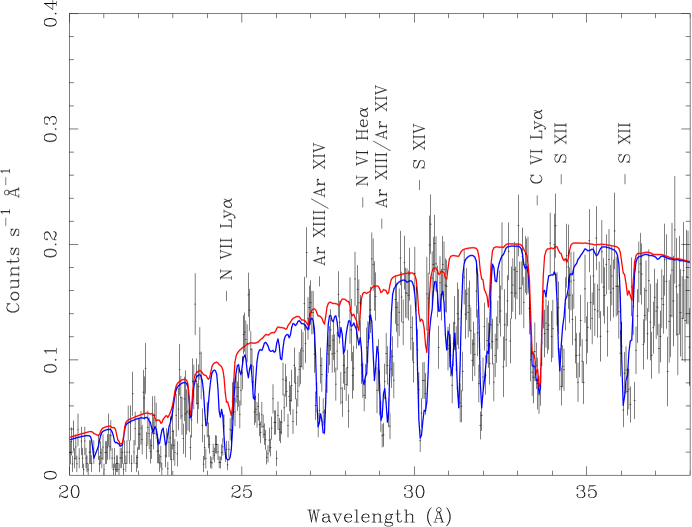
Figure 8 shows a comparison of the fifth RGS spectrum (MJD 2453141.5636) with a simple photoionized absorption model to highlight the positions of the major features. The model continuum was chosen to represent the overall shape of the first RGS spectrum (MJD 2453127.0784), which has the least amount of intrinsic ionized absorption and therefore the most bare continuum visible. The model continuum consists of a Compton-scattered blackbody at a temperature of 70 eV, with Galactic neutral absorption at the average column derived from the fits to the PN data ( cm-2). The intrinsic ionized absorption is represented using the xabs photoionized absorption model in SPEX 2.00 (Kaastra et al., 2002), which is based on Xstar (Kallman & McCray, 1982) output and applies absorption by a column of gas at a given ionization parameter and specified (variable) elemental abundances. The ionization parameter is defined here as :
| (1) |
where is the source luminosity (in erg s-1) in the 13.6 eV13.6 keV range (i.e. the entire photoionizing continuum), the gas density (in cm-3) and the source distance in cm, so has units of erg cm s-1 (Tarter et al., 1969).
The columns of the absorption phases were estimated by matching the depth of the modelled C vi Ly feature at 33.736 Å (rest wavelength) with the corresponding feature in the data, assuming that carbon is at a Solar abundance in the absorbing gas. A gas turbulent velocity of 200 km s-1 was chosen (which is below the velocity resolution of the RGS; the velocity width of the lines is difficult to establish due to the presence of heavily blended features at a range of outflow velocities). The dot-dash line in Figure 8 (red in online version) shows the model with all elements at Solar abundances. Clearly, the depths of the observed features require far higher relative abundances of at least N, S and Ar, and the solid line (blue in online version) shows the model with abundances of these elements enhanced so that the depths of the relevant features are reproduced. The spectrum tails off in the region where oxygen absorption is expected, and so it was not possible to gain a useful estimate of the relative abundance of oxygen.
The outflow velocities were set from the observed wavelength distributions of the C vi Ly and S xiv (30.441 Å) features. Ionization parameters of the three phases were then estimated by matching the patterns of S absorption in the model phases to those in the data (note that the ionization balance of the model was calculated assuming a soft excess AGN SED, which is a rather harder spectrum than is strictly appropriate for this source). Table 4 gives the absorbing columns, ionization parameters and abundances relative to Solar of C, N, S and Ar of the final model. We emphasize that this model has not been formally fitted to the data, and is presented for comparison purposes.
| Phase | log | vblue | |||||
|---|---|---|---|---|---|---|---|
| 1 | 10 | 2.6 | 800 | 1 | 1 | 2 | 80 |
| 2 | 2 | 2.4 | 1800 | 1 | 20 | 4 | 10 |
| 3 | 4 | 2.6 | 2800 | 1 | 80 | 30 | 90 |
We note that the columns required to reproduce the deep absorption features are one to two orders of magnitude higher than the neutral absorption column fitted to the PN spectra, which was consistent with the Galactic absorption in the direction of RXJ0513. This is unsurprising since the very highly-ionized gas giving rise to the intrinsic absorption features requires much higher columns than neutral material in order to leave a spectral signature, and, at least in the earliest RGS observations, discrete spectral line absorption dominates over continuum (edge) absorption. By the time the final observations were taken, however, the deep absorption features visible even at the PN spectral resolution are an indication that the intrinsic ionized absorption column has become much deeper.
It is possible that the apparent highly anomalous abundances of N, S and Ar are the result of partial covering; if the covering factors of the phases are less than unity, but the major absorption lines are saturated, increasing the intrinsic column makes low-abundance ions appear unexpectedly prominent (e.g. Arav et al., 2002). If the relative elemental abundances in the ionized outflows in RXJ0513 really are factors of several above Solar values, this may imply that the outflows contain the products of hot CNO burning. As stated above, it would be difficult to get an estimate of the oxygen abundance from this very soft spectrum due to lack of continuum in the relevant spectral region. However, at least some of our very rough estimates of the relative abundances of C and N do seem to be in line with the prediction (e.g. Lanz et al., 2005) that carbon should be highly depleted with respect to nitrogen in the atmosphere of a supersoft source. The prediction that the He/H abundance ratio should be enhanced in winds or outflows from white dwarfs is not possible to test with this dataset since no spectral features from these two elements are present in the RGS wavelength range, and in any case, they are fully stripped at the ionization levels implied by the observed transitions.
Comparing the models with the observed spectrum in Figure 8, it is clear that a simple photoionized absorption model is not an adequate representation of the data; this is unsurprising since the assumption of absorption from the ground state would not be valid in a high density medium such as a white dwarf atmosphere. It is also very likely that atomic data are missing or perhaps inaccurate in the current model for various features in the spectrum; identification of ionic species is further complicated by the likelihood that the observed features consist of complicated blends of many different transitions. Two of the greatest discrepancies are in the ranges Å and Å which correspond to the positions of the C vi and C v absorption edges respectively.
Approximating the underlying continuum as a blackbody spectrum is probably still too simplistic; the continuum and intrinsic absorption will need to be modelled self-consistently in order to reach a more accurate understanding of both. Lanz et al. (2005) have shown that a white dwarf atmosphere model is a good representation of the soft X-ray spectrum of the supersoft source CAL 83, although they found no evidence for a high-speed outflow in that source. A white dwarf atmosphere model with the addition of winds and outflows may indeed be required to reproduce the RGS spectra of RXJ0513. Nevertheless, the present model demonstrates clearly that much of the soft X-ray spectral complexity of RXJ0513 is consistent with the presence of highly ionized outflowing gas, and detailed modelling is currently underway (Blustin et al., in preparation).
It is interesting to ask whether the ionized absorber model can provide any insights into the nature of the spectral evolution observed in the soft X-ray band as RXJ0513 comes out of its optical low state. Further work will be required to provide a more certain answer to this, although preliminary investigations indicate that much of the variation seen in the RGS spectra can be explained by changing absorption columns, with the highest columns in the last two spectra. The ionization levels, range of outflow velocities and elemental abundances appear to be broadly similar throughout the series of observations.
7 Discussion
The white dwarf photosphere contraction model proposed by S96 is based on the prediction that the rise in the X-rays occurs after the drop in optical luminosity. From the vdH92 model, during the optical bright state the accretion rate is very high ( yr-1). Under these conditions, the white dwarf is slightly inflated, and a large majority of the shell luminosity is likely emitted in the UV. As the accretion rate drops, leading to a reduction in the optical flux, the photosphere contracts slightly (e.g. Kovetz & Prialnik, 1994; Kato, 1985), this raises the effective temperature and hence produces an increase in the X-ray luminosity.
We do not have X-ray observations before the drop, however, previous observations have shown that X-rays are not detected when the source is in its optical high state. Our observations confirm that while RXJ0513 is in its optical low state we see the source in X-rays.
The behaviour of the UV and optical intensity is roughly correlated in the optical low state. However, the UV flux starts to rise before the optical luminosity increases. We find that as the optical low state progresses the X-ray flux decreases, this is anti-correlated with the optical and UV. This implies that as the X-ray outburst is evolving the peak of the emission has moved into the UV, confirming the prediction of the contraction model.
Although our blackbody fits to the PN spectra are poor, the values implied by the fits are indicative of the global evolution of the X-ray emission. We find that the temperature and luminosity decrease during the optical low state. The radius determined from the fits decreases during the first observations. As the optical (and UV) intensity recover the radius increases. In the context of the contraction model (e.g. Reinsch et al., 2000; Hachisu & Kato, 2003a, b), the enhanced X-ray flux will irradiate the companion star and, either by inflating material above the secondary’s photosphere and causing it to be transferred (e.g. Ritter, 1988) or by heating the magnetic spot region (see Parker, 1979), will cause the mass transfer rate to increase again. This coincides with the white dwarf photosphere re-inflating, hence the radius gets larger, and the X-ray flux decreases again. Therefore, as RXJ0513 returns to its optical high state the source is once again not observable in X-rays.
Comparing the temperature and luminosity determined by the blackbody fits with the white dwarf tracks in the Hertzsprung-Russel diagram of Iben (1982; Figure 2) one finds agreement with a massive () white dwarf which is somewhat expanded. For a white dwarf the radius at the stability line is cm. The radius inferred from the PN spectral fits implies a radius expansion by a factor of 3.9. We note that Hachisu & Kato (2003b) derive a larger radius using their model, a factor of larger than the value we determine from our fits.
Our spectral fits to the PN data indicate that a more complicated model is needed to describe the X-ray emission. The higher spectral resolution data from the RGS reveal the existence of highly ionized gas outflowing along our line of sight at speeds of up to 3000 km s-1, with multiple velocity components that evolve over time. The optical depth of the ionized absorption appears to increase over the course of the eight RGS observations; this is borne out by the lower-resolution PN spectra, in which deep absorption features become apparent in the final two spectra. The presence of this absorption partly explains why the blackbody fits are so poor.
There are a variety of possible causes for the increase in optical depth of the intrinsic absorption. We could be viewing the system close to pole-on (i.e. low inclination) through the (presumably) bipolar outflow, and the intrinsic covering factor of the outflow is changing. Possible explanations for this include the effects of a magnetic cycle of the optical star (c.f. CAL83 and VY Scl stars, Alcock et al., 1997; Honeycutt & Kafka, 2004, respectively), the expansion of the white dwarf or the system precessing with respect to our line of sight (Southwell et al., 1997). We note that Cowley et al. (2002) found a 83.2 d long period in the optical high-state MACHO data of RXJ0513 which they attribute to accretion disk precession. Such a period would be shorter than the optical high/low state cycle length.
Alternatively, it might not be the bipolar outflow we are seeing, but actually the process of expansion of the white dwarf surface itself, as highly ionized nova by-products stream out from the white dwarf surface and gradually build into an optically-thick inflated surface, confined by the gravity of the white dwarf. The increase in optical/UV radiation would then occur as the ‘intrinsic’ X-rays are down-scattered in the increasingly optically thick outer inflated layer of the white dwarf. The apparently anomalous abundances of Sulphur, Argon and Nitrogen in the ionized outflow may indeed imply, if this is not just a covering factor effect due to line saturation (Arav et al., 2002), that the gas originated in the nova nucleosynthesis. The abundances may be modified in the atmosphere of the steady nuclear burning white dwarf via hot CNO burning (c.f. CNO abundances for CAL83 using NLTE model atmospheres, Lanz et al., 2005). From the nova evolution model calculations of Prialnik & Kovetz (1995), it follows that a massive white dwarf accreting at a high rate of yr-1 has a recurrence time which can be as short as the high/low state cycle length of d of RXJ0513.
The fact that the observed RGS spectra deviate from the blackbody approximation at Å may be due to effects of carbon transitions in this range due to a white dwarf atmosphere. A white dwarf atmosphere with an effective temperature as deduced from the blackbody fits to the PN data shows that with increasing gravity (white dwarf mass) above the C vi edge (0.49 keV) the atmospheric density increases. This shifts the ionization equilibrium toward a lower degree of ionization, causing the emission edges to turn to absorption (Hartmann & Heise, 1996, 1997). For the same gravity the energy of the C absorption (edge) shifts to lower energies due to a change of the ionization state of C. Thus the C v–vi absorption due to the white dwarf stellar atmosphere may be at least partly responsible for the disagreement found from the blackbody approximation (see Paerels et al., 2001; Rauch et al., 2005).
The existence of an ionized absorber in the X-ray spectrum of RXJ0513 seems plausible as the absorption lines found in the RGS spectrum of the fifth (and other) observations of the source require a shift due to a velocity up to 2800 km s-1 which is consistent with the escape velocity of a massive white dwarf. Such absorption lines (but usually with lower line-of-sight outflow velocities) are commonly found in the soft X-ray spectra of AGN; these were first discovered in the Chandra LETGS spectrum of the Seyfert 1 galaxy NGC 5548 (Kaastra et al., 2000) and have since been observed in a range of other sources (see e.g. Blustin et al., 2005). The soft X-ray absorption lines in the spectra of these AGN originate in a low-density photoionized medium. In RXJ0513, however, the existence of absorption structures which cannot be explained by a photoionized absorber model (especially those between Å) indicates that the absorption takes place in a very different medium, probably at a much higher density. This would be consistent with an origin in a white dwarf atmosphere.
The spectral model we constructed for the fifth RGS spectrum in the series does, however, reproduce many spectral features due to the ionized outflow in RXJ0513; in this model, the log ionization parameter of the outflowing gas is in the range of 2.4 to 2.6. The ionization structure for such an ionization parameter would be consistent with that of the outflowing version of model 8 in Kallman & McCray (1982), which models gas photoionized by a blackbody emitter. However, it remains difficult to obtain consistency between the other parameters inferred by the spectral fits to the RGS and EPIC-PN spectra, the hydrogen absorbing column density of the ionized gas, the bolometric luminosity of the source and the blackbody radius of the source. If we write the ionization parameter as where , then we obtain with erg s-1, cm-2 and log a value for cm, which is unreasonably large for RXJ0513 (the size of the radius inferred for the white dwarf in RXJ0513 is cm). The discrepancy could be due to the real hydrogen column density being much higher than it is in our model. We estimated our model absorbing columns assuming that carbon is at its Solar abundance in the absorber. If carbon is less abundant than this the column density could be underestimated. The abundance of carbon in the LMC is only a factor less than the Solar abundance which would not have a large effect on the column density. The SED used to calculate the SPEX xabs absorber model is harder than the apparent underlying continuum of this source, and so the ionization balance will not be exactly the same as that of model 8 in Kallman & McCray (1982), and the inferred ionization level will also be affected if the density is indeed far higher than expected in the AGN-type photoionized medium that the xabs model assumes (see above). In addition, the outflowing gas may be ionized by just a fraction of the radiation from the nuclear burning white dwarf if it is still close to the white dwarf atmosphere.
We can estimate the mass outflow rate assuming the accretion is slightly super-Eddington. The Eddington luminosity is erg s-1 (e.g. Grimm et al., 2002). As (see King & Pounds, 2003), we determine with , erg s-1, and km s-1, yr-1. This value for the mass outflow rate is consistent with the wind mass loss rate estimated by Hachisu & Kato (2003b) for RXJ0513.
We can also directly compare the physical parameters inferred from the observational data of the low-state egress of RXJ0513 with the parameters predicted by the model of Hachisu & Kato (2003b), for the high/low state transitions of RXJ0513. The evolution of the blackbody temperature inferred from the EPIC-PN data follows roughly the evolution of the temperature as inferred by Hachisu & Kato (2003b), although the temperatures and the radii inferred from the observations are about 25% higher and a factor of 2 smaller, respectively. One prediction of the Hachisu & Kato (2003b) model are winds from the white dwarf with a wind mass-loss rate of yr-1 during this part of the lightcurve. We can estimate the optical depth of such a highly ionized wind due to Thomson scattering opacity assuming an outflow velocity of 3000 km s-1 and a radius of cm. For a wind mass-loss rate of yr-1 we calculate an optical depth of 1 which is sufficient to obscure the soft X-ray source during the low-state egress.
8 Summary
We have presented a series of eight XMM-Newton EPIC-PN and RGS observations during the late phase (onset of egress) of an optical low-state of the supersoft X-ray source RXJ0513. Simultaneous XMM-Newton OM and long-term ground based optical monitoring are also reported. We have derived the evolution of the fluxes in the observed bands and the evolution of the X-ray spectral parameters from a blackbody spectral fit to the EPIC-PN data. We find that the temperature and luminosity decrease, and an indication of an increase in the radius of the blackbody emitter with time. During the late phase of the optical low-state we find broad spectral dips in the EPIC-PN spectra just below 0.5 keV. The RGS spectra show deep absorption features (e.g. C vi, Ar xiii/xiv, S xiv) which deepen with time and in addition some weak emission lines. We model the RGS spectra with a Compton-scattered 70 eV blackbody with Galactic neutral absorption and additional intrinsic ionized absorption due to outflowing gas using a photoionized absorption model. Our spectral model for the fifth RGS spectrum, which was taken in the deepest part of the optical low state, requires velocities of the outflowing gas of 800, 1800, and 2800 km s-1, ionization parameters log of 2.4 to 2.6, and hydrogen columns of at least to cm-2. We find that the spectral model lies significantly above the observed spectrum in the Å and Å regime which is likely to be due to effects related to the white dwarf atmosphere.
Acknowledgments
This work is based on observations obtained with XMM-Newton, an ESA science mission with instruments and contributions directly funded by ESA Member States and NASA. The authors wish to thank Retha Pretorius and the SMARTS consortium observers. The authors also wish to thank the Fred Jansen and Norbert Schartel and the XMM-Newton control centre staff for executing out ToO observations. KEM would like to thank Gavin Ramsay for advice on the data analysis. AJB would like to thank Ehud Behar and Jelle Kaastra for useful advice on atomic data and modelling. KEM and AJB acknowledge the support of the UK Particle Physics and Astronomy Research Council (PPARC). Part of this work was supported by NASA grant NNG04EG32I. We thank the referee for helpful and constructive comments.
References
- Alcock et al. (1995) Alcock C., et al., 1995, Phys. Rev. Lett., 74, 2867
- Alcock et al. (1997) Alcock C., et al., 1997, MNRAS, 286, 483
- Anders & Grevesse (1989) Anders E., Grevesse N., 1989, Geochimica et Cosmochimica Acta, 53, 197
- Arav et al. (2002) Arav N., Korista K. T., de Kool M., 2002, ApJ, 566, 699
- Blackburn (1995) Blackburn J. K., 1995, in ASP Conf. Ser., Vol. 77, Astronomical Data Analysis Software and Systems IV, ed. R. A. Shaw, H. E. Payne, and J. J. E. Hayes (San Francisco: ASP), 367
- Blustin et al. (2005) Blustin A. J., Page M. J., Fuerst S. V., Branduardi-Raymont G., Ashton, C. E., 2005, A&A, 431, 111
- Callanan et al. (1989) Callanan P. J., Machin G., Naylor T., Charles P. A., 1989, MNRAS, 241, 37
- Cowley et al. (1993) Cowley A. P., Schmidtke P. C., Hutchings J. B., Crampton D., McGrath T. K., 1993, ApJ, 418, L63
- Cowley et al. (1996) Cowley A. P., Schmidtke P. C., Crampton D., Hutchings J. B., 1996, In: eds van den Heuvel E. P. J., van Paradijs J., Proc. IAU Symp. 165: Compact Stars in Binaries, Kluwer, Dordrecht, p. 439
- Cowley et al. (2002) Cowley A. P., Schmidtke P. C., Crampton D., Hutchings J. B., 2002, AJ, 124, 2233
- den Herder et al. (2001) den Herder J. W., et al., 2001, A&A, 365, L7
- Gaensicke et al. (1998) Gaensicke B. T., van Teeseling A., Beuermann K., de Martino D., 1998, A&A, 333, 163
- Greiner (1996) Greiner J., 1996, in: ed Greiner J., Lecture Notes in Physics 472: Supersoft X-ray Sources, Springer-Verlag, p. 299
- Grimm et al. (2002) Grimm H. -J., Gilfanov M., Sunyaev R., 2002, A&A, 391, 923
- Hachisu & Kato (2003a) Hachisu I., Kato M., 2003a, ApJ, 590, 445
- Hachisu & Kato (2003b) Hachisu I., Kato M., 2003b, ApJ, 588, 1003
- Hartmann & Heise (1996) Hartmann H. W., Heise J., 1996, in Supersoft X-ray Sources, LNP 472, ed. J. Greiner, p. 25
- Hartmann & Heise (1997) Hartmann H. W., Heise J., 1997, A&A, 322, 591
- Honeycutt & Kafka (2004) Honeycutt R. K., Kafka S., 2004, AJ, 128, 1279
- Hutchings et al. (2002) Hutchings J. B., Winter K., Cowley A. P., Schmidtke P. C., Crampton D., 2002, AJ, 124, 2833
- Iben (1982) Iben I., 1982, ApJ, 259, 244
- Kaastra et al. (2000) Kaastra J. S., Mewe R., Liedahl D. A., Komossa S., Brinkman A. C., 2000, A&A, 354, 83
- Kaastra et al. (2002) Kaastra J. S., Mewe R., Raassen A. J. J., 2002, in ESA SP-488, New visions of the X-ray Universe in the XMM-Newton and Chandra Era, ed. F. Jansen, electronic proceedings
- Kallman & McCray (1982) Kallman T. R., McCray R., 1982, ApJS, 50, 263
- Kato (1985) Kato M., 1985, PASJ, 37, 19
- King & Pounds (2003) King A. R., Pounds K. A., 2003, MNRAS, 345, 657
- Kovetz & Prialnik (1994) Kovetz A., Prialnik D., 1994, ApJ, 424, 319
- Lanz et al. (2005) Lanz T., Telis G. A., Audard M., Paerels F., Rasmussen A. P., Hubeny I., 2005, ApJ, 619, 517
- Livio (1996) Livio M., 1996, in: ed Greiner J., Lecture Notes in Physics 472: Supersoft X-ray Sources, Springer-Verlag, p. 183
- Long, Helfand & Grabelsky (1981) Long K. S., Helfand D. J., Grabelsky D. A., 1981, ApJ, 248, 925
- Mason et al. (2001) Mason K. O., et al., 2001, A&A, 365, L36
- Nomoto (1982) Nomoto K., 1982, ApJ, 253, 798
- Ögelman et al. (1993) Ögelman. H., Orio M., Krautter J., Starrfield S., 1993, Nature, 361, 331
- Paerels et al. (2001) Paerels F., Rasmussen A. P., Hartmann H. W., Heise J., Brinkman A. C., de Vries C. P., den herder J. W., 2001, A&A, 365, 308
- Paczyński (1971) Paczyński B., 1971, ARAA, 9, 183
- Page et al. (2003) Page M. J., Davis S. W., Salvi N. J., 2003, MNRAS, 343, 1241
- Pakull et al. (1993) Pakull M. W., et al., 1993, A&A, 278, L39
- Parker (1979) Parker E. N., 1979, Cosmical Magnetic Fields (Oxford: Clarendon)
- Prialnik & Kovetz (1995) Prialnik D., Kovetz A., 1995, ApJ, 445, 789
- Rauch et al. (2005) Rauch T., Werner K., Orio M., 2005, Proceedings ITAMP Workshop: X-ray Diagnostics for Astrophysical Plasmas: Theory, Experiment, and Observation. 2004 November 15-17 Cambridge, USA, (astro-ph/0501012)
- Reinsch et al. (2000) Reinsch K., van Teeseling A., King A. R., Beuermann K., 2000, A&A, 354, 37
- Ritter (1988) Ritter H., 1988, A&A, 202, 93
- Schaeidt et al. (1993) Schaeidt S., Hasinger G., Trümper J., 1993, A&A, 270, L9
- Smale et al. (1988) Smale A. P., et al., 1988, MNRAS, 233, 51
- Southwell et al. (1996) Southwell K., Livio M., Charles P. A., O’Donoghue D., Sutherland W. J., 1996, ApJ, 470, 1065
- Southwell et al. (1997) Southwell K. A., Livio M., Pringle J. E., 1997, ApJ, 478, 29
- Strüder et al. (2001) Strüder L., et al., 2001, A&A, 365, L18
- Tarter et al. (1969) Tarter C. B., Tucker W. H., Salpeter E. E., 1969, ApJ, 156, 943
- Trümper (1992) Trümper J. E., 1992, in: eds van den Heuvel E. P. J., Rappaport S., ASI Ser. 377: X-ray binaries and recycled pulsars, Kluwer, Dordrecht, p. 19
- Turner et al. (2001) Turner M. J. L., et al., 2001, A&A, 365, L27
- van den Heuvel et al. (1992) van den Heuvel E. P. J., Bhattacharya D., Nomoto K., Rappaport S. A., 1992, A&A, 262, 97
- van Paradijs & McClintock (1995) van Paradijs J., McClintock J. E., 1995, In: eds Lewin W. H. G., van den Heuvel E. P. J., X-ray Binaries, Cambridge Univ. Press, Cambridge, p. 58