Deep spectroscopy of a young radio source at z=0.521
Abstract
9C J1503+4528 is a very young CSS radio galaxy, with an age of order years. This source is an ideal laboratory for the study of the intrinsic host galaxy/IGM properties, radio source interactions, evidence for young stellar populations and the radio source triggering mechanism. Here we present the results of a spectroscopic analysis of this source, considering each of these aspects of radio source physics.
keywords:
galaxies: active — quasars: emission lines — ISM: kinematics and dynamicsk.inskip@shef.ac.uk
1 Introduction
It is now widely accepted that Compact Steep Spectrum (CSS) and Gigahertz Peaked Spectrum (GPS) radio sources are in the earliest stages of their evolution, being the progenitors of the larger FRII source population (e.g. Fanti 1995, Readhead 1996). Due to synchrotron self-absorption, the radio spectra of sources with ages of years will peak at frequencies of between GHz and GHz (O’Dea 1998; Snellen et al 2000). Spectral aging arguments (e.g. Murgia et al 1999) suggest ages as young as years for some sources, whilst VLBI-based dynamical ages of GPS sources are years (e.g. Owsianik, Conway & Polatidis 1998; Taylor et al 2000).
However, our understanding of this early phase of radio galaxy evolution is hampered by the difficulty of compiling uniform samples of radio sources in the first few millennia of their growth, and the impossibility of pinpointing galaxies immediately prior to this stage, whilst the processes triggering the radio jets are still underway.
The 9C survey (Waldram et al 2003) was carried out at 15 GHz with the Ryle Telescope to identify foreground sources for the Very Small Array (VSA) microwave background experiment. Over the past several years, extensive followup of the radio properties of this population has been carried out (Bolton et al 2003, 2004; Bolton et al in prep), both to better understand the effects on microwave background experiments and to investigate the sources themselves.
This high survey frequency has been proved to select significant numbers of CSS and GPS sources, as well as sources peaking in the GHz range. We believe this is due to two underlying reasons. First, any survey will preferentially select sources which are brightest near the survey frequency; hence, we preferentially select sources peaking at high frequency. Second, and more subtly, the youngest CSS sources will have little spectral aging, and thus will be brighter at high frequency than their older counterparts.
Optical followup of the CSS and GPS sources is now underway. Here we present the initial results of deep optical spectroscopy of one such source. 9C J1503+4528 is a classical double CSS source at , with an angular size of , corresponding to a projected linear size of kpc.
Values for the cosmological parameters of , and are assumed throughout.
2 Features of interest
Spectra of 9C J1503+4528 were obtained using Keck LRIS (Oke et al 1995) with a 1′′ slit aligned both parallel and perpendicular to the radio source axis, and integration times of 1800s for each position angle. Powerful line emission is observed, with the strength of the [Oii] 3727Å line cf [Oiii](4959+5007)Å indicating a fairly low ionization state for the majority of the gas. The line emission is fairly broad in the central regions of both spectra; a narrow component is also observed in the outer regions of the galaxy in the spectrum aligned parallel with the radio source. The extent of the narrow component () is roughly ten times larger than that of the radio source itself, but not large compared to the extended emission line regions (EELRs) observed around other radio sources (e.g. Inskip et al 2002a, Best, Röttgering & Longair 2000). We therefore infer that the ISM/IGM is being ionized by the by the AGN, out to a limiting distance of times the age of the AGN itself. Taking a typical growth rate of a compact radio source to be (e.g. Owsianik, Conway & Polatidis 1998; Taylor et al 2000), the factor of difference between radio source size and EELR size implies that both the AGN and the radio source were triggered at effectively the same point in time, with the source age being years.
Determining the systemic redshift of 9C J1503+4528 was complicated by the inherent structure in the emission lines: the redshift implied by the peak of the line emission on the continuum centroid differs substantially from that of the narrow extended component. However, the various absorption features in the spectra (Ca H & K, high-order Balmer lines) all suggest a redshift identical to that determined from the extended narrow component, giving a value of .
The presence of the Balmer absorption features, together with blue continuum emission (see Inskip et al in prep. for further details), indicate the presence of a young stellar population (YSP). Whilst the line emission is more pronounced in the parallel spectrum, absorption is more significant in the perpendicular spectrum, suggesting that any YSP is distributed throughout the galaxy rather than being associated with any radio source shocks.
3 Ionization state
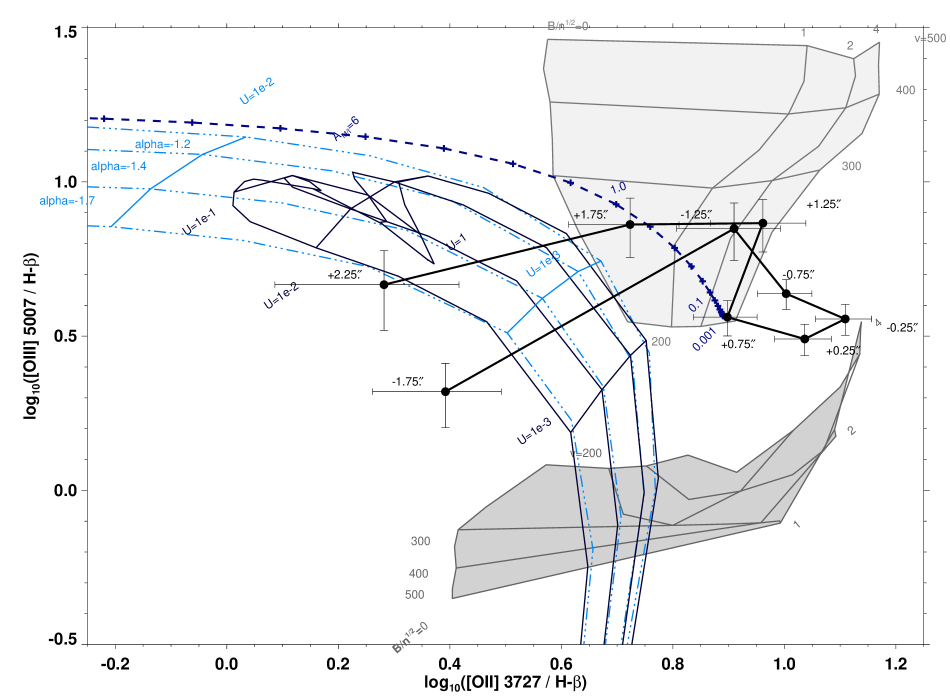
Ionization state diagnostic diagrams (Baldwin, Phillips & Terlevich 1981) are particularly useful in investigating emission line gas (e.g. Best, Röttgering & Longair 2000, Inskip et al 2002a, Moy & Rocca-Volmerange 2002). To investigate the changing ionization state of the emission line gas with position, one-dimensional spectra were extracted in steps across the slit from the parallel spectrum, and the emission lines fitted by gaussians. The measured line ratios were compared with the predictions of various models. Figure 1 displays the [Oii] 3727Å/H vs. [Oiii]5007Å/H diagnostic diagram (see figure caption for details).
The changing ionization state relative to distance from the AGN can be immediately appreciated. The central regions of the host galaxy lie close to the predictions of the shock ionization models (and also the far end of the mixed medium ionization track). Just outside the radio source, the shock plus precursor photoionization models provide a good explanation. Beyond 1-1.5′′ (i.e. the extended narrow emission region), the data are well described by the predictions of simple AGN photoionization. The higher values of the ionization parameter are most plausible, so dusty models are clearly more appropriate than photoionization in the absence of dust. For the gas which is (apparently) AGN photoionized, the ionization state of the material at larger radii suggests either a lower spectral index ( rather than ), higher gas density or lower metallicity. Although the mixed medium model also seems to provide a good representation of the changing emission line ratios with position, its predictions do not coincide with the behaviour of the [Oiii]4363Å/[Oiii]5007Å line ratio, allowing us to exclude this type of model from further consideration.
The results for the central 1-2′′ should not be greatly different for the parallel and perpendicular spectra, as both sample essentially the same region of the host galaxy. However, the impact of AGN and shock ionization will be greatly lessened at larger distances, for material which lies off the radio source axis and well outside the ionization cone of the AGN. This is indeed observed: similar line ratios are observed within the central 2′′, but the line emission at a greater distance from the AGN is much weaker for the perpendicular spectrum, and the emission line ratios for the ionized component are consistent with a weaker flux of ionizing photons.
The picture provided by these results is as follows. The UV continuum emission from the AGN ionizes the gas at all locations within the ionization cone, decreasing in intensity at larger distances. Much weaker line emission is observed off-axis. The innermost regions of the galaxy, of order the same size as the radio source, have an additional contribution from shocks. The UV radiation field produced by these shocks adds another ionization component to the emission from gas at intermediate distances.
4 Kinematics
We have also investigated the gas kinematics by analysing the profiles of the [Oii] 3727Å and [Oiii](4959+5007Å) emission lines. Two–dimensional regions around each of these lines were extracted. From these, a sequence of one dimensional spectra were extracted along the slit direction, stepped every 0.5′′. The extracted spectra were then analysed using the following procedure:
After continuum subtraction, the data were fitted by successive Gaussian components, which were only accepted if their FWHM was larger than the instrumental resolution and the S/N ratio was greater than approximately five (with the exception of the outermost extracted spectra, for which a fainter, single gaussian component could be detected at a lower S/N.) The best-fit combination of Gaussians (that with the lowest reduced ) determined the maximum number of velocity components which could realistically be fitted to the data. (For the [Oiii] emission line, the relative positions and strengths of the two components are held fixed)
The integrated emission line flux, the velocity relative to that at the centre of the galaxy, and the emission line FWHM were determined for each Gaussian fit. To calculate the emission line FWHM, it was deconvolved by subtracting in quadrature the instrumental FWHM, as determined from unblended sky lines. Errors were calculated for these three parameters, and allow for the fact that a range of possible fits are equally acceptable at low S/N. This approach allows us to search for high velocity components in the emission line gas, or other structures incompatible with a fit to a single velocity component. Given the observed emission line profile of this source, such a step was a necessity, and broader emission line components are clearly present in the central parts of the extended emission line region.
Our results for the kinematics of the parallel spectrum are presented in Fig. 2, which displays flux, width and velocity offset for fitted line components at various positions across the spectrum, for both [Oii] and [Oiii].


An unresolved emission component is present in the outer regions of the EELR, in both [Oii] and [Oiii], at wavelengths which are generally consistent with the emitting material lying at rest relative to the host galaxy. This narrow component can be traced across the galaxy in [Oiii]. The [Oii] emission line is of substantially higher luminosity, particularly in the central regions of the galaxy. Because of this, the narrow component of [Oii] can only be observed in the outer regions, and is lost in the centre in favour of one or more broader components. The relative strengths of the narrow components of [Oii] and [Oiii] are consistent with simple AGN photoionization, as demonstrated by our diagnostic diagrams in the previous section.
The broader emission line components extend to a distance of approximately 1-1.5′′ from the continuum centroid. We note that the [Oii] emission is substantially stronger than the [Oiii] emission; such a low ionization state in the emitting material suggests shocks associated with the radio source, in which case the emitting material would display larger line widths. Usually a single broad component is sufficient, except in the central regions where two broad components are preferred. The broad components on the SE side of the galaxy usually lie at shorter wavelengths, with a velocity shift of a few hundred kms-1, whilst the emission from the opposite side of the galaxy is shifted to longer wavelengths by a similar amount. Of these two distinct components, the blue-shifted emission line component is generally more luminous, and has a larger line width (400-600 km s-1, cf 200-400 km s-1 for the red-shifted emission). It is hard to say whether these results suggest outflows or rotation of the gas.
The emission lines in the perpendicular spectrum do not show an extended narrow component. This is strong evidence that the source of the ionizing photons for the extended narrow component is the ionization cone of the AGN, which does not intersect with the perpendicular spectrum except in its centre. In the central regions of the perpendicular spectrum, broad emission components are observed. These are very similar to those observed in the parallel spectrum, with the exception that there is no clear tendency for the blue- or red-shifted emission to preferentially lie on one side of the galaxy or the other. This suggests that outflows along the radio axis are a plausible option for explaining the gas kinematics, as an alternative to simple rotation.
5 Conclusions
The spectra of the very young radio source 9C J1503+4528 have produced a number of interesting results.
-
The relative sizes of EELR and radio source (the former being times larger), together with typical compact radio source expansion velocities of , suggest that both the luminous quasar nucleus responsible for photoionizing the outer regions of the EELR, and the radio source itself, were triggered more-or-less simultaneously.
-
The EELR ionization state is consistent with shocks being important on scales comparable to the radio source, with AGN photoionization within the ionization cones being the dominant mechanism further from the AGN.
-
The gas kinematics confirm that weak shocks could be important close to the radio source, and that the outer regions of the EELR are relatively undisturbed. The kinematics suggest that motion along the radio axis may be taking place, which may indicate the presence of outflows.
-
The blue continuum emission and balmer absorption features suggest that recent star formation has occurred, but do not imply that it is directly related to the radio source.
We have found 9C J1503+4528 to be an excellent example for the detailed study of the properties of young radio sources, and we expect that studies of comparably selected sources will continue to shed light on the processes surrounding radio source triggering. The observed changes in gas kinematics and dominant ionization mechanism in different regions of the EELR are not unexpected, given the expected location of radio source shocks, but do provide two key results: the clumpy ISM/IGM responsible for the EELRs observed around powerful radio sources is indeed in place prior to the expansion of the radio source, and is relatively undisturbed in terms of its kinematic properties.
If the triggering of radio source activity in this galaxy was due to a merger or interaction, the properties of any young stellar population formed as part of that process can shed light on the exact mechanisms and time scales involved. Continuum modelling of these spectra (Inskip et al in prep) suggests that the YSP is likely to be of a fairly low total stellar mass, and relatively young (although still substantially older than the radio source). These results, together with the relatively undisturbed appearance of the host galaxy and the quiescent kinematics in the outer regions of the EELR suggest that any merger/interaction responsible for the eventual triggering of the radio source activity was either fairly minor in nature, or occurred a considerable time previous to the epoch of the observations.
Acknowledgements.
The data presented herein were obtained at the W. M. Keck Observatory, which is operated as a scientific partnership among the California Institute of Technology, the University of California, and the National Aeronautics and Space Administration. The Observatory was made possible by the generous financial support of the W. M. Keck Foundation. KJI acknowledges a PPARC research fellowship, DL a PPARC PhD studentship and GC support from PPARC observational rolling grant PPA/G/O/2003/00123. It is a pleasure to express our gratitude and respect to the indigenous people of Hawai‘i, from whose sacred mountain Mauna Kea our observations were made.References
- [1] Baldwin J. A., Phillips M. M., Terlevich R., 1981, PASP, 93, 5
- [2] Best P. N., Röttgering H. J. A., Longair M. S., 2000, MNRAS, 311, 1
- [3] Binette L., Wilson A. S., Storchi-Bergmann T., 1996, A&A, 312, 365
- [4] Bolton R. C., Cotter G., Pearson T. J., Pooley G. G., Readhead A. C. S., Riley J. M., Waldram E. M., 2003, NewAstRev, 2003, 47, 367
- [5] Bolton R. C., et al, 2004, MNRAS, 354, 485
- [6] Bruzual G., Charlot S., 2003, MNRAS, 344, 1000
- [7] Dopita M. A., Sutherland R. S., 1996, ApJS, 102, 161
- [8] Fanti C., Fanti R., Dallacasa D., Schilizzi R. T., Spencer R. E., Stanghellini C., 1995, A&A, 302, 317
- [9] Groves B. A., Dopita M. A., Sutherland R. S., 2004a, ApJS, 153, 9
- [10] Groves B. A., Dopita M. A., Sutherland R. S., 2004b, ApJS, 153, 75
- [11] Howarth I. D, 1983, MNRAS, 203, 301
- [12] Inskip K. J., Best P. N., Rawlings S., Longair M. S., Cotter G., Röttgering H. J. A., Eales S. A., 2002a, MNRAS, 337, 1381
- [13] Inskip K. J., Best P. N., Röttgering H. J. A., Rawlings S., Cotter G., Longair M. S., 2002b, MNRAS, 337, 1407
- [14] Moy E., Rocca-Volmerange B., 2002, A&A, 383, 46
- [15] Murgia M., Fanti C., Fanti R., Grgorini L., Klein U., Mack K. H., Vigotti M., 1999, A&A, 345, 769
- [16] O’Dea C. P., 1998, PASP, 110, 493
- [17] Oke J. B., et al, 1995, PASP, 107, 375
- [18] Owsianik I., Conway J. E., Polatidis A. G., 1998, A&A, 336, L37
- [19] Readhead A. C. S., Taylor G. B., Pearson T. J., Wilkinson P. N., 1996, ApJ, 460, 634
- [20] Snellen I. A. G., Schilizzi R. T., Miley G. K., de Bruyn A. G., Bremer M. N., Röttgering H. J. A., 2000, MNRAS, 319, 445
- [21] Taylor G. B., Marr J. M., Pearson T. J., Readhead A. C. S., 2000, ApJ, 541, 112
- [22] Waldram E. M., Pooley G. G., Grainge K. J. B., Jones M. E., Saunders R. D. E., Scott P. F., Taylor A. C., 2003, MNRAS, 342, 915