Oxygen Gas Abundances at : Implications for the Chemical Evolution History of Galaxies
Abstract
We report VLT-ISAAC and Keck-NIRSPEC near-infrared spectroscopy for a sample of 30 CFRS galaxies and five [OII]-selected, , galaxies. We have measured and line fluxes for the CFRS galaxies which have , and line fluxes available from optical spectroscopy. For the objects we measured and emission line fluxes from J-band spectra, and line fluxes plus upper limits for fluxes from H-band spectra. We derive the extinction and oxygen abundances for the sample using a method based on a set of ionisation parameter and oxygen abundance diagnostics, simultaneously fitting the [OII], , [OIII], , and [NII] line fluxes. Our most salient conclusions are: a) the source of gas ionisation in the 30 CFRS and in all galaxies is not due to AGN activity; b) about one third of the CFRS galaxies in our sample have substantially lower metallicities than local galaxies with similar luminosities and star formation rates; c) comparison with a chemical evolution model indicates that these low metallicity galaxies are unlikely to be the progenitors of metal-poor dwarf galaxies at , but more likely the progenitors of massive spirals; d) the galaxies are characterized by the high [OIII]/[OII] line ratios, low extinction and low metallicity that are typical of lower luminosity CADIS galaxies at , and of more luminous Lyman Break Galaxies at , but not seen in CFRS galaxies at ; e) the properties of the galaxies suggest that the period of rapid chemical evolution takes place progressively in lower mass systems as the universe ages, and thus provides further support for a downsizing picture of galaxy formation, at least from to today.
Department of Physics, Swiss Federal Institute of Technology (ETH Zürich), ETH Hönggerberg, CH-8093, Zürich, Switzerland
1 Introduction
The starlight that is seen at any particular redshift must be associated with the production of heavy elements which can then be seen (in stellar atmospheres or in the gas phase) at all later epochs. Monitoring how the chemical content of galaxies changes with cosmic time is thus important to constrain the history of the global star formation activity in the universe.
Efforts to determine the gas metallicity of star forming galaxies as a function of cosmic time have returned oxygen ([O/H]) gas metallicities for relatively large sample of galaxies up to and a handful above . Most of these studies have relied on rest-frame optical lines, and in particular on Pagel’s [23] metallicity indicator. While relatively easy to measure, is however degenerate with metallicity (as low values of may correspond to very low or high metallicities), and severely affected by dust extinction. Both problems are solved if the and line fluxes are also available, since the line ratio provides an estimate for the dust extinction, and the / line ratio breaks the degeneracy in . However, for the and lines are shifted in the near-infrared (NIR), and are thus much more challenging to measure than the lines which appear within the optical window. In this contribution we describe new near-infrared spectroscopy enabling us to determine oxygen abundances for a sample of 30 CFRS and five galaxies, to investigate how the properties of the star forming gas evolve in galaxies, from the period of the peak of the star formation and metal production rates until today.
2 Near-Infrared Spectroscopy
30 CFRS galaxies at with absolute B magnitudes were extracted from the 66 objects sample presented in [17] (see also [4]) forming an essentially random sub-sample. They have therefore , , and lines measured with the CFHT. Near-infrared spectroscopy for these CFRS galaxies was obtained with the ISAAC spectrograph at the VLT and with NIRSPEC at Keck II in order to measure their and line fluxes.
The five galaxies were selected as - emitters at from three sources: two galaxies from the CADIS survey [18], one from the CFRS survey [16], and two from unpublished analysis of CFHT emission line searches in the CFRS 22h field [8],[26]. For these galaxies we obtained VLT-ISAAC spectra in the J band, to measure the and fluxes, and in the H-band, to measure and upper limits to the [NII] fluxes. The data reduction of the NIR spectra is described in detail in [20].
3 Line ratios
As shown in [20], we checked that the detected line emission is not strongly contaminated by the presence of an AGN using the log(/) vs. log(/) diagnostic diagram. In none of the CFRS the line emission is dominated by an AGN. Moreover, as we show in a forthcoming paper ([21]), this is also true for the galaxies.
It should be noted that all five galaxies have the high / and / line ratios which are typical of the lower luminosity intermediate- CADIS galaxies ([19]) and of the more luminous Lyman Break Galaxies (LBGs, [24]) at higher . This is in contrast with the bright, intermediate-z CFRS galaxies, which show low / and / ratios.
4 The method to determine oxygen abundances
Our approach to determine gas oxygen abundances is based on the models of [14], who developed a set of ionisation parameter and oxygen abundance diagnostics based on the use of only strong optical emission lines. Using the relations given by [14], we created a model grid of relative line strengths as a function of three parameters: the extinction parameter , the ionisation parameter , and [O/H].
The method consists in performing a simultaneous fit to the , , , , and lines in terms of extinction parameter , ionisation parameter , and [O/H]. The measured [OII], H, [OIII], H, and [NII] fluxes are compared with the theoretical fluxes, predicted for each of the models of our grid (which covers a large range of , , and [O/H] values). For each of the 30 galaxies, the so-derived best fit models provide the oxygen abundance [O/H], ionisation parameter , and , and associated uncertainties. For details of the method see Sect. 3 in [20].
It should be noted that our philosophy is to treat all galaxies at high and low redshift in the same way. Starting with the observed line fluxes (ratios) and computing oxygen abundances with the same method for the low and high redshift galaxies allows us to focus on relative effects between the selected samples in the expectation that these are likely to be much more robust than atempts to determine very accurate the absolute metallicity. Also the contribution of Sara Ellison in these proceedings ([9]) shows that one must be consistent with the choice of metallicity calibration, when comparing different samples of galaxies.
5 The metallicity-luminosity relation
5.1 CFRS galaxies in the metallicity-luminosity diagram
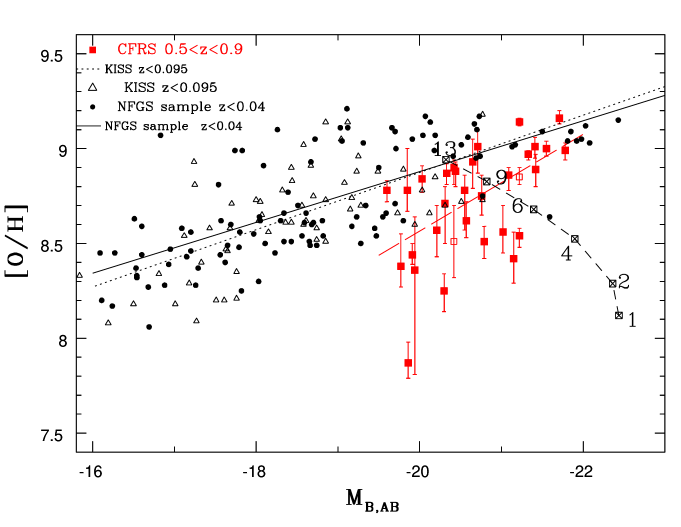
A metallicity-luminosity relation is observed in the local universe in the sense that more luminous galaxies tend to be more metal-rich. Fig. 1, shows vs. [O/H] for the local NFGS ([12]) and KISS ([22]) galaxies and the fits to the respective data, which result in a metallicity-luminosity relation of similar slope and zero-point for both samples, which we use as local comparison. The higher metallicity CFRS galaxies overlap with the region of the diagram occupied by local galaxies of similar luminosity (mass). The lower metallicity CFRS galaxies () are more luminous (massive) than local galaxies with similar [O/H], and more metal-poor than local galaxies with similar absolute luminosities.
Our new measurements of and confirm the low metallicity population of galaxies at found by [17]. It is unlikely that these low metallicity galaxies are the progenitors of today’s metal-poor dwarf galaxies (), because they would need to fade too much: e.g., in [17] in Section 4.2 it was discussed that it is unlikely that CFRS galaxies can fade by more than 2.5 mag to the present epoch. Moreover, chemical evolution models generally produce “oblique” rather than “horizontal” tracks: the evolution in the metallicity-luminosity diagram would be from bottom right to upper left, with galaxies evolving from low metallicity and high luminosities towards higher metallicities and fainter luminosities, as shown by the model in Fig. 1.
Comparing the average value of [O/H] for the 30 CFRS galaxies to the average value of [O/H] of NFGS and KISS local galaxies with similar luminosities in Fig. 1, we find that the average change in metallicity is about 0.3 dex between galaxies at and . It is not hard to get a change by a factor of two between and . For instance, Pégase2 models [10] discussed by [19] can get a track as shown by the dashed curve and symbols in Fig. 1, acording to which the metallicity of the intermediate redshift CFRS galaxies may increase by a factor of about 2 by . In this scenario the lower metallicity CFRS galaxies may fade by 0.5-0.9 mag by , due to decreasing levels of star formation, and migrate in the metallicity-luminosity diagram to the region occupied by local galaxies with lower luminosities and higher [O/H]. These are most likely massive spirals. Star formation at likely contributes to building both the disks ([1]), and the bulges ([2],[3],[5], [6]).
5.2 Addition of and CADIS galaxies to the the metallicity-luminosity diagram
To quantify our results for the chemical evolution of galaxies with cosmic time, we have constructed a grid of chemical evolution models using Pégase2, which is described in more detail in our forthcoming paper [21]. In order to discuss the evolution of the metal abundance of the star forming gas in galaxies from to , we compare the Pégase2 models with the observed luminosities and metallicities of the galaxies in Fig.2. Included in the figure are also the intermediate redshift CFRS galaxies, and the location of local KISS and NFGS galaxies.
It is quite noticeable that there is an age-redshift relation along a given Pégase2 track. For example, despite the large scatter, the bright, , galaxies (dark/black filled squares) appear to be “younger” than galaxies (big grey/green filled squares) in the sense that they lie towards the beginning of the luminosity-metallicity track. The latter appear in turn to be on average “younger” than most galaxies (small grey/green filled squares) which themselves actually overlap significantly on the diagram with the metallicity-luminosity relation traced by nearby galaxies. The tracks of the Pégase2 models suggest that the bright star forming galaxies are likely to evolve into the population of less luminous but nonetheless rather massive, metal-rich galaxies that appear in the galaxy population. The observation of this age-redshift effect is not surprising, and indeed is reassuring!
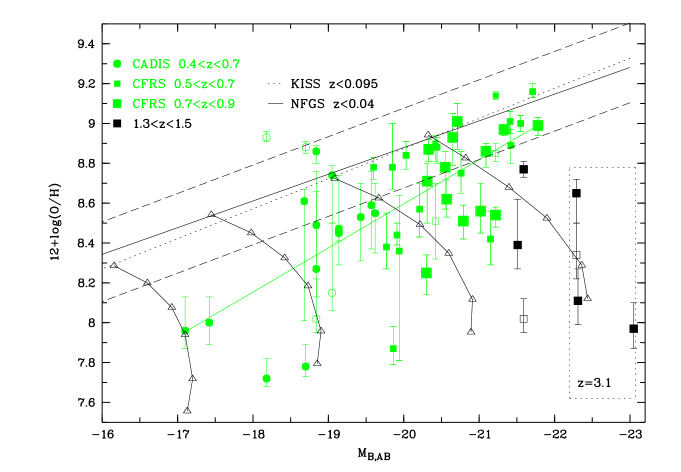
Adding the CADIS galaxies from [19] to the metallicity-luminosity diagram (filled grey/green circles), we note an interesting fact: the rate of evolution of a galaxy along its roughly diagonal track appears to depend on luminosity (mass). At the lookback time of about 6 Gyrs () at which a significant fraction of more massive galaxies are still on the zero redshift metallicity-luminosity relation, the lower luminosity (lower mass) objects at sampled by CADIS are already quite far from the local metallicity-luminosity. Moreover, the metallicity-luminosity relation of the combined CADIS+CFRS sample (solid line) shows a change in slope compared to the local metallicity-luminosity relation, in the sense that the offset in metallicity between and is larger at lower luminosity than at higher luminosity. This may be due to the fact that lower luminosity (mass) galaxies began their most rapid evolution later than high luminosity (mass) galaxies, as also suggested by the Pégase2 models and by [15]. This is a sign of downsizing (see, e.g., [7], [11], [13], [25]): As we look back further in time, we find signs for departures from the metallicity-luminosity relation occuring at progessively higher luminosities (or masses).
6 Conclusions
The metallicity of the star forming gas has been measured for 30 CFRS galaxies with using optical CFHT and near-infrared VLT-ISAAC and Keck-NIRSPEC spectroscopy. Using the measurements of five emission lines it was possible to determine the extinction, oxygen abundances and extinction corrected star forming rates for these 30 luminous () galaxies.
Moreover, the metallicity of the star forming gas has been measured for five galaxies at using new near-infrared VLT-ISAAC spectroscopy in the H- and J-band, and already available measurements of the emission line flux of the line, by which the galaxies were selected. Using the measurements of , , , , and upper limits for it was possible to determine the extinction, oxygen abundances, and extinction corrected star forming rates for these luminous () galaxies.
We also compared Pégase2 chemical evolution models with the observed properties of galaxies at . Our most salient conclusions are:
1. The source of gas ionisation in the 30 CFRS galaxies and in the five galaxies is not associated with AGN activity, as derived from the log(/) versus log(/) diagnostic diagram.
2. All the galaxies have the high / and / line ratios which are typical of the lower luminosity intermediate- CADIS galaxies and of the more luminous LBGs at higher . This is in contrast with the bright, intermediate- CFRS galaxies, which show low / and / ratios.
3. 20 of the 30 CFRS galaxies at have the higher metallicities ([O/H] ) found locally in galaxies of similar luminosities. However, one third of the CFRS galaxies have substantially lower metallicities than local galaxies with similar luminosities and star formation rates. This is at the upper band of the range found by [17] for the fraction of lower metallicities objects, and is due to the fact that we can account for the variety of reddening when computing the oxygen abundances. We also find that the average change in metallicity is about 0.3 dex between the CFRS galaxies and local galaxies of similar luminosities.
4. The evolution of the lower metallicities CFRS galaxies will be probably oblique in the metallicity-luminosity diagram: these galaxies will probably increase their metallicities by about 0.3 dex and decrease their luminosities by about 0.5-0.9 mag, evolving into the region occupied by today’s (massive spiral) galaxies. Therefore they are unlikely be the progenitors of the metal-poor dwarf galaxies seen today.
5. There is an age-redshift relation along a given Pégase2 track. The bright, , galaxies appear to be “younger” than galaxies, and the latter appear in turn to be on average “younger” than most galaxies. The tracks of the Pégase2 models suggest that the bright star forming galaxies are likely to evolve into the population of relatively less luminous but nonetheless rather massive, metal-rich galaxies that appear in the galaxy population.
6. Interestingly, the rate of evolution of a galaxy along its track appears to depend on luminosity (mass). As we look back in time, we find indications for departures from the local metallicity-luminosity relation occuring at progessively higher luminosities (or masses). The different slope of the metallicity-luminosity relation at compared to local galaxies, the lower metallicities and high / and / line ratios of luminous galaxies are a sign of “downsizing”: the signatures of youth are seen in more luminous (and presumably more massive) galaxies at earlier times.
References
- [1] Barden, M., Rix, H.-W., Somerville, R.S. et al., 2005, astro-ph/0502416
- [2] Carollo, C.M., Stiavelli, M., Mack, J., 1998, AJ 116, 68
- [3] Carollo, C.M., 1999, ApJ, 523, 566
- [4] Carollo, C.M. & Lilly, S. J. 2001, ApJ, 548, 153
- [5] Carollo, C.M., Stiavelli, M., de Zeeuw, P.T., Seigar, M., Dejonghe, H., 2001, ApJ 546, 2165
- [6] Carollo, C.M., Stiavelli, M., Seigar, M., de Zeeuw, P.T., Dejonghe, H., 2002, AJ 123, 159
- [7] Cowie, L. L., Songaila, A., Hu, E. M & Cohen, J. G., 1996, AJ, 112, 839
- [8] Crampton, D., & Lilly, S.J. 1999, in ASP Conf. Ser. 191, 229
- [9] Ellison, S.L. & Kewley, L. J., 2005, astro-ph/0508627
- [10] Fioc, M. & Rocca-Volmerange, B., 1999, astro-ph/9912179
- [11] Heavens, A.; Panter, B.; Jimenez, R. & Dunlop, J. 2004, Nature, 428, 625
- [12] Jansen, R. A., Fabricant, D., Franx, M. et al, 2000, ApJS, 126, 331
- [13] Juneau, S.; Glazebrook, K.; Crampton, D. et al., 2005, ApJ, 619, 135
- [14] Kewley, L.J. & Dopita, M.A., 2002, ApJSS, 142, 35
- [15] Kobulnicky, H. A., Wilmer C. N. A., Weiner, B. J. et al., 2003, ApJ, 599, 1006
- [16] Lilly, S. J., Hammer, F., Le Fevre, O., & Crampton, D., 1995, ApJ, 455, 75
- [17] Lilly, S.J, Carollo, C.M. & Stockton, A. 2003, ApJ, 597, 730
- [18] Maier, C., Meisenheimer, K., Thommes, E. et al., 2003, A&A, 402, 79
- [19] Maier, C., Meisenheimer, K., Hippelein, H., 2004, A&A, 418, 475
- [20] Maier, C., Lilly, S.J., Carollo, C.M., Stockton, A. & Brodwin. M., 2005, ApJ in press, astro-ph/0508239
- [21] Maier, C., Lilly, S.J., Carollo, C.M., Meisenheimer, K., Hippelein, H. & Stockton, A., to be submitted 2005
- [22] Melbourne, J. & Salzer, J. J. 2002, AJ, 123, 2302
- [23] Pagel, B. E. J., Edmunds, M. G., Blackwell, D. E. et al. 1979, MNRAS, 189, 95
- [24] Pettini, M., Shapley, A. E., Steidel, C. C. 2001, AJ, 554, 981
- [25] Savaglio, S., Glazebrook, K., Le Borgne, D. et al., 2005, astro-ph/0508407
- [26] Tran, K. H., Lilly, S.J., Crampton, D. and Brodwin, M. , 2004, ApJ, 612, 89