The Rest-Frame FUV Morphologies of Star-Forming Galaxies at and
Abstract
We apply a new approach to quantifying galaxy morphology and identifying galaxy mergers to the rest-frame far-ultraviolet images of 82 Lyman break galaxies (LBGs) and 55 emission-line galaxies in the GOODS and Ultra Deep Fields. We compare the distributions of the Gini coefficient (), second-order moment of the brightest 20% of galaxy light (), and concentration () for high-redshift and low-redshift galaxies with average signal to noise per pixel and Petrosian radii 0.3″. Ten of the 82 LBGs have and possess bright double or multiple nuclei, implying a major-merger fraction of star-forming galaxies 10-25% at , depending on our incompleteness corrections. Galaxies with bulge-like morphologies (, ) make up 30% of the LBG sample, while the remaining 50% have and values higher than expected for smooth bulges and disks and may be star-forming disks, minor-mergers or post-mergers. The star-forming galaxy sample has a morphological distribution which is similar to the UDF LBGs, with an identical fraction of major-merger candidates but fewer spheroids. The observed morphological distributions are roughly consistent with current hierarchical model predictions for the major-merger rates and minor-merger induced starbursts at and . We also examine the rest-frame and colors as a function of morphology and find no strong correlations at either epoch.
Subject headings:
galaxies:evolution – galaxies:high-redshift – galaxies:interacting – galaxies:structure – ultraviolet:galaxies1. INTRODUCTION
Galaxy interactions and mergers are expected to play a dominant role in the formation of stars and evolution of galaxies, particularly in the early universe. The present hierarchical models of galaxy assembly and star formation fail to predict enough red spheroidal galaxies – the assumed end products of major galaxy mergers (e.g. Toomre 1977; Mihos & Hernquist 1996) – at both early and late times (e.g. Cimatti et al. 2004). Observations of on-going mergers at high redshift and the earliest spheroidal systems are crucial to constraining the role of mergers in the evolution of galaxies and the build-up of stellar mass. One of the most accessible ways of identifying galaxy mergers and their end-products is by their morphologies.
Morphological studies of very distant objects have become possible in the last decade with the high-resolution capabilities of the Hubble Space Telescope. Galaxies at redshifts greater than one appear to be systematically more disturbed than local galaxies (Abraham et al. 1996), implying strong evolution in the number density of merging and interacting systems (Abraham & van den Bergh 2002). The first HST images of galaxies above identified via the Lyman break technique (Steidel et al. 1995; Madau et al. 1996) showed a ranges of morphologies, from compact proto-bulges to disturbed major-merger candidates (Giavalisco, Steidel, & Macchetto 1996; Lowenthal et al. 1997; Dickinson 1999; Giavalisco 2002). In recent years, high redshift objects have been identified by other techniques and subsequently studied with HST. These include the extremely red objects (EROs) and sub-mm sources at . EROs possess a range of morphologies from spheroidal to irregular (Moustakas et al. 2004), with an increasing fraction with multiple nuclei at (Daddi et al. 2003). Optical HST images of a small sample of sub-mm sources show that 70% possess multiple components (Chapman et al. 2003).
The connection between the morphologies of very early objects and those observed at later times is not straightforward. In the current picture of galaxy evolution, a galaxy’s morphology is not constant through cosmic time, nor does it evolve along a single linear path. Star-forming disks are generally grown through the accretion of cold intergalactic gas, while bulges and spheroids are typically produced in mergers and interactions. For example, in one simulation of the evolution of a present-day elliptical, its progenitors start as disks grown at redshifts 4 (Steinmetz & Navarro 2002). These primordial disk galaxies merge to form a bulge at . The merger remnant then dynamically relaxes, accretes more gas and reforms a disk between . At , the galaxy undergos yet more interactions and minor-mergers until its gas supply is exhausted and it resembles a red elliptical at .
Despite the complex evolutionary path a single object may take, the evolution of the morphological distribution of galaxies and the number of merging systems at is an important tracer of the formation of the Hubble sequence. While disks are quite fragile and can be destroyed and then regrown, numerical simulations suggest that, once created, bulges are not transient and only grow in mass as a galaxy evolves (Mihos & Hernquist 1996, Steinmetz & Navarro 2002). At , the majority of galaxies are predicted to be disk-dominated (Somerville, Primack, & Faber 2001, hereafter SPF01). However, many of these proto-disks may not resemble local spirals because the disks might not be stable (Mao, Mo, & White 1998) and because a substantial fraction are expected to be undergoing minor mergers (SPF01). Also, by , approximately 20% of objects may have already transformed into bulge-dominated systems (SPF01). The fraction of dark matter halos undergoing a major merger is expected to increase as a power-law proportional to out to at least . Above , theoretical predictions imply that the merger rate flattens such that of massive dark matter halos at should merge within a Gyr (Gottlöber, Klypin, & Kravtsov 2001). High resolution hydrodynamical simulations indicate that the associated gas-rich galaxy mergers create bulge-dominated galaxies (e.g. Mihos & Hernquist 1996).
Some of these mergers should evolve into the red spheroidal population, particularly if they live in dense environments. The spatial clustering of high redshift objects has been used to argue that bright Lyman break galaxies are the likely progenitors of highly-clustered present-day ellipticals (Giavalisco et al. 1994; Giavalisco 2002), although fainter LBGs are much less clustered (Giavalisco & Dickinson 2001) and alternative models are possible (e.g. Wechsler et al. 2001). Other galaxy populations are also highly clustered (e.g. Daddi et al. 2001). Yet it remains ambiguous to what extent the observed high redshift galaxies track the progenitors of local spheroids, since their stellar masses, metallicities, and star-formation rates must evolve substantially at later times (Dickinson et al. 2003; Ferguson et al. 2002; Lowenthal et al. 1997).
Despite the great advances in identifying high-redshift galaxies and obtaining high-resolution images, the distribution of intrinsic galaxy morphologies at early times is still uncertain. Complicating the issue is the wavelength dependence on observed morphology. The highest spatial resolution HST images are those taken in optical wavelengths with the Advanced Camera for Surveys (ACS). At , ACS can only sample rest-frame wavelengths less than the 4000Å break, where dust and young star-forming regions dominate the morphologies of local galaxies (Giavalisco et al. 1996; Hibbard and Vacca 1997; Goldader et al. 2002). Therefore the morphological distributions of high-redshift objects classified by their rest-frame ultraviolet morphologies should not be compared to the rest-frame optical morphological distributions of nearby objects.
A second problem is the intrinsic difficulty of measuring the morphologies of faint and compact objects like Lyman break galaxies. Lyman break galaxies at have typical rest-frame far-ultraviolet (FUV) half-light radii between 0.1 and 1.0 ″ (Ferguson et al. 2004; Bouwens et al. 2004), therefore many LBGs with sizes below at few tenths of an arcsecond are not spatially resolved enough to measure their morphologies even in ACS images. The compact sizes may bias standard morphological analyses that are commonly applied to lower redshift objects, such as concentration measures and bulge-disk decompositions. Also, images of faint high-redshift objects are likely to miss light in the outer, lower-surface brightness regions of the objects. This missed light will bias the observed sizes low, and also affect the measured concentrations and surface-bright profiles. Finally, morphology measures like rotational asymmetry and clumpiness which involve subtracting images and/or a correction for the background noise signal are less robust at low signal-to-noise levels (Lotz, Primack, & Madau 2004).
A third possible problem is the assumption that disturbed morphologies at high redshift directly correlate with mergers and interactions. Because of the roughly 500 million year timescales associated with merger activity, we do not truly know if a disturbed object has undergone a recent merger from a snapshot of its morphology alone. The observed morphology depends on the observational effects (rest-frame wavelength, viewing angle, dust extinction) and the physical conditions of the merger/interaction (mass ratio, orbital parameters, gas fractions, bulge fractions, internal kinematics). Spectroscopy can sometimes confirm the presence of two orbiting galaxies (e.g. the Superantenna, Mihos & Bothun 1998) or tidal in-fall (e.g. IRAS 1520+3342, Arriaba & Colina 2002). Recent observations of morphological irregular, elongated systems at have failed to show the significant rotation that is expected at early merger stages (Erb et al. 2004), and recent studies of kinematic close pairs at indicate a lower merger rate than that derived using morphological asymmetry (Lin et al. 2004). However, the detection of kinematic merger signatures will depend on the merger stage as well as viewing angle and the slit-position. ULIRGs in the final merger stage can exhibit complex velocity fields without obvious rotational centers (eg. IRAS 23128-5919, Mihos & Bothun 1998). While this paper assumes that morphologically identified double-nucleated galaxies are merging systems, theoretical and empirical calibrations of quantitative morphologies and kinematic signatures as merger indicators are important tasks for future work.
In this paper, we apply a new approach to quantifying galaxy morphology and identifying mergers at high redshift. First presented in Lotz, Primack and Madau (2004; hereafter LPM04), this technique measures the relative distribution of galaxy pixel flux values or Gini coefficient (Abraham et al. 2003) and the second-order moment of the brightest 20% of the galaxy’s pixels (). These two quantities are extremely robust to decreasing signal-to-noise and change less than 10% for average signal-to-noise per pixel at spatial resolutions better than 500 pc per resolution element (LPM04). At rest-frame optical wavelengths, we found that local galaxy mergers separate cleanly from the local galaxy Hubble types in Gini coefficient () and .
Here we present the non-parametric rest-frame FUV morphologies for 82 Lyman break galaxies observed in the GOODS and UDF survey and compare the morphology distributions to a spectroscopically selected sample of 55 galaxies in the GOODS fields. In §2, we discuss the selection of both galaxy samples and note that our analysis is limited to FUV bright star-forming galaxies at both epochs. In §3 we describe our non-parametric measures, and how these are applied to the GOODS and UDF images. The size and surface-brightness selection effects are examined in §4 with both a comparison of UDF and GOODS-South morphologies and a series of simulations. The observed morphological distributions of objects with sufficient sizes and signal-to-noise are presented in §5. We also compare the galaxy morphologies to their colors for a sub-set of objects in the GOODS-South and UDF. Finally, in §6 we discuss the morphological distributions in the context of hierarchical model predictions for star-forming galaxies at .
2. GALAXY SAMPLES
Images with high spatial resolutions (better than 1 kpc per resolution element) are needed to reliably measure galaxy morphologies. Assuming the concordance cosmological model ( km s-1 Mpc-1, ), galaxies at redshifts greater than have angular scales 5 kpc per arcsec. The point spread function (PSF) of the Advanced Camera for Surveys (ACS) on the Hubble Space Telescope () has a FWHM , or pc at . Two recent ACS programs have provided an archive of deep, high-resolution, multi-wavelength images that are invaluable for the study of very distant galaxies: Great Observatories Origins Deep Survey (GOODS; Giavalisco et al. 2004) and the Ultra Deep Field (PI: S. Beckwith). The GOODS ACS images cover two 160 □′ fields (the Hubble Deep Field North and the Chandra Deep Field South) in four band-passes (F435W, F606W, F775W, and F850W), with a 10 detection limit of 26.7 in F850W. The UDF covers a much smaller area ( 11.3 □′) in the Chandra Deep Field South, but is observed in the same ACS band-passes and has a deeper limiting magnitude ( 28.4 in F850W). An additional advantage of these two surveys is that the overlap between the extremely deep UDF and somewhat shallower GOODS fields allows us to empirically determine the limiting signal-to-noise for our morphology measures.
We use these two sets of ACS images to measure the morphologies of Lyman break galaxies (LBGs) at and a lower-redshift comparison sample at . At , even the longest wavelength -band (with a central wavelength Å) ACS images probe light emitted at rest-frame far-ultraviolet (FUV) wavelengths. Longer wavelength NICMOS images do exist for the UDF and the HDFN, but these have significantly worse resolution (NIC3 PSF FWHM 0.22 - 0.35 ″). We will restrict our analysis to the FUV morphologies of the Lyman break galaxies and the comparison sample of lower-redshift galaxies at .
2.1. Lyman-break Galaxies
The LBGs were selected from the GOODS photometric catalogs using the “dropout” technique (eg. Madau et al. 1996, Steidel et al. 1996), via the -dropout color-criterion of Giavalisco et al. (2004). This color-cut is sensitive to star-forming galaxies with low to moderate extinctions and redshifts with an expected median redshift . The deepest GOODS images are in the (F606W) and (F775W) bands, which are sufficiently redward of the Lyman break at to detect and quantify the LBG morphologies. We have chosen to examine the LBG morphologies in the summed and ACS images, in order to boost the signal-to-noise per pixel for each galaxy and obtain the largest possible sample of LBGs with measurable morphologies. The effective wavelength of these summed images is 6272 Å, or rest-frame 1425 Å at . We have compared the sizes and quantitative morphologies of high signal-to-noise LBGs measured in the images to those measured in summed images, and have found no evidence for patchy Lyman-alpha forest absorption in the band images which might have affected the apparent morphologies. As high spatial resolution is not necessary to obtain reliable photometry, we also utilize the European Southern Observatory () VLT/ISAAC ground-based near-infrared photometric survey of the GOODS-S (CDFS) fields (Vandame et al. 2004) to compare the rest-frame FUV morphologies to rest-frame colors (§5.2).
Each LBG candidate brighter than 26.6 mag in the summed images was visually inspected, and objects which were spurious detections (i.e. saturated star diffraction spikes, cosmic-rays) were removed from the sample. A fraction of the LBG candidates are compact and red enough to be late-type M stars. However, as discussed below, all objects with were removed for our morphological analysis and we expect no stellar contamination for our subsample of LBGs. The GOODS LBG catalog has 660 B-dropouts detected above 10 in the summed images ( mag). The smaller but deeper UDF LBG catalog has 77 B-dropouts detected above 10 in the summed image ( mag).
2.2. galaxies
At , the bluest GOODS ACS (F435W) images sample the rest-frame FUV at 1980 - 1550 Å, slightly redder than images for the -dropouts. Identifying objects in this redshift range is notoriously difficult. Spectroscopic redshifts are difficult to obtain because few emission lines or spectral breaks are redshifted into the observed optical wavelengths, and optical color selection fails because the Lyman break is bluer than the optical band-passes. Photometric redshifts suffer from similar problems and we found that the incidence of catastrophic failure () in this redshift range was 25%. Nevertheless, spectroscopic confirmation for some GOODS galaxies has been obtained by several surveys. The public Treasury Keck Redshift Survey with DEIMOS on the Keck II telescope has obtained redshifts for 1440 objects out of a magnitude-limited sample of 2018 galaxies in the GOODS-North field (Wirth et al. 2004). The TKRS catalog has “good” quality redshifts for 112 galaxies between . The VIMOS VLT Deep Survey has publicly released redshifts for 1599 objects with mag in the GOODS-South (CDFS) field obtained with VIMOS at the Very Large Telescope (Le Fèvre et al. 2004). Out of the VIMOS VLT Deep Survey catalog objects, 68 galaxies had good quality spectra with . Finally, the /GOODS spectroscopic program with the FORS2 spectrograph at the VLT has obtained spectroscopic redshifts for 243 objects with mag in the GOODS-South field (Vanzella et al. 2004), and provides an additional 53 objects with high quality redshifts between to our sample. The morphologies for all 408 objects were measured in the GOODS ACS images.
We note that all of these spectroscopic surveys are biased towards star-forming galaxies with strong emission lines. Spectroscopic redshifts are much more difficult to obtain for red galaxies at these redshifts, therefore red or weak emission-line galaxies are likely to be missing from this sample.
3. MORPHOLOGICAL ANALYSIS
3.1. Pre-processing
The GOODS and UDF ACS images are large mosaics containing thousands of galaxies. In order to identify the galaxies of interest and mask out foreground/background objects, we ran the galaxy detection and photometry software SExtractor (Bertin & Arnouts 1996). Segmentation maps were created for each mosaic image ( or ) using SExtractor with the detection threshold set to 0.6 and a minimum detection area of 16 pixels. The resulting segmentation maps were used as masks for foreground/background objects.
Some of the LBGs have very close neighbors. Bright star-forming regions of local galaxies may appear as several distinct objects when viewed in the FUV (e.g. Goldader et al. 2002). To prevent the artificial break-up of our LBGs, we compared the SExtractor segmentation map for each LBG with the and colormaps. If the pixels of a nearby object meeting the LBG color criteria overlapped the pixels assigned to the LBG, or if another LBG from the GOODS B-dropout catalog was within 1.5 ″, the segmentation map was edited to include that object’s pixels with the original LBG. This affects 4 objects in our final UDF LBG sample and 7 objects in the final GOODS LBG sample.
Postage stamps for each selected galaxy were cut out from the GOODS or images and the SExtractor segmentation maps. The pixels assigned to any foreground objects in the postage stamp were masked out. A local sky region was selected to exclude any pixels flagged by the SExtractor segmentation map, and the sky value within that box was subtracted from the postage stamp.
3.2. Morphology Measurements
The elliptical Petrosian radius, Gini coefficient, , concentration, and average signal-to-noise per pixel () were measured from the cleaned, sky-subtracted postage stamp of each galaxy.
A well-defined map of the galaxy’s pixels is needed to compute and . We choose not to use the isophotal-based SExtractor segmentation map. Rather, we recomputed our own map based on the surface brightness of the galaxy at the Petrosian radius (), where is measured in elliptical apertures (see LPM04 for a discussion). The elliptical Petrosian radius was calculated assuming the SExtractor ELLIPTICITY and THETA values, and using the SExtractor computed XCENTER and YCENTER as a first guess. Galaxy pixels with fluxes greater than the surface brightness at this radius were assigned to the segmentation map of the galaxy. Occasionally this new segmentation map is not congruous, and the code fails. This generally occurs when either the background object masking is not sufficient or when the object has a low surface brightness relative to the sky level (i.e. low ). For the and samples, any code failures were masked by hand and re-analyzed.
A new estimate of the galaxy’s center was then determined by minimizing the total second-order moment of the pixels within this map:
| (1) |
where is the flux in each galaxy pixel and , is the galaxy center. We recalculated using the revised center, and a revised segmentation map was used to calculate the Gini coefficient and . The Gini coefficient is defined as the distribution of galaxy pixel flux values:
| (2) |
where is the total number of pixels in the galaxy segmentation map. and are the rank-ordered pixel flux values (Glasser 1962). The second order moment of the brightest 20% of the galaxy pixels is defined as
| (3) |
Concentration is calculated from the ratio of radii of circular apertures containing 80% and 20% of the total flux, where the total flux is the flux within 1.5 circular Petrosian radii (Conselice 2003) about the galaxy center determined by Eqn. 1. Previous definitions of concentration have been calculated about the asymmetry center (LPM04) or SExtractor center (Conselice 2003). We do not calculate asymmetry here due to its instability at low (LPM04), and instead use the more reliable second-order moment center. A bad choice of the center can lead to large systematic errors in the concentration for very compact objects.
The average signal-to-noise per pixel () was also computed for the pixels in our segmentation map (as computed above), using the variance of sky pixel values from the previously selected sky region:
| (4) |
Because the GOODS ACS images are drizzled and remapped to a pixel scale less than the original scale, the noise in the sky is correlated. We corrected for the effects of drizzling using the variance reduction factor given in Eqn. A20 of Casertano et al. (2000):
| (5) |
depends on the ratio of the output pixel scale to the original pixel scale and the drizzled pixel fraction . The GOODS images have and , giving (GOODS) = 0.375. The UDF pixel fraction is 0, therefore (UDF) = 1.0.
4. SELECTION EFFECTS AND BIASES
Lyman break galaxies are among the most distant galaxies known, and the images we observe (even with the ACS) are often low signal-to-noise and barely resolved. Any analysis of the morphologies of such high-redshift objects must also include a careful study of the limits of the morphological measures used. In LPM04, we tested the stability of , , and with decreasing and spatial resolution for local galaxies observed in rest-frame . First, the images for set of 7 galaxies of different morphological types were held a fixed spatial resolution (better than 120 pc per resolution element) but added to increasingly higher Poison noise images to measure the effect of noise on the morphological quantities. Then the images were smoothed to decreasing spatial resolutions but scaled such that was constant to measure the effect of low spatial resolution on the morphological quantities. These tests showed that for relatively nearby galaxies observed in rest-frame optical wavelengths, and can be recovered for observations with and spatial resolutions better than 1 kpc.
However, other effects may come into play when measuring the morphologies of distant galaxies. The local sample of LPM04 may not adequately reflect the range of morphologies or physical scales of objects at . High redshift galaxies may be appear more irregular, due to both evolution and morphological K-corrections (Abraham et al. 1996). Also, high redshift galaxies are physically smaller than local galaxies (e.g. Ferguson et al 2004). Finally, the morphologies of galaxies smaller than a few times the image’s PSF cannot be measured, because most of the object’s spatial information is lost.
In this work, we use three approaches to to determine the morphological selection effects and biases of our distant galaxy samples: 1) a comparison of the measured morphologies for large sample of galaxies observed by both the GOODS survey and the deeper UDF survey; 2) a series of simulations of face-on smooth exponential disks and bulges with varying sizes and magnitude; and 3) simulations in which we artificially redshift our sample to . The first test will help us understand at what level the measured morphologies of real (and morphologically complex) distant galaxies are reproducible. The second test will help determine any offsets from the “true” morphologies as a function of size, surface brightness, and light profile. The last test will allow us to directly compare the observed morphological distributions at and .

4.1. GOODS v. UDF morphologies
One of the advantages of the GOODS data-set is that a sub-sample of the GOODS CDFS field has been re-observed with ACS in the same bandpasses to a substantially greater depth for the Ultra Deep Field Survey. By comparing the size, magnitudes, and morphologies calculated from the extremely high signal-to-noise images from the Ultra Deep Field survey to those calculated for the exact same objects in the shallower GOODS images, we can learn a great deal about the reliability of the morphologies measured for the entire GOODS sample.
We have selected 750 objects from the UDF catalog with magnitudes brighter than mag as our control sample. No color or redshift cut was applied to this sample, and it includes galaxies as bright as mag. Both the UDF and overlapping GOODS summed images were pre-processed as described above without modification to the SExtractor segmentation maps, and the morphologies and for all 750 objects were measured in both the GOODS and UDF images. From this sample, we selected galaxies with UDF 3.0 and UDF elliptical Petrosian radii ″. We also removed objects for which the morphology code failed, i.e. objects for the Gini segmentation map was not congruous. The morphology code failed for less than 5% of galaxies brighter than = 26.5 in the GOODS-S images.
The differences between the GOODS and UDF morphology and size measurements for the resulting 571 objects are plotted as a function of the GOODS in Figure 1. The median offset (GOODS-UDF) and standard deviations for the 67 objects with (GOODS) is
| (10) |
We repeated this analysis for the GOODS and UDF images and found very similar offsets and standard deviations at (GOODS) . At (GOODS) , the differences between the measured UDF and GOODS morphologies show large scatter. Therefore, we will restrict our analysis of galaxy morphologies to objects with
At low , the Petrosian radii measured in the GOODS images are slightly smaller than those measured in the UDF images. This is likely to be the result of light in the outer low surface brightness regions being lost in the sky noise. This bias toward smaller sizes is probably the reason for a small offset in at low . The lowest surface brightness pixels are not included in the segmentation map, and the Gini coefficient is artificially lowered. The same bias may also be the cause for the mean offset to higher values at low . is the ratio of the second order moment of light for the bright regions of the galaxy to the total second order moment for the entire galaxy. This total moment depends on the Petrosian radius; if the Petrosian radius is artificially lower, then the total moment decreases while the moment of the brightest region remains unaffected. The concentrations measured in the GOODS images appear to be systematically lower than those measured in the UDF images, even at relatively high . This offset () is small relative to the dispersion (0.45) and the range of possible concentrations. This is also the result of missed light in the outer regions of the galaxy – we measure systematically smaller apertures containing 80% of the total light in the GOODS images, even for galaxies with .
4.2. Bulge and Disk Simulations
To determine the robustness of the measured morphologies at smaller sizes and fainter fluxes, we have simulated a series of face-on exponential disks and bulges of varying sizes and magnitudes. The simulated galaxies are constructed using IRAF.ARTDATA.MKOBJECTS task and are added to a blank region of the or images. We detect and measure the simulated objects in the same way as for our real galaxy samples. A noise-free image of de Vaucouleurs bulge with a half-light radius of 600 resolution elements has , , and , while a noise-free image of an exponential disk with the same half-light radius has , , and (horizontal dotted lines in Figure 2).
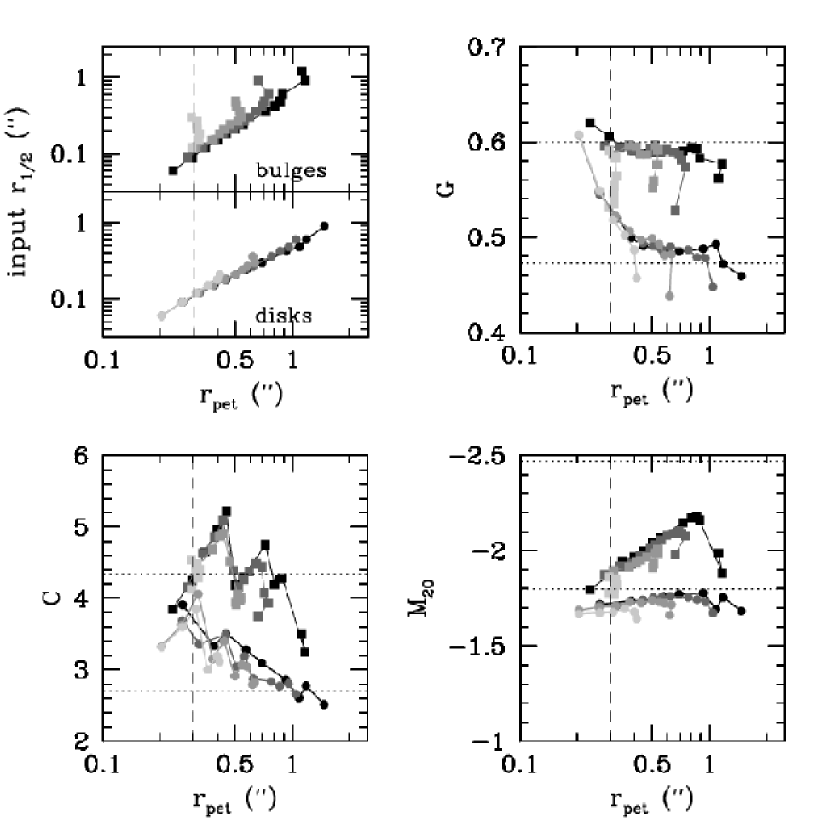
.
We use these simulations to estimate any size/luminosity dependent biases in the morphology measurements. At , the ACS images have physical scales pc per PSF FWHM (0.12 ″). Therefore, we expect that intrinsically small and/or highly concentrated galaxies for which the central regions are not resolved will have systematic biases in their measured morphologies. We find that , , and to a lesser extent are affected. In Figure 2, we plot the measured morphologies and sizes for both bulges and disks detected with , with different grey-scales indicating different total input magnitudes. Our simulations show that disk-dominated galaxies with ″ are not sufficiently resolved to give accurate . At small angular sizes, the measured approaches that expected for a point source (). We find that is biased low for the bulges with sizes less than 1 ″; local well-resolved spheroids have (LPM04), while our simulations produce . Nevertheless, bulges and disks still have distinguishable values. At large sizes and faint magnitudes, we find that the measured radii are smaller than their true radii as the flux from the outer low surface brightness regions is lost. This is a problem particularly for bulges. Because the lowest surface brightness pixels are lost, this effect can also artificially lower the measured by 0.05-0.06.
Concentration is unreliable at small sizes, because the inner aperture containing 20% of the total light not resolved. The observed step-like behavior of concentration for the simulated bulges at ″ is a result of interpolating the inner 20% light radius () at less than 1 or 2 pixels. At radii 1 pixel, the interpolated is likely to be an overestimate because of the steep inner surface brightness profile of bulges, and results in an underestimate of . The estimated approaches the true value at = 1 pixel, and then is again overestimated at 1 pixel. Once the measured is greater than 2 pixels, this effect is not as significant.
In addition to selecting galaxies with , we add the additional selection criterion that the galaxy must have measured ″, because smaller objects are likely to have artificially high values. This will also effectively eliminate any possible stellar contaminants in our LBG sample. The net result is that our sample will span a limited range in sizes, as larger objects are likely to have too low and smaller objects are too compact to be measured. In Figure 3, we show the measured and isophotal magnitudes for the GOODS and UDF B-dropouts and the GOODS sample as a function of . All panels in Figure 3 are plotted on the same physical scale. The high galaxies are intrinsically larger and fainter than the GOODS B-dropouts, but overlap in absolute magnitude and size with the UDF B-dropouts. The redshift distribution of the selected subsamples is shown in Fig. 4.

4.3. Artificial redshift simulations
In Figure 3, we demonstrated that the UDF and GOODS samples span a similar range of intrinsic sizes and rest-frame FUV luminosities. Therefore, any differences between the morphological distributions of these two samples is likely to be the results of intrinsic differences in the samples as opposed to selection effects. However, the selection functions are not identical. Therefore we have selected those objects from the sample with measurable morphologies () and artificially redshifted these to . The redshifted images were given the same exposure times and sky background as the UDF images. We find that objects with isophotal surface brightnesses mag per sq arcsec in the GOODS images drop below the UDF limiting surface brightness of mag per sq arcsec when artificially redshifted because of the surface brightness dimming. Therefore only 23 of the artificially redshifted objects have . For these objects, the offsets in morphology between the original and redshifted images are similar to those found in Equation 6. The measured and isophotal magnitudes for the artificially redshifted sample is shown in Figure 3. The UDF sample probes a volume roughly four times that of the un-redshifted GOODS sample, assuming a limiting magnitude of and for each sample respectively.

5. GALAXY MORPHOLOGIES at 1.5 and 4
In Figures 5-7, we show the , , and values for all galaxies with and ″(small crosses), as well as the artificially redshifted sample. We find that the LBGs have median G , and . We note that Ferguson et al. (2004) found similar concentration values for the ACS -band observations of GOOD LBGs, but that Conselice et al. 2004 and LPM04 reported significantly lower concentration values for the observed near-infrared morphologies of galaxies in the Hubble Deep Field North. We suspect that the larger PSF of the NICMOS images has biased the measured concentrations to lower values. The mean and values are very similar to those found by LPM04 for the rest-frame and morphologies of and galaxies in the Hubble Deep Field North.
A series of two-dimensional Kolmogorov-Smirnov (K-S) tests (Fasano & Franceschini 1987) give a less than 37% probability that bright GOODS LBGs and the fainter UDF LBGs are drawn from the different distributions in , and . The sample’s median morphological values are slightly different, with median (with a tail to lower ), , and . These median values do not change when the sample is artificially redshifted to . The K-S statistical probability that the morphological distributions of the artificially-redshifted sample is different from the UDF LBG sample is greater than 91.5%.


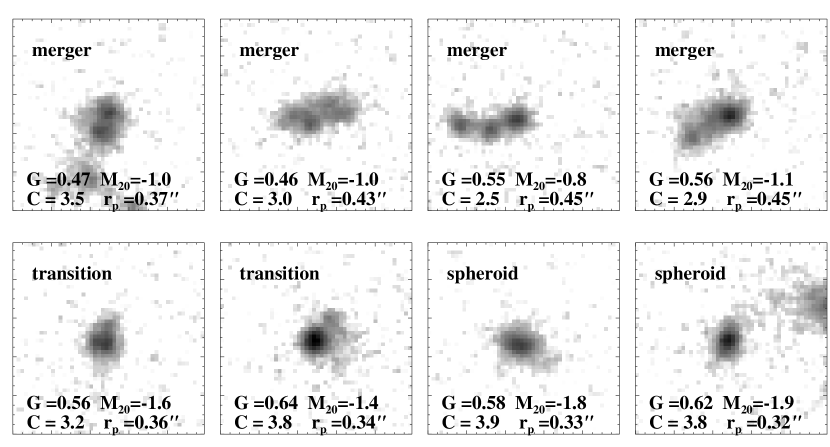
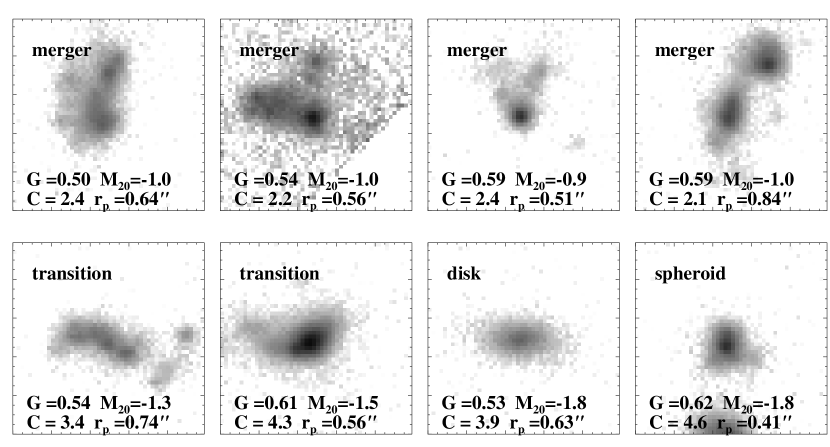
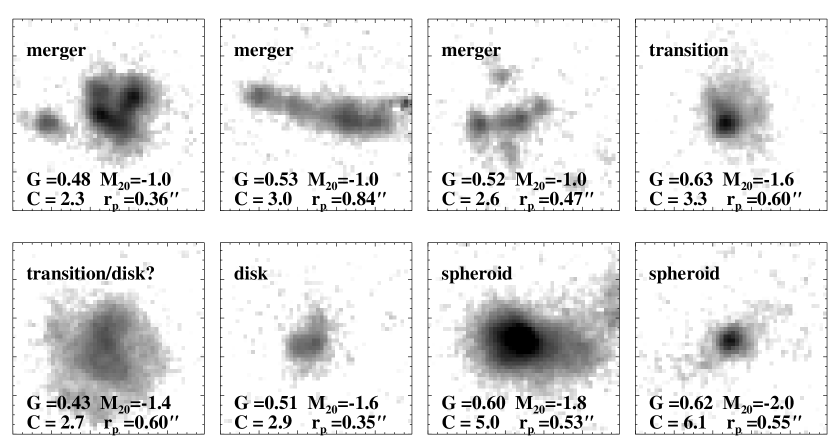
The postage stamps for a subset of galaxies in both redshift ranges are shown in Figures 8-10. In all samples, galaxies with have well-separated double or multiple bright nuclei. Galaxies with are relatively smooth with a single nucleus. Objects with intermediate values can be irregular in appearance, often with a bright nucleus with tidal tail or fainter knots. Galaxies with have very bright nuclei, and include both smooth “bulge”-like objects and close pairs. In the lower-redshift sample, we observe a number of galaxies with , , . These tend to have extended, lower-surface brightness star-forming regions, reminiscent of local disk galaxies (Figure 10).
5.1. FUV Morphological Classification
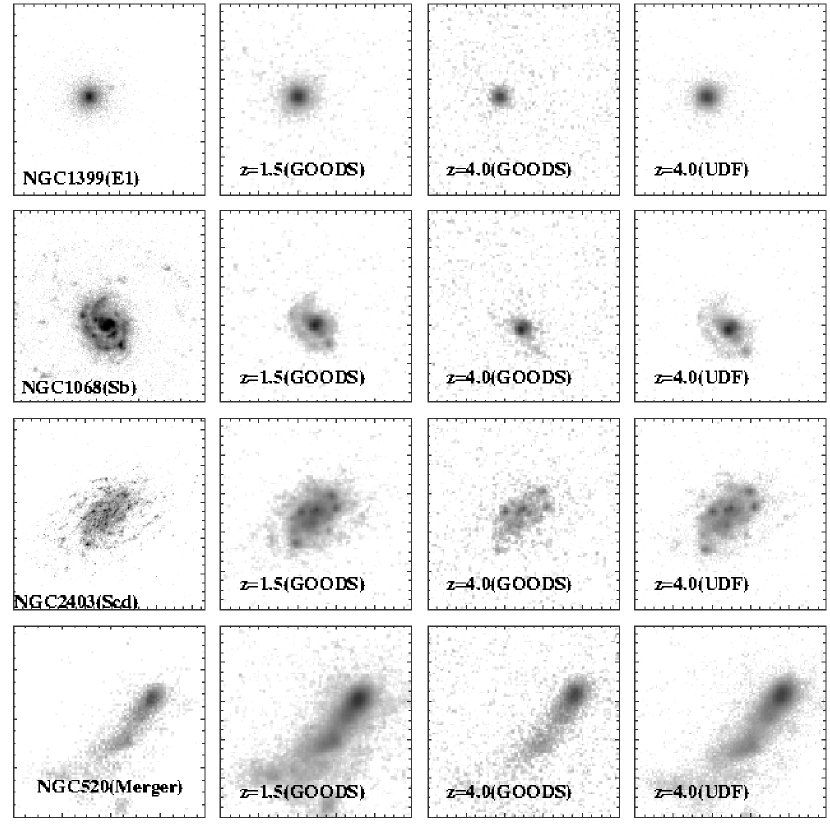
Although we are able to robustly measure the rest-frame FUV morphologies of our and samples, we cannot simply apply the quantitative classification criteria that was originally developed for the optical morphologies of local galaxies. Young star-forming populations completely dominate the rest-frame FUV morphologies of local galaxies, while old or dust-enshrouded stellar populations all but disappear. Thus the FUV morphologies of normal galaxies appear significantly more disturbed than their optical morphologies (Giavalisco et al. 1996, Hibbard and Vacca 1997; Goldader et al. 2002). In order to re-calibrate our merger classification criteria, we have examined the FUV morphologies of four bright well-resolved galaxies observed by the GALEX Nearby Galaxy Survey. While a detailed study of a much larger sample of galaxies is needed, our preliminary work here in combination with our bulge and disk simulations provides a check on our revised FUV morphology classifications.
The GALEX FUV images of NGC1399 (E1), NGC1068 (Sb), NGC2403 (Scd), and NGC520 (Arp 157, merger) have been artificially redshifted to and , convolved with the ACS PSF simulated using TinyTim, and added to the GOODS , , and UDF sky background (Figure 8). Because the absolute of the local galaxies are typically and would be undetectable at , the artificially redshifted galaxies have been brightened to . We have not applied any K-corrections to the images. We have measured the morphologies of the artificially redshifted galaxies as they appear at and and plotted their , , and values in Figure 5-7. The elliptical NGC1399 (circle) has , and , in rough agreement with our bulge simulations (upper right-hand box). The Sb NGC1068 (triangle) has , , and , which also agrees with our bulge simulations. The Scd NGC2403 (square) has , , and . This gives a slightly higher and values than our smooth exponential disk simulations (lower left-hand box), as might be expected for a real spiral with bright star-forming knots. The merger NGC520 (star) has , , and . NGC520 has been classified as an intermediate stage merger of two gas-rich spirals (Hibbard & van Gorkum 1996), and only one of its nuclei is visible in the FUV.
Based on the redshifted GALEX images, our bulge and disk simulations, and visual inspection, we have classified the and FUV morphologies into three types. Major-merger candidates such as close pairs and/or objects with multiple bright nuclei or bright tidal tails have (left shaded region of Figure 5). Bulge-dominated systems (E-Sb) are those with and (upper right shaded region of Figure 5). Galaxies which do not match any of these criteria are called “transition” objects. We stress that this initial classification scheme is more conservative than that of LPM04 because of the lack of a large calibration sample of FUV galaxy images and will only identify major mergers in their most morphologically-disturbed stage. We expect that some of the transition objects will be minor-mergers and post mergers, as well as late-type star-forming disks which appear knotty in the rest-frame FUV. We find that -based classifications often disagree with those based on , as is less robust at small sizes and is less sensitive to substructure (Figures 6 and 7).
| Sample | Type | Nobs | Fraction | Nobs | Fraction | Nobs | Fraction | ||
|---|---|---|---|---|---|---|---|---|---|
| GOODS | Total | 11 | 25 | ||||||
| Mergers | 2 | 0.47 (0.18) | 3 | 0.21 (0.12) | |||||
| Bulges | 3 | 0.19 (0.27) | 8 | 0.23 (0.32) | |||||
| Other | 6 | 0.34 (0.55) | 14 | 0.56 (0.56) | |||||
| UDF | Total | 5 | 19 | 22 | |||||
| Mergers | 3 | (0.6) | 1 | (0.05) | 1 | (0.05) | |||
| Bulges | 1 | (0.2) | 7 | (0.37) | 11 | (0.50) | |||
| Other | 1 | (0.2) | 11 | (0.58) | 10 | (0.45) | |||
| GOODS | Total | 3 | 23 | 28 | |||||
| Mergers | 1 | (0.33) | 4 | (0.17) | 5 | (0.18) | |||
| Bulges | 2 | (0.66) | 4 | (0.17) | 8 | (0.30) | |||
| Other | 0 | (0.00) | 15 | (0.65) | 16 | (0.57) | |||
| GOODS | Total | 2 | 8 | 13 | |||||
| Mergers | 1 | (0.5) | 1 | (0.125) | 0 | (0.0) | |||
| Bulges | 0 | (0.0) | 1 | (0.125) | 2 | (0.15) | |||
| Other | 1 | (0.5) | 6 | (0.75) | 11 | (0.85) | |||
Note. — The fractions in parentheses are the number of galaxies in the each morphological bin divided by the total measured objects in each sample and have not been corrected for incompleteness.
5.2. Merger and Spheroid Fractions at and
In Table 1, we give the observed merger and bulge fractions for our UDF and GOODS LBGs, the GOODS star-forming galaxies, and the artificially redshifted sample. At , the observed fraction of merger candidates is similar for all samples ( 10% - 20%). In Figure 3, we showed that the GOODS and the UDF LBG samples probe different parts of the luminosity function, while the UDF and samples are better matched. In this section, we will use the combined GOODS and UDF LBG samples to constrain the morphological distribution of star-forming galaxies, but use only the UDF and samples to constrain any evolution with redshift.
If we classify all objects with as on-going major merger candidates, the observed major merger fraction at is 14% for GOODS Bdrops (5/36) and 10% for UDF Bdrops (5/46). However, we have not corrected this fraction for incompleteness. In order to do a rough incompleteness correction, we have visually inspected the LBGs with and magnitudes brighter than 25. These objects have ″and were excluded from our original sample because of their low surface brightness and . Fifteen out of the 25 bright excluded objects were visually classified as disturbed, therefore it is possible that we are missing a significant fraction of large, bright but lower-surface brightness merger candidates. Four of these objects were visually classified as bulge-dominated. We have also excluded a large number of low-surface brightness GOODS LBGs at . Examination of the UDF LBGs at the same magnitude and sizes indicates that % of the excluded GOODS LBGs with are likely to be major merger candidates and are likely to be bulge-dominated. If we correct the GOODS LBG merger fraction for these rough incompleteness estimates, we find that average fraction of major-merger candidates is for all LBGs with , ″. If we consider only the brightest LBGs with , ″, the major-merger fraction could be as high as % once incompleteness effects are included. However, our corrections are highly uncertain, we do not account for LBGs which are undetected, and the number of bright LBG is small (16). Nevertheless, these may be considered rough upper limits to the morphologically-determined merger fraction for star-forming galaxies.
It is unclear whether our major-merger fraction for LBGs is consistent with previous high-redshift quantitative morphology studies based on the rotational asymmetry parameter. Conselice et al. (2003) found a 50% merger fraction for galaxies at based on a sample of 10 objects in the HDFN. If we assume , then our merger fraction estimate of 25% is about a factor of two lower for the same magnitude range () based on a sample of 60 LBGs in GOODS and UDF. However, at () our visual classification suggests that are disturbed objects, so there may be a trend towards higher merger fractions at brighter luminosities.
We find that a significant fraction of objects have morphologies consistent with spheroidal morphologies: 11/36 of the GOODS LBGs and 19/46 of the UDF LBGs lie within the spheroid criteria in space. Brighter than , roughly 30% of the GOODS and UDF galaxies appear to be bulges. Many of the UDF spheroids are fainter than (11/22). This is in contrast to the galaxies, of which only 2/15 of the artificially redshifted sample are bulge-like.
The remaining of the galaxies in the high-redshift samples have higher and than expected for smooth disks or bulges but lower values than the major-merger candidates. Some of these objects lie close in to the artificially-redshifted FUV image of late-type spiral NGC2403, therefore many may be star-forming disks. In the local universe at optical wavelengths, higher and values are indicative of merger signatures such as very bright nuclei and tidal tails, and it is also possible that a fraction of the transitional objects are minor-mergers or post-merger systems which are disturbed but do not possess bright multiple nuclei and high values.
The objects are more likely to fall into this transitional class than the UDF LBGs (60% of the sample and 70% of the artificially redshift sample). Also, the distributions of the transitional objects are slightly different at the two epochs: less than 5% (1/46) of the observed UDF sample has , as opposed at lower redshift ( 10/55 of the sample and 5/23 of the artificially redshifted sample). Low values usually indicate disk-like galaxies with more uniform surface brightness profiles. Is the lack of low galaxies at high redshift the result of an observational bias? We clearly select against large disks because of their low-surface brightnesses. However the lower-redshift sample has low objects with sizes, total magnitudes, and effective surface brightnesses which should have been detectable in the UDF (Fig 3). Our artificial redshift simulations suggest that the detected fraction of low objects should not change due to redshift-dependent selection effects.
The slightly lower Gini coefficients, concentrations, and second-order moments at may be partially a result of larger dust obscuration. Dust may have significant effect on the observed morphologies in the FUV than at longer wavelengths. In a study of local ULIRGs with HST STIS images in the FUV/NUV and WFPC2 and NICMOS images at optical and near-infrared wavelength, Goldader et al. (2002) found than many star-forming knots were obscured in the FUV/NUV, resulting in substantial changes in the observed morphologies and light distributions. The Lyman break galaxies may not suffer from large dust extinction because Lyman break technique automatically selects blue objects with low to moderate extinctions; however, the sample is likely to possess dust and have higher internal color dispersions. In a study of the internal FUV-optical color dispersions of Hubble Deep Field North and samples, Papovich et al. (2005) found that the lower redshift sample had significantly more internal color dispersion than the high redshift sample, a result of either patchier dust distributions or larger spatial dispersions in the age of the stellar populations.
5.3. Colors and UV Slope
The southern GOODS field (CDFS) has deep ground-based near-infrared imaging in , , with the ISAAC camera at the VLT (Vandame et al 2004). The GOODS ACS images were degraded to the ISAAC image resolution, and matched aperture photometry was obtained for the CDFS/UDF galaxies (Dahlen et al. 2005). Eight GOODS-S LBGs and twelve UDF LBGs (one of which is also in the ISAAC-detected GOODS LBG sample) from our , were detected in the ISAAC image and 16 GOODS-S galaxies were detected in the ISAAC image. We have examined the rest frame isophotal magnitudes ( and for and samples), rest-frame isophotal colors, and rest-frame isophotal colors as a function of galaxy morphology in Fig. 12 and 13. At , the color corresponds to 1700Å - 4400Å, while at , the color corresponds to 1740Å - 4400Å. We use the rest-frame colors as a proxy for the UV spectral slope (, Calzetti et al. 1994), using the ISAAC-degraded isophotal colors ( rest-frame 1700Å - 2200Å) for the galaxies and using the ACS isophotal colors ( rest-frame 1740Å - 2500 Å) for the galaxies.
We find no strong correlation of rest-frame 4400Å luminosity with FUV galaxy morphology for either sample (upper panels, Fig. 12 and 13). We find that majority of LBGs have . There are two red LBGs with ; such red rest-frame colors indicate strong 4000Å breaks and relatively old stellar populations ( Gyr), while the bluer colors of the majority of the LBGs indicate younger stellar populations. The blue LBGs show no obvious correlation of rest-frame color or UV slope ( or rest-frame ) with , or . The two red LBGs with have morphologies consistent with spheroids () and are also the brightest objects in the -band sample. The sample has similar colors but show steeper UV slopes ( or rest-frame ), implying either larger dust extinctions or older ages. There are no obvious color-morphology trends. The reddest object in the sample is also consistent with a bulge-like morphology ().


6. DISCUSSION
We find no strong evolution in the rest-frame FUV morphologies of star-forming galaxies between and , with a difference in look-back times of roughly 3 billion years. We see subtle changes in the fraction of spheroids and low disk-like objects, but the fraction of objects with bright multiple nuclei is indistinguishable for the two samples. At first glance, this result is somewhat surprising given the large time difference between the two observed epochs and the apparent increase in dust extinction at later times.
However, the dominant mode of star formation at both epochs is expected to be collisional starbursts triggered minor-mergers – 45% of at and 70% of at (SPF01). Therefore many FUV-bright galaxies at both epochs are likely to be minor mergers which exhibit a dominant bright nucleus with a disturbed morphology. In fact, this is what we find for both our and samples. Over half of the galaxies have been classified as “transition” objects between the spheroidal morphologies and the double-nucleated major-merger candidates. While it is likely that some of these transition galaxies are post-major mergers or knotty star-forming disks, a significant fraction are likely to be minor mergers.
We also find very similar fractions of major merger candidates at both epochs. Our UDF major-major candidate fraction of observed star-forming galaxies is for , while the major-merger candidate fraction is over the same luminosity range. We caution that these observed fractions are not “merger rates”; in order to calculate a true merger rate, we must correct for the selection biases in our sample against low-surface brightness or low star-formation objects as well as the probability and timescales for observing mergers with . As we discussed in §2, identifying non-star-forming galaxies at these epoch is challenging, therefore we limit our analysis to star-forming galaxies only. The probability of observing a merging system during a period of disturbed morphology will depend on a number of factors including the initial conditions of the merger system (mass ratio, gas fraction, orbital parameters), the viewing angle, and the timescale of the merger. A large suite of hydro-dynamical merger simulations required to calculate this probability are currently being analyzed (Cox et al. 2005, Jonsson et al. 2005, Lotz et al. in prep). From our initial analysis of gas-rich major merger simulations, we expect equal mass merging spirals on a prograde orbit with a gas-fraction equal to 0.52 to have for Myr.
The number of major mergers per halo per Gyr is predicted to be 15% at and 25% at , where the minimum halo circular velocities are 50 km s-1 (Gottlöber, Klypin, & Kravtsov 2001). If number of detected star-forming galaxies per typical halo is and does not change strongly from to , then our results are roughly consistent with the predicted major merger rate for halos. Given that our samples are fairly small, and that we have not adjusted the observed major merger fractions for undetected non-star-forming galaxies, it is surprising that our numbers are so consistent with theory. Clearly a more detailed comparison between the merger rates and morphology distribution between hierarchical models and the data is needed that takes into account the many selection effects and biases.
At later times, quiescent star-formation should become increasingly important. SPF01 predict that 40% of star-formation density occurs in a quiescent (disk-star formation) mode at as compared to 20% at . This suggests that the fraction of FUV-bright disk galaxies will increase at later epochs. While we find relatively few “smooth” disks at either epoch, there are more objects with at which are consistent with low-surface brightness disks (see Figure 11) than at . These disk candidates make up of the entire sample and a third of the transition objects at that epoch.
Finally, the observed fraction of star-forming galaxies with spheroidal morphologies is similar at both epochs. However, when the sample is artificially redshifted to the fraction of spheroids in the faintest bin is significantly lower than that observed in the UDF sample. If these bulges are only formed as the end-stage of a major merger, then similar fractions would be expected. However, if minor-mergers and interactions also produce blue bulges (Kannappan, Jansen, & Barton 2004), then one might expect significantly higher rates of star-forming spheroids at higher redshift given the increased importance of minor-mergers at those times. On the other hand, there may not be enough time before for significant numbers of proto-bulges to form via minor-mergers, as the timescale for a minor merger is 2 Gyr (Cox 2004).
Thus the observed distributions of star-forming galaxy FUV morphologies and the weak evolution between and appears to be generally consistent with rates of major and minor mergers and the importance of quiescent star-formation predicted at those epochs by hierarchical galaxy evolution models. However, we caution that we have largely ignored the morphological effects of dust and the evolution of typical dust extinction with redshift. The colors suggest that the sample is more extincted than the the LBGs, as might be expected if the galaxies are chemically evolving with time. Strong dust extinctions are likely to hide regions of intense star formation, and shift observed morphologies to lower and possibly lower and values, as well as remove some heavily-extincted objects from our samples altogether. Nevertheless, since the observed morphologies does change significantly from and , increased dust does not appear to dominate the observed FUV morphologies for moderate extinctions. We also caution that our conclusions here only apply to galaxies which have sufficient star-formation to meet the LBG color-criteria at and to have emission-line determined redshifts at . We are most certainly missing galaxies at both epochs with no or strongly enshrouded star-formation.
7. SUMMARY
1) We find no significant difference between the rest-frame FUV morphological distributions of GOODS and UDF LBGs samples. Lyman break galaxies with morphologies consistent with on-going major mergers make up of the GOODS and UDF selected samples. A significant fraction of the LBGs appear to have relatively undisturbed bulge-like FUV morphologies (). The remaining have and values higher than expected for smooth exponential disks or bulges but do not possess double nuclei, and could be a mixture of star-forming disk, minor-mergers, and post-merger systems. The observed major-merger fraction and large number of minor-merger candidates are consistent with current numerical (Gottlöber et al. 2001) and semi-analytic model predictions (Somerville et al. 2001) for high redshift galaxies.
2) The star-forming sample has rest-frame FUV morphologies which are not significantly different from the UDF galaxies, with similar fractions of major-merger candidates. The lower redshift sample does possess slightly more objects with lower and slightly lower and higher values, implying more extended, lower surface brightness disk-like star-forming regions, as well as a smaller fraction of faint spheroids. This is also roughly consistent with the major-merger rates and the increased importance of quiescent (disk) star-formation at predicted by current hierarchical models.
3) The two LBGs with rest-frame colors consistent with strong 4000Å breaks and Myr stellar populations have bulge-like morphologies, as does the reddest galaxy. The UV slopes of the lower redshift sample are significantly steeper than those of the LBGs. Although dust extinction may be more important in the samples, the apparent lack of evolution in FUV morphology since suggests that moderate extinctions do not strongly bias the observed FUV and values. High-resolution rest-frame optical morphologies for large samples of high redshift objects are needed to constrain the morphologies of galaxies which are heavily dust-extincted or not forming stars.
We thank the anonymous referee for his/her suggestions which improved this paper. We would like to acknowledge the GOODS team for the ISAAC-ACS matched CDFS photometric catalog, and the ESO/GOODS, the TKRS, and VIRMOS teams for making their redshift catalogs publicly available. We would also like to thank C. Conselice, S. M. Fall, C. Papovich, S. Ravindranath, and R. Somerville for their comments on this manuscript. Support for this work was provided by NASA grant NAG5-11513 and NSF Grant AST-0205738. The GALEX data presented in this paper were obtained from the Multi-mission Archive at the Space Telescope Science Institute (MAST). STScI is operated by the Association of Universities for Research in Astronomy, Inc., under NASA contract NAS5-26555. Support for MAST for non-HST data is provided by the NASA Office of Space Science via grant NAG5-7584 and by other grants and contracts.
References
- (1) Abraham, R., Tanvir, N.R., Santiago, B.X., Ellis, R.S., Glazebrook, K., & van den Bergh, S. 1996, MNRAS, 279, L47
- (2) Abraham, R., & van den Bergh, S. 2001, Science, 293, 1273
- (3) Abraham, R., van den Bergh, S., & Nair, P. 2003, ApJ, 588, 218
- (4) Bertin, E., & Arnouts, S. 1996, A&AS,. 117, 393
- (5) Bouwens, R., Illingworth, G. D., Blakeslee, J.P., Broadhurst, T.J., & Franx, M. 2004, ApJ, 611, L1
- (6) Calzetti, D., Kinney, A.L., & Storchi-Bergman, T. 1994, ApJ, 429, 582
- (7) Casertano, S. et al. 2000 AJ, 120 2747
- (8) Chapman, S. C., Windhorst, R., Odewahn, S., Yan, H., & Conselice, C. 2003, ApJ, 599, 92
- (9) Cimatti, A., et al. 2004, Nature, 430, 184
- (10) Conselice, C. 2003, ApJS, 147, 1
- (11) Cox, T.J., Jonsson, P., Primack, J.R., & Somerville, R. 2005, astro-ph:/0503201
- (12) Daddi, E., Broadhurst, T., Zamorain, G., Cimatti, A., Rottering, H. & Renzin, A. 2001, A&A, 376, 825
- (13) Daddi, E. et al. 2004, 600, L127
- (14) Dahlen, T. et al. 2005, ApJ, submitted.
- (15) Dickinson, M. 1999, in After the Dark Ages: When Galaxies were Young (the Universe at 2 z 5). eds. S. Holt & E. Smith, (College Park, Maryland: American Institute of Physics Press), p. 122
- (16) Dickinson, M., Papovich, C., Ferguson, H.C., & Budavari, T. 2003,
- (17) Giavalisco, M., & Dickinson, M. 2001, ApJ 550, 177
- (18) Giavalisco, M., Steidel, C., & Szalay, A.S. 1994, ApJ, 425, 5
- (19) Giavalisco, M., Steidel, C., & Macchetto, F.D. 1996, ApJ, 470, 189
- (20) Giavalisco, M. 2002, ARAA, 40, 579
- (21) Giavalisco, M. et al. 2004, ApJL, 600, L1
- (22) Goldader, J.D., Meurer, G., Heckman, T.M., Seibert, M., Calzetti, D., & Steidel, C. 2002, ApJ, 568,651
- (23) Gottlöber, S., Klypin, A., & Kravstov, A.V. 2001, ApJ, 546, 223
- (24) Ferguson, H.C., Dickinson, M., & Papovich, C. 2002, ApJ, 569, L65
- (25) Ferguson, H.C., et al. 2004, ApJL, 600, L107
- (26) Hibbard, J.E., & Vacca, W.D. 1997, AJ, 114, 1741
- (27) Jonsson, P., Cox, T.J., Primack, J., & Somerville, R. 2005, astro-ph:/0503135
- (28) Kannappan, S.J., Jansen, R., & Barton, E. J. 2004, AJ, 127, 1371
- (29) Le Fèvre, O. et al. 2004, A&A, 417, 839
- (30) Lotz, J.M., Primack, J., & Madau, P. 2004, AJ, 128, 163
- (31) Lotz, J.M., et al., in prep
- (32) Lowenthal, J.D., et al. 1997, ApJ, 481, 673
- (33) Mao, H.J., Mo, S., & White, S.D.M. 1998, MNRAS, 295, 319
- (34) Madau, P., et al. 1996, MNRAS, 283, 1388
- (35) Mihos, C.J. & Hernquist, L. 1994, ApJ, 425, L13
- (36) Mihos, C.J. & Hernquist, L. 1996, ApJ, 464, 641
- (37) Moustakas, L. A., et al. 2004, ApJ, 600, L131
- (38) Papovich, C. et al. 2004, ApJ, 600, L111
- (39) Papovich, C., Dickinson, M., Giavalisco, M., Conselice, C., & Ferguson, H. 2005, ApJ, in press, astro-ph/050188.
- (40) Steinmetz, M., & Navarro, J. 2002, New Astronomy, 7, 155
- (41) Steidel, C., Giavalisco, M., Dickinson, M., & Adelberger, K. 1996, AJ, 462, 17
- (42) Somerville, R. S., Primack, J.R., & Faber, S.M. 2001, MNRAS, 320, 504
- (43) Toomre, A. 1977, IAUS, 58, 347
- (44) Vandeme, et al. 2004 in prep.
- (45) Vanzella, E. et al. 2005, A&A, 434, 53
- (46) Wirth, G. D., et al. 2004, AJ, 127, 3121