Chemical Abundances of DEEP2 Star-forming Galaxies at 11affiliation: Based, in part, on data obtained at the W.M. Keck Observatory, which is operated as a scientific partnership among the California Institute of Technology, the University of California, and NASA, and was made possible by the generous financial support of the W.M. Keck Foundation.
Abstract
We present the results of near-infrared spectroscopic observations for a sample of 12 star-forming galaxies at , drawn from the DEEP2 Galaxy Redshift Survey. H, [OIII], H, and [NII] emission-line fluxes are measured for these galaxies. Application of the and strong-line abundance indicators implies average gas-phase oxygen abundances of % solar. We find preliminary evidence of luminosity-metallicity and mass-metallicity relationships within our sample, which spans from to in rest-frame optical luminosity, and from to in stellar mass. At fixed oxygen abundance, these relationships are displaced from the local ones by several magnitudes towards brighter absolute -band luminosity and more than an order of magnitude towards larger stellar mass. If individual DEEP2 galaxies in our sample follow the observed global evolution in the -band luminosity function of blue galaxies between and (Willmer et al. 2005), they will fade on average by magnitudes in . To fall on local and relationships, these galaxies must increase by a factor of in between and , and by factor of two in both stellar mass and metallicity. Such concurrent increases in stellar mass and metallicity are consistent with the expectations of a “closed-box” chemical evolution model, in which the effects of feedback and large-scale outflows are not important. While star-forming galaxies have similar [NII]/Ha ratios and rest-frame optical luminosities to those of the DEEP2 galaxies presented here, their higher ratios and clustering strengths indicate that they will experience different evolutionary paths to . Finally, emission line diagnostic ratios indicate that the DEEP2 galaxies in our sample are significantly offset from the excitation sequence observed in nearby H II regions and SDSS emission-line galaxies. This offset implies that physical conditions are different in the H II regions of distant galaxies hosting intense star formation, and may affect the chemical abundances derived from strong-line ratios for such objects.
Subject headings:
galaxies: evolution — galaxies: high-redshift – galaxies: abundances1. Introduction
While the CDM framework provides detailed predictions for the formation of dark matter structure, deep questions remain about the baryonic physics of galaxy formation. Using statistical samples of galaxies, it is now possible to apply critical observational tests to numerical simulations and semi-analytic models of galaxy formation and evolution over almost 90% of the age of the universe. Important tests include the determination of the global star-formation-rate and stellar-mass density as a function of redshift (Schiminovich et al. 2005; Steidel et al. 1999; Giavalisco et al. 2004; Bunker et al. 2004; Dickinson et al. 2003; Fontana et al. 2004; Drory et al. 2005). Evolution in the abundance of heavy elements in galaxies and the intergalactic medium (IGM) provides an independent probe of the star-formation history of the universe (Pei et al. 1998), as the degree of metal enrichment reflects the integrated products of star-formation. The relationships among chemical enrichment, luminosity, and mass in galaxies as a function of redshift highlight the importance of star-formation feedback (Tremonti et al. 2004; Kobulnicky et al. 2003). Furthermore, the degree of chemical enrichment in distant star-forming galaxies grants insight into how populations of high-redshift galaxies map onto samples in the local universe (Shapley et al. 2004). Chemical abundances therefore serve as a fundamental metric of the galaxy formation process.
The rest-frame optical integrated spectra of star-forming galaxies contain several strong emission lines, including [OII], H, [OIII], H, [NII], and [SII]. The relative strengths of these features indicate the physical conditions in the H II regions contained in the galaxies. One of the most important quantities derived from the relative emission line strengths is the average H II-region metallicity. Both detailed photo-ionization models and empirical calibrations have been used to relate the ratios of strong emission lines to chemical abundances (Pagel et al. 1979; Evans & Dopita 1985; Kewley & Dopita 2002; Pettini & Pagel 2004). Locally, the metallicities of star-forming galaxies have recently been measured by Tremonti et al. (2004), who use a sample of emission-line spectra of galaxies selected from the Sloan Digital Sky Survey (SDSS) to investigate the luminosity-metallicity and mass-metallicity relationships. This sample is two orders of magnitude larger than previously existing ones, and serves as a robust local comparison point for evolutionary studies. At intermediate redshifts (), there are several different samples of star-forming galaxies with chemical abundances measurements, the largest of which is presented in Kobulnicky & Kewley (2004), with galaxies at . Near-infrared spectroscopic observations of rest-frame optical emission lines have been obtained for galaxies drawn from several recently-discovered populations at . There are now rough chemical abundance measurements for objects selected by their rest-frame UV luminosities and colors (Pettini et al. 2001; Shapley et al. 2004), submillimeter emission (Swinbank et al. 2004; Tecza et al. 2004), or observed colors (van Dokkum et al. 2004, 2005). However, there is still a glaring gap in our knowledge of the metallicities of star-forming galaxies in the redshift range , an exciting era that hosts the emergence of the Hubble sequence of disk and elliptical galaxies and the build-up of most of the stellar mass in the universe (Dickinson et al. 2003).
Here we present near-infrared spectroscopic observations for a pilot sample of 12 star-forming galaxies in this critical redshift range. The galaxies are drawn from the DEEP2 Galaxy Redshift Survey (Davis et al. 2003), which contains galaxies at , an unprecedented spectroscopic sample for addressing this large gap in our knowledge of galaxy evolution. At these redshifts, the H II region lines of interest are shifted to m, where bright sky lines and regions of strong atmospheric absorption cause much of the spectral real-estate to be unavailable. Therefore, the precise [OII] redshifts provided by the DEEP2 survey are crucial for selecting objects whose H, [OIII], H, and [NII] lines will fall at optimum wavelengths with respect to sky lines and atmospheric absorption. We have found that two relatively narrow redshift windows within the DEEP2 survey are ideal in this respect: and . We measure H and [NII] fluxes for the entire pilot sample, and additional [OIII] and H fluxes for a subsample of five. Even with a small sample, we discern significant evolution between and in the relationships among chemical abundance, luminosity and mass, as well as evidence for striking differences in the H II region physical conditions in distant star-forming galaxies. These results highlight the promise of future chemical abundance studies using near-infrared spectrographs with wider simultaneous wavelength baselines and multi-object capabilities.
We describe the DEEP2 target sample, and near-IR spectroscopic observations and measurements in §2. In §3, we present the oxygen abundances derived from measurements of [OIII], H, H, and [NII] emission lines. Evolution in the luminosity-metallicity and mass-metallicity relationships is discussed in §4, while the evidence for differences in H II region physical conditions is presented in §5. Finally, in §6, we summarize our principal conclusions. A cosmology with , , and is assumed throughout.
2. Sample & Observations
2.1. DEEP2 Target Sample
The sample presented here was drawn from the DEEP2 Galaxy Redshift Survey (hereafter DEEP2; Davis et al. 2003). DEEP2 is a three-year project using 80 nights on the DEIMOS spectrograph (Faber et al. 2003) on the Keck II telescope to survey optical galaxies at . The DEEP2 survey was designed to study both large-scale structure and galaxy evolution in a large cosmic volume and is producing a dense mapping of the spatial locations of 40,000 galaxies brighter than with redshifts . Photometric data were taken in and -bands with the CFH12k camera on the 3.6-m Canada-France-Hawaii telescope (see Coil et al. 2004b, for details). Follow-up near-IR -band photometry has been obtained in portions of all four DEEP2 survey fields. More than 15000 DEEP2 galaxies with spectroscopic redshifts have measured magnitudes, which, when combined with optical data, probe stellar masses and stellar population parameters (Bundy et al., in preparation). The DEEP2 spectroscopic dataset consists of DEIMOS spectra typically covering the spectral range Å. The overall success rate in measuring precise spectrosopic redshifts is %. The [OII] emission doublet is used to find redshifts over the entire DEEP2 range for more than % of the galaxies in the sample with successful spectroscopic identifications. The remainder of the spectroscopic sample have redshifts identified based on stellar absorption lines alone.
To estimate accurate chemical abundances and H II region physical conditions, observations of several strong H II region emission lines are required – ideally at least [OII], H, [OIII], H, and [NII]. At , however, the only strong H II region emission feature contained in the DEIMOS window is the [OII] doublet. To measure longer-wavelength emission lines at , we therefore require near-IR spectroscopy. Because of the effects of strong atmospheric absorption in the near-IR, the full set of H, [OIII], H, and [NII] is not available for all redshifts between and . We therefore targeted two differential redshift windows within the larger DEEP2 redshift distribution: and . Within these redshift windows, it is possible to measure all of the emission lines of interest in the near-IR. Furthermore, we preferentially observed galaxies with the maximum number of emission lines free from contamination by bright sky OH lines, based on previously-determined [OII] redshifts. The pilot sample presented here contains 3 galaxies at and 9 galaxies at . The disparity in size of the two subsamples was a result of limited observing time, and will be rectified with future observations.
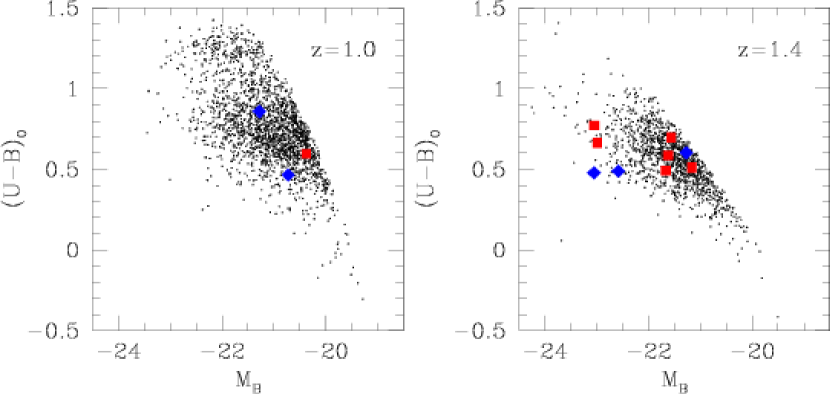
Galaxies were selected to span the full range of absolute -luminosities in the DEEP2 survey, from to , in order to probe the metallicity-luminosity relationship over an interesting dynamic range. As shown in Figure 1, the larger set of galaxies does span the full range of in the DEEP2 sample available at that redshift, while the smaller set of targets happens to be drawn from the faint end of the luminosity function. All targets have restframe colors blueward of the minimum in the observed color bi-modality in the DEEP2 survey. Finally, in order to maximize the longslit observing efficiency, we mostly targeted pairs of galaxies in each redshift window, with separations of up to 25”.
2.2. Near-IR Spectroscopy
The Keck II/NIRSPEC observations were conducted on 5 and 24 October 2004. At , the full complement of H, [OIII], H, and [NII] cannot be observed simultaneously – two filter setups are required to cover all the lines. For objects at , we used the NIRSPEC 5 filter (similar to band) to observe H and [NII], and the NIRSPEC 2 filter (similar to a blue band) to observe [OIII] and H. For objects at , we used the NIRSPEC 4 filter (similar to a red band) for observations of H and [NII], and the NIRSPEC 1 filter () for observations of [OIII] and H. For all observations, we used a 076 42” long-slit. The resulting spectral resolution determined from sky lines is Å in the NIRSPEC 5 and NIRSPEC 4 filters (relevant for H and [NII] measurements) and Å in the NIRSPEC 2 and NIRSPEC 1 filters (relevant for [OIII] and H measurements). Blind offsets from nearby bright stars were used to acquire our target objects, which are too faint to acquire directly onto the slit. In most cases, the slit position angle was determined by the attempt to fit two galaxies on the slit. On 5 October, in the face of intermittent failures of the NIRSPEC field rotator, whose proper functioning was required to target pairs, we could only acquire single objects in the following cases: 32020728, 42008219, 42059947. Targets were typically observed for 2 or 3 900 seconds in each filter. 111Exceptions are 42008627, which was only detected in a single 900 second exposure, out of three attempts, due to confirmed image rotator problems; and 32025514, for which data were combined from two separate nights, totaling seconds. 32025514 was reobserved in order to detect its pair companion, 32100778, which was missed on the first attempt, due to rotator problems.
Photometric conditions and seeing were variable throughout both nights, with seeing ranging from 05 to 10 in the near-IR. We targeted a total of 12 DEEP2 galaxies, successfully measuring [NII] and H for the entire sample, and [OIII] and H for 5 out of 12. For the remaining seven objects without measured [OIII] 5007/H ratios, observations of those lines were either not attempted because of time constraints, or affected by significantly (and variable) non-photometric conditions. A summary of the observations including target coordinates, redshifts, optical and near-IR photometry, and total exposure times is given in Table 1. The two-dimensional galaxy spectral images were then reduced, extracted to one dimension along with 1- error spectra, and flux-calibrated with observations of A stars, according to the procedures outlined in detail in Erb et al. (2003).
2.3. Measurements

One-dimensional, flux-calibrated NIRSPEC spectra are shown in Figures 2 and 3 for our entire sample. We show spectra for objects with the full set of [OIII], H, H, and [NII] emission lines in two NIRSPEC filters, as well as for objects with single-filter observations of [NII] and H alone. and [NII] emission line fluxes were determined by first fitting a one dimensional Gaussian profile to the higher S/N feature to obtain the redshift and FWHM (in wavelength). The redshift and FWHM were then used to constrain the fit to the [NII] emission line. This procedure is based on the assumption that the and [NII] lines have exactly the same redshift and FWHM, but that the line offers a higher S/N estimate of these parameters. The [NII] line was too faint to measure for most of the objects in our sample. [OIII] and H fluxes were determined with independent fits to the line centroids and widths. For most objects, the H, [OIII], and H redshifts agree to within ( km s-1 at ).

Though not the focus of the current work, we mention in passing that 10 out of 12 of the H linewidths for our sample are resolved and range from km s-1 up to a maximum of km s-1. Two additional galaxies have H linewidths narrower or equal to the instrumental resolution as estimated from the widths of sky lines. The sample median is km s-1. The median H linewidth is consistent with the median [OII] linewidth measured from the DEIMOS spectra of these objects. While slit position angles were chosen for the purpose of targeting two objects simultaneously, regardless of the continuum or [OII]-emission-line spatial extent or morphology, we find that three objects (32037003, 32028085, and 42055947) have spatially-extended and tilted emission-line profiles, indicative of rotation. Since we do not have detailed morphological information for our sample, we do not further interpret the tilted emission lines with a model for disk rotation.
The measured H fluxes range from to . The mean flux for the sample at is , corresponding to an H star-formation rate – uncorrected for dust extinction – of , using the calibration of Kennicutt (1998). The mean for the sample at is , which corresponds to an H star-formation rate of . These characteristic H star-formation rates are discussed further in section 5.2. The close consistency between the flux calibrations from standard stars taken on the two separate nights of observations indicates that the standard stars were observed under photometric conditions. The variability of conditions throughout the two nights therefore translates into lower limits on the measured H line fluxes and associated star-formation rates when the standard star calibrations obtained during photometric conditions are applied to our galaxy observations. Even in photometric conditions, there are several sources of systematic error affecting our absolute line flux measurements. These include imperfect centering of objects in the slit, variations in the quality of seeing, and light lost because of the mismatch between the slit width and the size of the DEEP2 targets, which are typically 05 in R-band (rest-frame near-UV) half-light radius. Erb et al. (2003) estimate that these sources of error amount to at least % in absolute flux. For the remainder of the discussion, we therefore emphasize the measured line ratios, [NII] 6584/H and [OIII] 5007/H, which should be unaffected by uncertainties in flux-calibration or the other systematics listed above. The uncertainty in these line ratios is dominated by random error at the level of %. Furthermore, since each line ratio is calculated from emission lines very closely spaced in wavelength, its value is independent of the magnitude of dust extinction. As shown in Table 2, the measured [NII] 6584/H ratios range from , with an average of . For the five galaxies with measured [OIII] and H fluxes, the average [OIII] 5007/H ratio is , ranging from . The average [NII] 6584/H ratio for these five galaxies is 0.24, consistent with the average for the total sample of 12. Hereafter, we shall generally use “[NII]/H” to refer to the measured ratio between [NII] and H, and “[OIII]/H” for the measured ratio between [OIII] and H.
3. The Oxygen Abundance
In distant star-forming galaxies, measuring the relative strengths of strong emission lines is the only viable method for estimating the H II region gas-phase oxygen abundance (Kobulnicky et al. 1999; Pettini et al. 2001). The lines typically used include some subset of [OII] , H, [OIII] , H, and [NII] . Empirical relations between strong-line ratios and chemical abundance have been calibrated using local H II regions with measured electron temperatures, and therefore direct abundance determinations (Pettini & Pagel 2004). Application of these relationships at high-redshift rests on the assumption that the integrated spectra of distant galaxies with high star-formation rates can be treated equivalently to the spectra of individual local H II regions used to calibrate the strong-line abundance indicators. We will return to this question in section 5.
Pettini & Pagel (2004) demonstrate that a reasonably accurate estimate ( dex) of the H II region oxygen abundance is possible with measurement of the “” ratio log(([OIII] 5007/H)/([NII] 6584/H)). One major benefit of this abundance indicator over, e.g., the indicator R log(([OIII]+[OII])/H), is that is relatively independent of flux calibration and uncertainties in dust extinction, since it is derived from a pair of ratios of closely-spaced emission lines. With all of the systematic uncertainties in absolute line flux measurements described above, and including the variable photometric conditions that characterized our observing runs, the advantages of the indicator are significant. According to Pettini & Pagel (2004):
| (1) |
This relation holds for local H II regions with (or, according to the calibration, ), and arises from the fact that [OIII]/H decreases with increasing metallicity, while, at least up to solar metallicity, [NII]/H increases with increasing metal content. We derive oxygen abundances using the indicator for the five galaxies in our sample with [OIII]/H and [NII]/H measurements, as shown in Table 2. The average value of ([OIII]/H)/([NII]/H) implies an oxygen abundance of . This value corresponds to , when we compare with the solar value of (Allende Prieto et al. 2002; Asplund et al. 2004). The three galaxies at have systematically lower values, corresponding to higher oxygen abundances, than the two galaxies at . However, since the two galaxies at are less luminous, the difference in average O/H between the two subsamples most likely reflects the fundamental correlation between metallicity and luminosity, rather than redshift evolution. A larger sample will be required to draw further inferences.
Using the same H II region calibration sample, Pettini & Pagel (2004) show, in terms of log([NII] 6584/H), that:
| (2) |
The scatter around this relation is dex. It is valid for H II regions spanning from (or, according to the calibration, from ). For the total sample of 12 galaxies, including those with only [NII]/H, we calculate O/H based on the indicator alone. The results are listed in Table 2. As shown with detailed photoionization models (Kewley & Dopita 2002), the indicator is not sensitive to increasing oxygen abundance above roughly solar metallicity, so is not an ideal metallicity indicator. However, as long as we use the same empirical quantities for samples at other redshifts, we can still use to obtain crude information from our total sample of 12 galaxies about the evolution of fundamental scaling relationships between star-forming galaxy luminosity and metallicity , and between mass and metallicity . The average value of [NII]/H for the sample is 0.25, implying an oxygen abundance of , which corresponds to . In our total sample, the three galaxies have systematically lower [NII]/H ratios than the galaxies, but are also systematically fainter – consistent with the statistics in the smaller sample. Comparing oxygen abundances derived from versus those derived from , for the five galaxies with both measurements, we find that the -based oxygen abundances are systematically lower by dex. The difference is slightly larger for the three galaxies at , and may result from intrinsic differences in the H II region physical conditions in these galaxies. We will return to this point in section 5.
4. Luminosity-Metallicity and Mass-Metallicity Relationships
Both star-forming and early-type galaxies in the local universe follow strong correlations between rest-frame optical luminosity and the degree of chemical enrichment (Garnett & Shields 1987; Brodie & Huchra 1991). Perhaps a more fundamental correlation is the one observed between stellar mass and metallicity. For star-forming galaxies, these correlations have recently been measured over a factor of in stellar mass, 6 optical magnitudes and a factor of 10 in gas-phase oxygen abundance, using a sample of non-AGN emission-line galaxies culled from the SDSS (Tremonti et al. 2004). While the oxygen abundance increases fairly rapidly with increasing stellar mass at low mass, the relationship flattens at stellar masses of and above. Tremonti et al. (2004) interpret this result as evidence for galactic winds depleting the metal content of galaxies below a critical mass of , thereby lowering the associated effective yield. The effect of outflows, commonly referred to as “star-formation feedback,” is a crucial input to models of galaxy formation and may be required as a fairly generic ingredient in order to explain a wide range of observed phenomena, including the observed angular momentum in disk galaxies, the metal content in the IGM, the global stellar content in the local universe, and the amount of entropy in clusters. Measurement of the redshift evolution in the observed relationships among metallicity, luminosity, and stellar mass will provide powerful constraints on models of galaxy formation, and, in particular, star formation feedback.
4.1. Observed Evolution in the and Relationships
We now construct the relationships among oxygen abundance, absolute -magnitude, and stellar mass for our sample of DEEP2 galaxies, and compare with analogous relationships determined at lower redshift. Since there is considerable scatter among the calibrations of commonly used oxygen abundance indicators, a fair comparison of galaxy samples at different redshifts must be based on the same empirical strong-line indicator, using the same calibration. For a uniform comparison with the DEEP2 sample, we also apply the and indicators (Pettini & Pagel 2004) to the local SDSS comparison sample. These indicators require measurement of the full set of [OIII], H, H and [NII] for galaxies in each sample, all of which are available for the SDSS emission-line galaxies with , presented in Tremonti et al. (2004).
Absolute blue magnitudes, , are computed for SDSS galaxies based on observed -band magnitudes, with appropriate color- and -corrections to Johnson at (Tremonti et al. 2004). For the three DEEP2 galaxies presented here, an analogous procedure can be applied, as the observed -band is a very good match to rest-frame . However, for the 9 DEEP2 galaxies at , an extrapolation to observed m is required. For both and objects, we use the values from Willmer et al. (2005) based on optical data alone, and confirm their good agreement with estimates based on fits to the SEDs that span through rest-frame -band [-band] for the [] galaxies.
Stellar masses have been derived for SDSS galaxies, based both on spectral features including the 4000Å break and H Balmer absorption index, and broadband photometry, as described in Kauffmann et al. (2003b). The library of star-formation histories used to fit the SEDs of SDSS galaxies includes the possibility of past bursts as well as more smoothly declining star-formation histories. We derive stellar masses for the 9 DEEP2 galaxies in our sample with -band photometry, following the procedure outlined in Bundy et al. (2005). This method uses the same general Bayesian framework as the work of Kauffmann et al. (2003b), though only includes broadband photometry, and relatively simple star-formation histories. The observed SED of each galaxy is compared with a grid of synthetic SEDs from Bruzual & Charlot (2003), spanning a range of single-component, exponentially-declining star-formation histories, ages, and dust content. The -band ratio, stellar mass, and probability that the model represents the data are computed at each grid point. The probabilities are marginalized across the grid and binned by stellar mass, yielding a stellar mass probability distribution. We adopt the median and standard deviation of this distribution as the estimated stellar mass and uncertainty, respectively. To measure evolution in the relationship between mass and metallicity, we must establish that there are no systematic differences in the stellar masses derived using different techniques. As a test, we model a subset of 500 SDSS galaxies using the Bundy et al. technique, and find very good agreement – the average fractional stellar mass difference is . The scatter in the average stellar mass difference amounts to a little less than a factor of two, smaller than any of the evolutionary differences we report below. More importantly, though, there is no significant systematic difference in the two techniques used to model stellar masses. Finally, we note that SDSS stellar masses are derived assuming a Kroupa (2001) stellar initial mass function (IMF), while we assume the form of Chabrier (2003). These two IMF parametrizations yield roughly consistent stellar masses for the same SED.
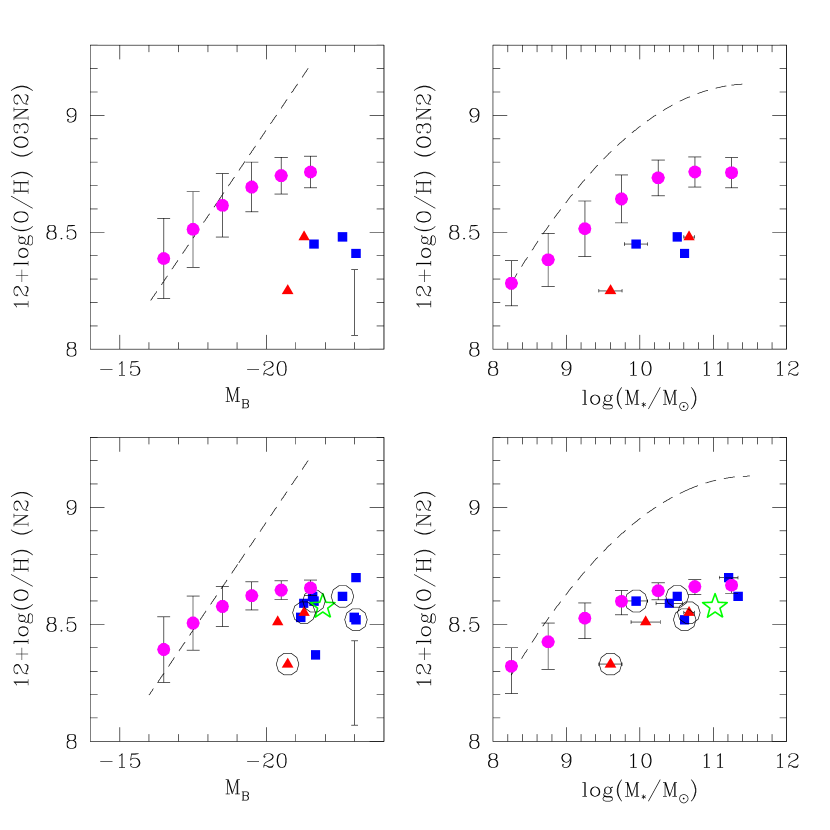
Figure 4 shows the relationships among gas-phase oxygen abundance, -band luminosity, and stellar mass for galaxies at different redshifts. In the top panels oxygen abundance is derived from the indicator, whereas the indicator is used in the lower panels. As described in section 3, the indicator saturates and is no longer very sensitive to increasing O/H at [NII]/H. While only 25% of the DEEP2 sample has [NII]/H, more than 75% of the SDSS sample of Tremonti et al. (2004) has line ratios in this regime. Given the luminosity and stellar mass ranges we are considering here, the -based plots are less sensitive to differences in metallicity in the SDSS sample at fixed luminosity or stellar mass. However, including -based abundances allows us to use our full sample of 12 DEEP2 objects, which span a larger range in luminosity and stellar mass, as well as the sample of galaxies presented in Shapley et al. (2004). The SDSS data have been binned in intervals of and , with the average value shown for each bin in luminosity and stellar mass. To demonstrate the importance of using the same empirical abundance indicator for each sample, we also plot the best-fit and relations from Tremonti et al. (2004). The O/H values used to derive these relationships come from models of the full set of strong line spanning in wavelength from [OII] to [SII], and are systematically higher than the and -based O/H abundances. The difference increases at increasing O/H.
Our current sample of galaxies is too small to determine the detailed form of trends among metallicity, luminosity and stellar mass in the manner of Tremonti et al. (2004). However, when the total sample of 12 [NII]/H measurements is divided into faint and bright subsamples, we find a higher average [NII]/H ratio for the bright subsample, a roughly one sigma difference. Dividing the sample into low and high stellar mass bins also indicates a higher [NII]/H ratio as a function of increasing stellar mass. Finally, we note that the galaxy, 32020728, is the faintest and least massive object among the sample of galaxies with measurements, and has the lowest inferred O/H abundance as well. In the future, it will be important to probe a large sample of objects over as large a magnitude and stellar mass range as possible, in order to confirm the nature of the trends that we have begun to trace with our small pilot sample. Despite the small size of our distant galaxy sample, we still discern significant evolution in at least the zeropoints of the relationships among metallicity, luminosity and stellar mass, as presented below. This evolution in and space can be used to understand how the star-forming galaxies relate to star-forming galaxies in the nearby universe.
First we consider evolution in the relationship between O/H and . Regardless of the indicator used, DEEP2 galaxies at are several magnitudes brighter than SDSS galaxies at fixed O/H. For a more meaningful comparison with SDSS galaxies, we use the subsample of DEEP2 galaxies with -based abundances. These galaxies have and . SDSS galaxies with comparable have , 5.2 magnitudes fainter! SDSS galaxies with comparable to the average of the DEEP2 sample have , 0.35 dex higher. Now we turn to the question of stellar mass. The DEEP2 sample with measurements have . SDSS galaxies with comparable have . SDSS galaxies with comparable stellar mass to the average of the DEEP2 sample have . While SDSS contains a significant fraction of galaxies with higher masses than the average among the DEEP2 sample, the inferred O/H does not significantly increase at stellar masses larger than . The flattening in the mass-metallicity relationship at high stellar mass reflects the physical properties of the galaxies (Tremonti et al. 2004), though the absolute value of O/H at which the trend flattens differs depending on which abundance indicator is used. According to the abundance scale adopted in Tremonti et al. (2004), the local M-Z relationship flattens at , whereas the -based scale indicates flattening at . This difference reflects the magnitude of systematic uncertainties among various strong-line calibrations in the high-metallicity regime.
Several groups have considered the evolution of the relationship at , primarily based on -based oxygen abundances. The largest sample of intermediate redshift galaxies with oxygen abundance measurements is contained in Kobulnicky & Kewley (2004), with 204 emission-line galaxies at drawn from the Team Keck Redshift Survey (TKRS). Of these, 38 galaxies with have both [OIII]/H and [NII]/H measurements, allowing a direct comparison with our DEEP2 sample. The TKRS subsample with [NII]/H measurements is roughly equidistant in lookback time between the SDSS and DEEP2 samples, and contains values at fixed O/H that are intermediate between those of our DEEP2 sample and SDSS galaxies. Specifically, galaxies in the TKRS subsample with have . Using for the total TKRS sample at , Kobulnicky & Kewley (2004) find that the intermediate-redshift galaxies are magnitudes more luminous at a given metallicity than their local counterparts. The evolution in the relationship at intermediate redshift is not resolved at the very luminous end, however, as both Lilly et al. (2003) and Kobulnicky et al. (2003) find little difference in the average metallicities of the most luminous () galaxies in their samples – even at – relative to local counterparts. Larger samples at both intermediate redshift and will help resolve this ambiguity. For now, though, we focus on the consistent picture of evolution provided by our DEEP2 sample, the TKRS galaxies with [NII]/H measurements, and the SDSS emission-line sample.
4.2. The Evolution of DEEP2 Galaxies
In order to explain the evolution in the and relationships observed for DEEP2 galaxies at and SDSS galaxies at , we make two key assumptions. First, we assume that the descendants of the DEEP2 galaxies with abundance measurements will be forming stars at . Accordingly, they should be included in the emission-line sample of Tremonti et al. (2004), and follow the and relationships observed among SDSS galaxies. This is a reasonable assumption, based on the clustering strength of blue DEEP2 galaxies with similar spectral and photometric properties. Coil et al. (2004a) find that DEEP2 galaxies with strong emission lines and also those with blue rest-frame optical colors have correlation lengths of comoving Mpc. The local descendants of the dark matter halos hosting such galaxies will cluster more like blue, emission-line galaxies in the Tremonti et al. SDSS sample, rather than red, absorption-dominated galaxies (Zehavi et al. 2005; Budavári et al. 2003; Adelberger et al. 2005b). Also, based on the relative evolution of the rest-frame -band luminosity functions of red and blue galaxies between and , it is reasonable to assume that a significant fraction of the blue DEEP2 galaxies will remain blue (Faber et al. 2005). Second, we assume that DEEP2 galaxies fade on average by mags between and . This degree of fading reflects the observed evolution of in both blue and red galaxy luminosity functions traced to by the DEEP2 and COMBO-17 surveys (Willmer et al. 2005; Faber et al. 2005).
Following these two assumptions, we shift the DEEP2 sample in luminosity by an amount that reflects the average evolution between and , mag. This shift implies at for the DEEP2 galaxy descendants. In order for these local counterparts to lie on the local relationship, the sample average oxygen abundance must increase by 0.35 dex to . SDSS galaxies with have average stellar masses of , twice the average stellar mass of our DEEP2 sample. Therefore, these possible DEEP2 descendants have stellar ratios a factor of higher on average than those at .
It is instructive to compare the concurrent increases in O/H and stellar mass, described above, with the predictions of chemical evolution models. According to a simple “closed box” model of chemical evolution, the increase in gas-phase metallicity is governed by the fraction of gas that has been converted into stars, and the yield of metals returned to the ISM by each generation of stars (under the assumption of instantaneous recycling). The model is described by the equation:
| (3) |
where is the mass fraction of metals in the ISM, is the metal yield by mass, and is the fraction of the total baryonic mass remaining in gas that has not yet been converted into stars. Predicting the increase in stellar mass for a given increase in O/H requires an estimate of the yield of oxygen. Based on the solar neighborhood value of , and with oxygen comprising % of the mass in metals, past estimates of the oxygen yield by mass were (Lee et al. 2003). New measurements of the solar abundance may indicate that is actually dex lower. In an independent manner, both Garnett (2002) and Tremonti et al. (2004) compute the “effective yield”, , for star-forming galaxies as a function of mass. The quantity is defined as the oxygen abundance divided by . Both authors find that asymptotes at large galaxy masses to a value of , which is considered the true yield. However, the value of derived by both Garnett (2002) and Tremonti et al. (2004) is derived from O/H values based on the SDSS or abundance scales, both of which yield systematically higher values than calibration. With the calibration, the value of the true yield could easily be lower by dex.
Given the uncertainty in , which could range between and , we would predict an increase in stellar mass of a factor of to accompany the increase in metallicity of DEEP2 galaxies between and , if the systems are treated as closed boxes. Therefore, the observed increase in stellar mass of roughly a factor of two is consistent with expectations of closed box chemical evolution models, for an increase in average oxygen abundance from to 8.75. Approximate closed boxes may not be such unrealistic descriptions of these galaxies, at least in terms of the importance of outflows. The likely SDSS descendants of the DEEP2 galaxies have effective yields, derived by Tremonti et al. (2004), that are within only dex of the true yield, which is interpreted as an indication that the effect of supernova feedback cannot be significant on the progress of enrichment in these galaxies.
4.3. A Comparison with Star-forming Galaxies at
[NII]/H ratios have also been measured for star-forming galaxies at (Shapley et al. 2004). Measurements for individual galaxies are available for objects with , the most luminous % (in the rest-frame optical) of UV-selected galaxies in this redshift range (Steidel et al. 2004). [NII]/H can be measured from composite near-IR spectra of fainter galaxies in the sample as well. As shown by the open star in the lower panels of figure 4, representing the average , , and for the sample of 7 galaxies in Shapley et al. (2004), the average and O/H values for the sample are very similar to those of the DEEP2 sample. Furthermore, Shapley et al. (2004) show preliminary evidence for an relationship among star-forming galaxies, by demonstrating that the [NII]/H ratio is smaller in a composite spectrum of a sample of galaxies with fainter rest-frame optical luminosities (Erb et al. 2003). Despite similar locations in the plane, the galaxies in Shapley et al. (2004) will follow significantly different evolutionary paths relative to those of our DEEP2 sample. Specifically, the sample will not be forming stars by , therefore their local descendants will not be found among the sample of Tremonti et al. (2004). In fact, it is likely that they will no longer be forming stars even by , and will be found among the red, absorption-line galaxies in the DEEP2 survey.
This scenario is supported by multiple pieces of evidence. First, the average stellar mass and ratio among the higher-redshift Shapley et al. (2004) sample is already times higher than that of the DEEP2 sample average. This difference is shown graphically by the the location of the star symbol in figure 4, representing the average of the sample. While this point lies squarely in the middle of the distribution of DEEP2 values (left-hand panel), it is found towards the high-mass extreme of the DEEP2 stellar mass values (right-hand panel). ratios will generally tend to increase with time, barring the presence of a major later episode of star-formation. Only one galaxy in our DEEP2 sample has a stellar greater than those in the comparison sample, and may serve as a counterpart. The SED of this one object, 32025514, indicates the highest stellar mass in the total sample of 12 DEEP2 galaxies, and a significantly more mature stellar population as traced empirically by the largest color (rest-frame UV-to-optical break). In contrast to most of the galaxies in our DEEP2 sample, 32025514 may follow an evolutionary path between and resulting in a local descendent with no ongoing star formation. In the future, it will be valuable to compare the DEEP2 sample with a more representative sample of objects, spanning a larger dynamic range in stellar mass and (Erb et al., in preparation).
Another clue about the evolution of galaxies in the Shapley et al. (2004) sample is based the large clustering strength of UV-selected galaxies at . The correlation length among the total sample is comoving Mpc, and among galaxies with , it increases to comoving Mpc (Adelberger et al. 2005b, a). A comparison with simulations indicates that red, absorption-line dominated galaxies in the DEEP2 survey cluster as strongly as the descendants of the dark matter haloes hosting typical UV-selected galaxies at ; elliptical galaxies in the SDSS cluster like the descendants of the same dark matter haloes (Coil et al. 2004a; Budavári et al. 2003; Adelberger et al. 2005b). The correlations observed in star-forming galaxies among O/H, , and can therefore be used to understand the formation of elliptical galaxies. As the Shapley et al. (2004) sample all have , their descendants at and should be more massive, more strongly clustered, and even less likely to be forming stars than the descendants of typical UV-selected galaxies.
5. H II Region Physical Conditions
5.1. Emission-Line Diagnostics
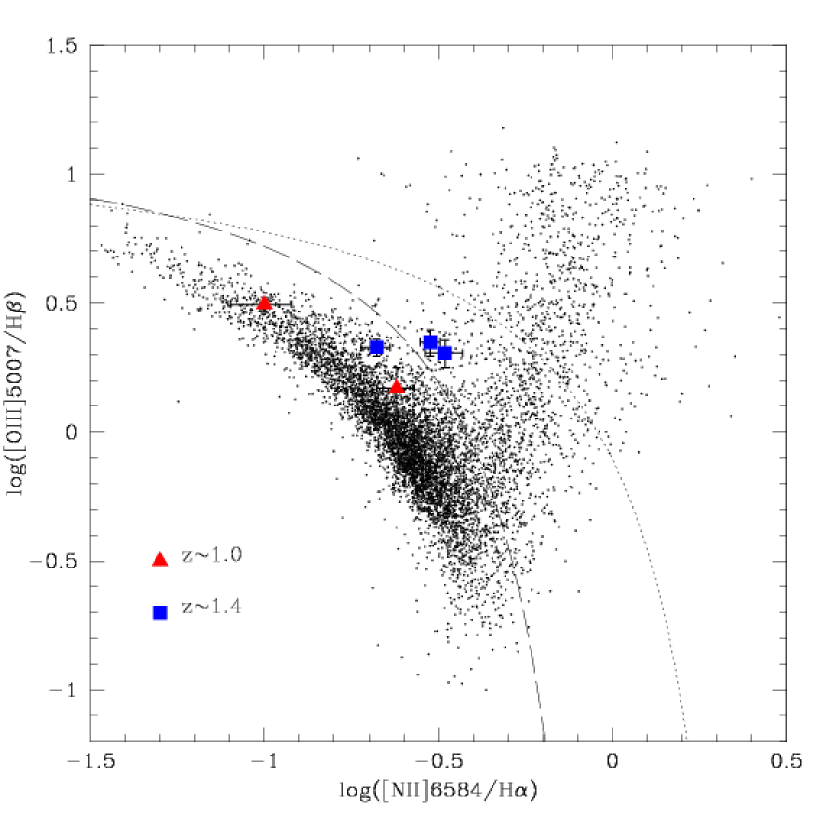
In Figure 5, [OIII]/H and [NII]/H ratios are plotted for the five galaxies with the full set of emission lines. This space serves as a fairly standard diagnostic for discriminating between star-forming galaxies and AGN (Baldwin et al. 1981; Veilleux & Osterbrock 1987). Also indicated in Figure 5 are emission-line objects from the SDSS survey, which trace out well-defined sequences. Star-forming galaxies occupy the fan in the lower left-hand portion of the diagram, in a region roughly defined by decreasing excitation as a function of increasing metallicity. This physical sequence results in the empirical anti-correlation between [OIII]/H and [NII]/H up to the point where [NII]/H saturates (at [NII]/H). At the highest metallicities, [OIII]/H continues to decrease at relatively fixed [NII]/H. AGN mostly occupy the upper right-hand region of the diagram, typically described by both higher [NII]/H and [OIII]/H ratios than those in star-forming galaxies. To place the empirical H II region sequence on the theoretical footing of ionizing spectrum, metallicity, and ionization parameter, most recently Dopita et al. (2000) used PEGASE (Fioc & Rocca-Volmerange 1997) and STARBURST99 (Leitherer et al. 1999) instantaneous zero-age stellar population models for the input ionizing spectra, metallicities ranging from with the Anders & Grevesse (1989) values of solar metallicity, ionization parameters ranging from to , and an electron density of . With these models, Dopita et al. (2000) successfully recovered the location and upper envelope of the [OIII]/H vs. [NII]/H emission-line sequence of local H II regions, which is observed among both the H II regions compiled by Pettini & Pagel (2004) to generate the abundance calibration, and the emission-line galaxies in Tremonti et al. (2004). Two curves are plotted in Figure 5, of the same shape as the upper-envelope found by Dopita et al. (2000), though with different normalizations. These curves serve to discriminate between star-forming galaxies and AGN. The more conservative, dashed curve is from Kauffmann et al. (2003a), and is used to define the sample of star-forming galaxies presented in Tremonti et al. (2004). This criterion should yield galaxies in which the H flux has % contribution from AGN (Brinchmann et al. 2004). The upper dotted curve is from Kewley et al. (2001a) and represents a theoretical upper limit on the location of star-forming galaxies in the diagnostic diagram. It is very unlikely to find star-forming galaxies above the line of Kewley et al. (2001a). We shall return to this limit in the discussion below.
While the two galaxies in our DEEP2 sample are roughly consistent with the sequence of SDSS star-forming galaxies and local H II regions in terms of diagnostic line ratios, the three galaxies are significantly offset from this sequence. The difference between and galaxies more likely reflects the nearly disjoint ranges of rest-frame luminosity and star-formation rate probed by the small samples, rather than an evolutionary trend within DEEP2. Two of the galaxies, 42008627 and 42008219, are offset towards higher [OIII]/H by dex, relative to star-forming SDSS galaxies with similar [NII]/H ratios. The third galaxy, 42055947, is offset by 0.3 dex, which is still significant. Conversely, 42008627 and 42008219 are displaced by 0.4 dex towards higher [NII]/H relative to SDSS galaxies with similar [OIII]/H ratios, while 42055947 is displaced by 0.2 dex. The line ratios of 42008627 and 42008219 place these objects in a region of the diagnostic diagram only sparsely populated by SDSS emission-line galaxies, intermediate between local star-forming galaxies and AGN, above the Kauffmann et al. (2003a) curve but below that of Kewley et al. (2001a). In a preliminary sample of four UV-selected star-forming galaxies with the full set of emission-line measurements, offsets of equal or greater value relative to the emission-line sequence of local star-forming galaxies have been measured, and over a larger range in [NII]/H (Erb et al., in preparation). The subset of the intermediate redshift TKRS sample (Kobulnicky & Kewley 2004) with measured [NII]/H ratios follows an emission-line sequence consistent with the SDSS sequence over most of the range in [NII]/H. At [NII]/H, however, there are a few outlying TKRS galaxies with similar line ratios to those of the DEEP2 galaxies.
One effect that could potentially bias the measured [OIII]/H ratios towards higher values is the underestimate of H due to underlying stellar Balmer absorption. Stellar absorption will have less of an effect on H because of its larger emission line strength. The effect of stellar absorption was not included in the calculation of [OIII]/H and [NII]/H ratios in part because little or no continuum was detected. However, it is possible to place an upper limit on the importance of this effect for the galaxies with offset line ratios by using the upper limit on the continuum, , and a reasonable estimate of the stellar absorption equivalent width, Å (Charlot et al. 2002). The upper limit on the amount by which the H flux must be corrected is then . With such corrections, the points for the DEEP2 galaxies would shift by no more than 0.1 dex downwards, and by an insignificant amount in [NII]/H. Therefore, unaccounted-for stellar Balmer absorption is not the explanation for the offsets in emission line ratios. With the assumption that the offsets correspond to a difference in the intrinsic emission line properties of the DEEP2 galaxies, we consider possible causes and implications of this difference in the following discussion.
5.2. Physical Differences in the H II Regions of DEEP2 Galaxies
First, it is worth placing the inferred star-formation rates of our DEEP2 sample in context with those of other distant star-forming galaxies, as well as typical SDSS emission-line galaxies and intermediate-redshift TKRS galaxies. The three galaxies offset from the SDSS emission-line diagnostic locus have inferred H star-formation rates ranging between , uncorrected for dust-extinction, while the two galaxies have star-formation rates of . Pettini et al. (2001) found an average star-formation rate of for a sample of 14 Lyman Break Galaxies (LBGs). These star-formation rates were based on H emission fluxes, since H is shifted into the thermal infrared at . For a sample of 16 galaxies at , selected with criteria designed to find analogs to LBGs, Erb et al. (2003) found an average H star-formation rate of . The Erb et al. (2003) sample therefore features a comparable range of H star-formation rates to that of the DEEP2 galaxies.
The average H star-formation rate in the SDSS sample, based on the H fluxes and redshifts in the sample of Tremonti et al. (2004), is (the median is ). We correct this value by the 24% median fraction of galaxy light in the SDSS fiber apertures reported by Tremonti et al. (2004), which translates into an aperture-corrected mean star-formation rate of (and a median of ). These values are almost an order of magnitude smaller than the star-formation rates probed by our DEEP2 sample at . Furthermore, only 1.5% of the Tremonti et al. (2004) sample has aperture-corrected H star-formation rates above , in the range probed by our DEEP2 sample. We find that SDSS galaxies with such high star-formation rates are indeed offset towards higher [OIII]/H and [NII]/H relative to the Tremonti et al. (2004) sample as a whole. The offset is not as significant as seen in our DEEP2 sample at , though, because, by definition, the Tremonti et al. (2004) sample only contains galaxies below and to the left of the Kauffmann et al. (2003a) curve to insure minimal contamination by AGN. As a caveat, we mention that dust extinction typically amounts to a factor of correction for SDSS H star-formation rates; but, as no robust extinction correction was available for the DEEP2 galaxies, we refrain from correcting the SDSS star-formation rates at this point. The TKRS sample with [NII]/H measurements (Kobulnicky & Kewley 2004) has an average star-formation rate of , based on H fluxes uncorrected for dust extinction. Furthermore, the star-formation rates in this sample are rather modest, with all of them .
In summary, the DEEP2 galaxies are hosting significantly more active levels of star-formation than the bulk of galaxies in the SDSS sample of Tremonti et al. (2004) and the TKRS subsample of Kobulnicky & Kewley (2004). It is therefore not surprising that their emission-line diagnostics more closely resemble those of the nearby luminous starbursts discussed below (Kewley et al. 2001b), and of actively star-forming galaxies at (Erb et al. 2003), rather than those of H II regions in more quiescent galaxies. We now consider possible causes of the offset in line ratios observed in distant star-forming galaxies. These include differences in the ionizing spectrum, ionization parameter, and H II region electron density, the effects of shock ionization, and contributions to the emission from an AGN.
An offset upwards and to the right of the local H II region emission-line sequence was previously found by Kewley et al. (2001a, b) for a sample of 157 local starburst galaxies selected by their warm infrared colors. The starbursts in the Kewley et al. (2001b) sample not accounted for by the upper envelope of the H II region emission-line sequence of Dopita et al. (2000) are found in a similar location to the DEEP2 galaxies, in [OIII]/H vs. [NII]/H parameter space. Kewley et al. (2001a) find that no combination of ionization parameter and metallicity can account for all the objects in their sample, if a zero-age instantaneous burst of star formation is assumed for the input ionizing spectrum. They infer that a harder extreme ultraviolet (EUV) ionizing spectrum in the Rydberg range (i.e., between the H I and He II ionization edges) is required to explain the offset in line diagnostics. Such an EUV radiation field is obtained in Kewley et al. (2001a) by assuming PEGASE continuous star formation models with an age of 6 Myr (at which point an equilibrium is reached in the ionizing spectrum). These models include fairly hard Wolf-Rayet star spectra in the Rydberg range, and the upper envelope of the associated ionization-parameter/metallicity grid is what forms the Kewley et al. (2001a) upper limit curve for starbursts in the [OIII]/H vs. [NII]/H space (Figure 5). While the continuous PEGASE model can account for line ratios of the warm starbursts in Kewley et al. (2001a) as well as those of the DEEP2 galaxies, the Wolf-Rayet stellar atmospheres used by PEGASE to generate such a hard EUV radiation field are not very realistic (Kewley et al. 2001a). Therefore, this specific model may not represent the ultimate or only solution to the problem of the offset line ratios. For example, the spectral slope of the EUV spectrum in the Ryd range is also affected by the slope of the stellar IMF. An IMF slope flatter than the standard Salpeter value of will result in a higher fraction of the most massive stars, with an accordingly harder ionizing spectrum (Leitherer et al. 1999). At present, we have no independent observational constraints on the slope of the high-mass stellar end of the IMF in DEEP2 galaxies.
There are other possible causes of the offset in the DEEP2 line ratios. As discussed above, our sample of DEEP2 galaxies at hosts elevated levels of star formation, compared with average galaxies in the SDSS emission-line sample of Tremonti et al. (2004). Ionization parameter and star-formation rate are not directly proportional – since ionization parameter indicates the ratio of densities of ionizing photons and electrons, it is related to the star-formation rate through a geometrical factor and through the electron density. However, elevated rates of star-formation do provide a larger reservoir of ionizing photons. In the sample of Pettini et al. (2001), where the inferred star-formation rates are even more extreme than in the DEEP2 sample, large measured [OIII]/[OII] line ratios indicate significantly higher ionization parameters than those observed in more quiescent samples (Lilly et al. 2003). A robust extinction correction based on simultaneously-measured H and H fluxes would be required to estimate an extinction-corrected [OIII]/[OII] value and therefore an ionization parameter. Our current data do not satisfy all of these requirements, but we will attempt to address the issue with future observations. Furthermore, it will be possible to estimate the ionization parameters for the small sample of SDSS galaxies found in the same region of [OIII]/H vs. [NII]/H space as the DEEP2 galaxies.
Another apparent physical difference between the DEEP2 star-forming galaxies and the SDSS sample is found in terms of the typical H II region electron density. In the SDSS sample of Tremonti et al. (2004), the median [SII]/[SII] line ratio implies an electron density of .222For SDSS spectra, which are characterized by Å resolution, the more widely-spaced [SII] line ratio is preferable to the [OII] line ratio for measuring electron densities. Since our NIRSPEC spectra are not deep enough to detect [SII] for individual objects, we estimate electron densities for the five DEEP2 galaxies with values based on the density-sensitive [OII]/[OII] line ratio found in the DEIMOS discovery spectra. While the DEIMOS [OII] spectra have not been carefully flux-calibrated, the [OII] line ratios should be fairly insensitive to flux-calibration. We find that the median [OII] line ratio implies an electron density of , which is significantly higher than the typical value observed in SDSS emission-line galaxies. On the other hand, the DEEP2 electron density is quite similar to the electron density found in nearby starbursts. Kewley et al. (2001b) report an average electron density of , based on [SII] line ratios for their sample of warm infrared starbursts. This value is consistent with other recent results for electron densities in starburst nuclear H II regions (Ravindranath & Prabhu 2001; Contini et al. 1998; Storchi-Bergmann et al. 1995; Heckman et al. 1990), though higher than observed in typical disk H II regions (Zaritsky et al. 1994). Higher electron densities in starburst nuclei result from the higher ambient interstellar pressures present in such environments (Dopita et al. 2005). For fixed ionization parameter, metallicity, and input ionizing spectrum, the photo-ionization models presented in Kewley et al. (2001a) display a dependence on electron density. The dependence is in the sense that model grids with higher electron density have an upper envelope in the space of [OIII]/H vs. [NII]/H that is offset upwards and to the right, relative to model grids with lower electron density. Therefore, the enhanced electron densities in environments hosting active star-formation may account for some of the differences in observed line ratios.
The next possibility to consider is the effect of shocks on the emergent emission-line spectrum. Given the high star-formation rates observed in the DEEP2 galaxies, such shock excitation might be produced by the combined effects of supernovae explosions and stellar winds that collectively result in the large-scale outflows observed in both local and distant starbursts (Heckman et al. 1990; Pettini et al. 2001). Models for fast, radiative shocks by Dopita & Sutherland (1995) predict a range of [OIII]/H and [NII]/H line ratios that encompasses those observed for the DEEP2 galaxies. Specifically, the “shock plus precursor” model, with a shock velocity of km s-1, reproduces the line ratios quite well. In this case, optical emission lines originate both in hot gas that has already been shocked, as well as in a pre-shock H II region that is being ionized by the radiation field from the cooling shocked gas. Such a shock ionization model also predicts [SII]/H and [OI]/H. We do not obtain significant detections of [SII] or [OI] in any individual spectra, but find [SII]/H when we average the spectra of the three DEEP2 galaxies. With the current depth of our observations, we cannot rule out the contribution of shock ionization to the observed emission-line ratios.
Finally, we consider the contribution of an AGN. Ho et al. (1993) considered a class of “transition objects,” with emission-line ratios intermediate between those of star-forming galaxies and AGN. The emission-line ratios of the DEEP2 objects are similar to those of “transition objects,” which are explained by Ho et al. (1993) as LINER/Seyfert galaxies whose integrated spectra are diluted by the contributions from H II regions photoionzed by stars. Currently, we have no information about the X-ray or radio emission properties of our DEEP2 sample, which might help to identify the presence of an AGN. However, it will be valuable to measure diagnostic emission-line ratios for DEEP2 galaxies in the Extended Groth Strip region, where such multi-wavelength data, and optical morphological information, are available.
We defer a final analysis of the cause for the offset in diagnostic line ratios of DEEP2 galaxies until a statistical sample is assembled. A larger high-redshift sample will enable studies of how the diagnostic line ratios vary as functions of other galaxy properties. Furthermore, more detailed examination of the small fraction of SDSS galaxies with similar [OIII]/H and [NII]/H ratios should aid in interpreting the DEEP2 sample. We will compare additional spectral features, stellar population parameters, and morphological information available for such SDSS galaxies, relative to those of the SDSS galaxies with more typical line ratios. At this point, we highlight the implications of the observed offset in DEEP2 line ratios, relative to the excitation sequence of both SDSS galaxies and the H II regions used to formulate the and abundance calibrators.
5.3. Implications of the Offsets in Emission-line Diagnostics
Studies of chemical evolution using star-forming galaxies at rely on strong-line abundance indicators. Most of the features of interest are shifted into the near-IR at these redshifts. It would be most desirable to measure simultaneously the full set of strong rest-frame optical emission lines that are available in spectra of nearby star-forming galaxies (Tremonti et al. 2004; Jansen et al. 2000). However, because of the limits of current near-IR spectroscopic technology, atmospheric absorption, and ubiquitous and bright night sky emission lines, only a subset of H II region lines can typically be observed simultaneously in high-redshift galaxies. In light of these limitations, we have emphasized the and strong-line abundance indicators for the current work, especially since these indicators are fairly insensitive to uncertainties in dust-extinction and flux-calibration. These indicators may represent the optimal strong-line indicators available for high-redshift galaxies, using current ground-based instrumentation.
In section 4, we emphasized the importance of using the same empirical abundance indicator (e.g. , , or ) for a fair comparison of galaxy samples at different redshifts. Now, we provide an important caveat to this argument. When using an empirically-calibrated abundance indicator such as or for both local and distant galaxies, it is critical to take into account systematic differences in the H II region physical conditions as a function of redshift. Specifically, the and indicators were calibrated by Pettini & Pagel (2004) using a sample of H II regions with direct O/H abundance measurements. These H II regions apparently follow the same [OIII]/H vs. [NII]/H excitation sequence as the star-forming regions of emission-line galaxies in the SDSS sample of Tremonti et al. (2004). This similarity suggests that the two samples span the same range of H II region physical parameters, in terms of ionizing spectrum, ionization parameter and metallicity, and that the Pettini & Pagel (2004) calibration should be valid for converting the values measured from SDSS spectra into oxygen abundances. Since DEEP2 galaxies are offset from the emission-line sequence of local H II regions and SDSS galaxies, systematic biases may result when applying the calibration of Pettini & Pagel (2004) to derive oxygen abundances from their spectra.
We can further illustrate the problem in two ways. First, we compare - and -based abundances for the five galaxies in our DEEP2 sample with estimates of both quantities. As presented in section 3, the -based abundances are all systematically higher than those based on . For the sample, the average offset is dex, whereas for the sample, the average offset is dex. This systematic difference is not hard to understand. Since local H II regions form a roughly one-dimensional sequence in the space of [OIII]/H vs. [NII]/H, a given value of corresponds to a specific location on the one dimensional sequence, and therefore also determines the value of . Furthermore, the and indicators should yield consistent oxygen abundances for local H II regions, since both indicators were calibrated on such a sample. Since the DEEP2 galaxies are systematically offset from this one-dimensional sequence, their values correspond to higher values of , than those of local H II regions with similar values. Therefore, it is the incorrect assumption of the DEEP2 galaxies following the local H II region excitation sequence that leads to the systematic discrepancies between - and -based abundances. Second, we use the theoretical models of Kewley et al. (2001a) to demonstrate the importance of applying the correct physical conditions to the interpretation of emission line spectra. While the PEGASE instantaneous models with appear to provide the correct input ionizing spectrum to explain the emission-line sequence of local H II regions (Dopita et al. 2000), the continuous models with appear more appropriate for producing the emission-line ratios observed in nearby starbursts (Kewley et al. 2001a). While the absolute abundance calibration of both of these models may be systematically high in the super-solar regime (Kennicutt et al. 2003), we are simply interested in relative effects here. We determine the difference in metallicity for models of fixed ionization parameter, but different ionizing spectrum, that produce the same emergent value. This metallicity difference will indicate the possible magnitude of error in abundance that results from application of the local H II region model to the spectrum of a starburst nucleus – if indeed the differences between the two emission-line sequences can be explained by this difference in ionizing spectrum. To produce the range of values observed in our sample, the instantaneous H II region models are typically times lower in metallicity than the continuous starburst models.
Both the systematic differences in - and -based oxygen abundances in DEEP2 galaxies, and the error in derived metallicity that results from using an inappropriate input ionizing spectrum, are within a factor of 2. These errors in metallicity are smaller than or equal to the quoted uncertainties in the and abundance indicators, which result from the intrinsic scatter among the H II regions that were included in the calibrations (Pettini & Pagel 2004). However, if the relationship between O/H and (or ) is systematically offset in the same sense in all distant star-forming galaxies from the scatter observed local H II regions, this should be taken into account when estimating the evolution of chemical abundances, the , and relationships as a function of redshift. Our future goal is to determine the cause of the offset line ratios, and, if possible, to define a local calibration sample of H II regions with direct abundance measurements, that follows the same excitation sequence of the distant starburst galaxies. Finally, galaxies with high star-formation rates were much more common at (Arnouts et al. 2004; Adelberger & Steidel 2000; Erb et al. 2003). Physical differences in H II regions with extreme star-formation rates may have a profound impact on the star-formation process and stellar IMF (Stolte et al. 2005). Therefore, to characterize the build-up of the stellar mass in the universe, we must have a full understanding of the physical conditions in star-forming regions in distant galaxies.
6. SUMMARY
We have presented the rest-frame optical spectra of a pilot sample of 12 DEEP2 galaxies at . These galaxies span almost three magnitudes in ( to ), and are drawn from the set of galaxies blueward of the observed color bimodality found in the DEEP2 survey. They span a range of stellar mass from to . We have measured [NII] and H fluxes for the entire sample, and additional [OIII] and H fluxes for a subset of five objects. Our principal conclusions include the following:
1. The [NII]/H line ratios for this sample indicate an average gas phase oxygen abundance of , with the application of the abundance calibration of Pettini & Pagel (2004). Combining [NII]/H and [OIII]/H ratios for the 5 galaxies with all available measurements, we apply the abundance calibration of Pettini & Pagel (2004) to obtain an average oxygen abundance of . For this subsample the indicator yields systematically lower oxygen abundances than the indicator, by dex.
2. Considering the sample of [NII]/H ratios, absolute magnitudes, and derived stellar masses, we find evidence that objects with brighter and larger also have larger [NII]/H ratios on average, indicative of higher oxygen abundance. This result suggests that luminosity-metallicity and mass-metallicity relationships are already in place among star-forming galaxies at , but will require a larger sample to confirm.
3. A comparison of DEEP2 galaxies with the local SDSS star-forming sample of Tremonti et al. (2004) indicates strong evolution between and in the relationships among oxygen abundance, rest-frame -band luminosity, and stellar mass. We highlight results for the subsample of DEEP2 galaxies with measurements, characterized by , , and . Applying the abundance indicator consistently to both samples, we find that SDSS galaxies with similar O/H to the DEEP2 sample average are magnitudes fainter and times less massive. Conversely, SDSS galaxies with similar luminosities to the average of the DEEP2 sample have O/H abundances that are 0.35 dex higher. SDSS galaxies with similar masses to the DEEP2 average are characterized by O/H abundances 0.30 dex higher.
4. The clustering strengths and number densities of blue DEEP2 galaxies with strong emission lines (Coil et al. 2004a; Faber et al. 2005) are consistent with a scenario in which the majoriy of our DEEP2 sample will remain blue and star-forming by . In this scenario, the descendants of our DEEP2 sample will be included in the sample of Tremonti et al. (2004). To explain how the sample evolves to lie on the locally-observed luminosity-metallicity and mass-metallicity relationships, we use the observed evolution in in the rest-frame -band luminosity function between and (Faber et al. 2005). This evolution consists of 1.3 magnitudes of fading for the DEEP2 galaxies, to an average magnitude of . SDSS galaxies with have typical stellar masses of , a factor of two larger than in our DEEP2 sample, and stellar ratios times higher. To lie on the SDSS relationship, the DEEP2 oxygen abundances must increase on average by 0.35 dex. The combined increase in stellar mass and metallicity is roughly consistent with the expectations of a closed-box chemical evolution model, which is not very surprising, since the masses of the DEEP2 galaxies are larger than the mass at which feedback appears to be important (Garnett 2002; Kauffmann et al. 2003b; Tremonti et al. 2004). Though they have similar [NII]/H ratios and rest-frame luminosities, the sample of star-forming galaxies with presented by Shapley et al. (2004) will follow a very different evolutionary path from that of objects in our DEEP2 sample. These galaxies have stellar masses and ratios that are already times higher on average than the DEEP2 galaxies presented here, and are significantly more strongly clustered than blue DEEP2 galaxies in general. They will no longer be forming stars by , and their descendants will not be included in the sample of Tremonti et al. (2004).
5. We compute the standard emission-line diagnostic, [OIII]/H vs. [NII]/H, for the five DEEP2 galaxies for which such measurements are available. Bright DEEP2 galaxies at are significantly offset from the tight excitation sequence followed by SDSS star-forming galaxies and local H II regions. A similar offset is observed in both nearby starburst galaxies (Kewley et al. 2001a) as well as star-forming galaxies at (Erb et al., in preparation). These galaxies all feature elevated star-formation rates, relative to typical values in the SDSS sample. In particular, the DEEP2 galaxies have H star-formation rates of . We consider several causes for the observed offset in line ratios, including differences in the ionizing spectrum, ionization parameter, and electron density; and the effects of shocks and AGN. Differences in the H II region physical conditions must be taken into account when applying empirically-calibrated abundance indicators, such as and , to galaxy samples at different redshifts.
6. Our pilot sample of DEEP2 galaxies demonstrates the feasibility of chemical abundance studies at . We used long-slit spectroscopy on a ground-based 10-meter class telescope, with relatively short integration times in single near-IR bandpasses. New infrared spectrographs are now available on large telescopes featuring broader simultaneous wavelength coverage (e.g., the Gemini Near Infrared Spectrograph), and the availability of multi-object near-infrared spectrographs is imminent. The DEEP2 redshift survey, with its extensive set of precise nebular [OII] redshifts, provides an ideal sample with which to explore the metal content and H II region physics in distant star-forming galaxies using these new ground-based technologies.
We are indebted to the DEEP2 team, whose significant efforts in establishing such a tremendous spectroscopic sample at made this project possible. We also thank the staff at the W. M. Keck Observatory for their assistance with the NIRSPEC observations, in particular Jim Lyke, whose extensive help was invaluable. We also thank Christy Tremonti, Lisa Kewley, and Max Pettini for enlightening conversations, with special thanks to Christy for providing us with a table of SDSS line fluxes, absolute magnitudes and stellar masses, allowing for a straightforward comparison with local galaxies. We thank Chris Conselice and Richard Ellis, who carried out the near-infrared photometric observations that enabled modeling of stellar masses. AES acknowledges support from the Miller Foundation for Basic Research in Science. We wish to extend special thanks to those of Hawaiian ancestry on whose sacred mountain we are privileged to be guests. Without their generous hospitality, most of the observations presented herein would not have been possible.
References
- Adelberger et al. (2005a) Adelberger, K. L., Erb, D. K., Steidel, C. C., Reddy, N. A., Pettini, M., & Shapley, A. E. 2005a, ApJ, 620, L75
- Adelberger & Steidel (2000) Adelberger, K. L. & Steidel, C. C. 2000, ApJ, 544, 218
- Adelberger et al. (2005b) Adelberger, K. L., Steidel, C. C., Pettini, M., Shapley, A. E., Reddy, N. A., & Erb, D. K. 2005b, ApJ, 619, 697
- Allende Prieto et al. (2002) Allende Prieto, C., Lambert, D. L., & Asplund, M. 2002, ApJ, 573, L137
- Anders & Grevesse (1989) Anders, E. & Grevesse, N. 1989, Geochim. Cosmochim. Acta, 53, 197
- Arnouts et al. (2004) Arnouts, S., Schiminovich, D., Ilbert, O., Tresse, L., Milliard, B., Treyer, M., Bardelli, S., Budavari, T., Wyder, T. K., Zucca, E., & GALEX-VVDS collaboration. 2004, ArXiv Astrophysics e-prints
- Asplund et al. (2004) Asplund, M., Grevesse, N., Sauval, A. J., Allende Prieto, C., & Kiselman, D. 2004, A&A, 417, 751
- Baldwin et al. (1981) Baldwin, J. A., Phillips, M. M., & Terlevich, R. 1981, PASP, 93, 5
- Brinchmann et al. (2004) Brinchmann, J., Charlot, S., White, S. D. M., Tremonti, C., Kauffmann, G., Heckman, T., & Brinkmann, J. 2004, MNRAS, 351, 1151
- Brodie & Huchra (1991) Brodie, J. P. & Huchra, J. P. 1991, ApJ, 379, 157
- Bruzual & Charlot (2003) Bruzual, G. & Charlot, S. 2003, MNRAS, 344, 1000
- Budavári et al. (2003) Budavári, T., Connolly, A. J., Szalay, A. S., Szapudi, I., Csabai, I., Scranton, R., Bahcall, N. A., Brinkmann, J., Eisenstein, D. J., Frieman, J. A., Fukugita, M., Gunn, J. E., Johnston, D., Kent, S., Loveday, J. N., Lupton, R. H., Tegmark, M., Thakar, A. R., Yanny, B., York, D. G., & Zehavi, I. 2003, ApJ, 595, 59
- Bundy et al. (2005) Bundy, K., Ellis, R. S., & Conselice, C. J. 2005, ApJ, 625, 621
- Bunker et al. (2004) Bunker, A. J., Stanway, E. R., Ellis, R. S., & McMahon, R. G. 2004, MNRAS, 355, 374
- Chabrier (2003) Chabrier, G. 2003, PASP, 115, 763
- Charlot et al. (2002) Charlot, S., Kauffmann, G., Longhetti, M., Tresse, L., White, S. D. M., Maddox, S. J., & Fall, S. M. 2002, MNRAS, 330, 876
- Coil et al. (2004a) Coil, A. L., Davis, M., Madgwick, D. S., Newman, J. A., Conselice, C. J., Cooper, M., Ellis, R. S., Faber, S. M., Finkbeiner, D. P., Guhathakurta, P., Kaiser, N., Koo, D. C., Phillips, A. C., Steidel, C. C., Weiner, B. J., Willmer, C. N. A., & Yan, R. 2004a, ApJ, 609, 525
- Coil et al. (2004b) Coil, A. L., Newman, J. A., Kaiser, N., Davis, M., Ma, C., Kocevski, D. D., & Koo, D. C. 2004b, ApJ, 617, 765
- Contini et al. (1998) Contini, T., Considere, S., & Davoust, E. 1998, A&AS, 130, 285
- Davis et al. (2003) Davis, M., Faber, S. M., Newman, J., Phillips, A. C., Ellis, R. S., Steidel, C. C., Conselice, C., Coil, A. L., Finkbeiner, D. P., Koo, D. C., Guhathakurta, P., Weiner, B., Schiavon, R., Willmer, C., Kaiser, N., Luppino, G. A., Wirth, G., Connolly, A., Eisenhardt, P., Cooper, M., & Gerke, B. 2003, in Discoveries and Research Prospects from 6- to 10-Meter-Class Telescopes II. Edited by Guhathakurta, Puragra. Proceedings of the SPIE, Volume 4834, pp. 161-172 (2003)., 161–172
- Dickinson et al. (2003) Dickinson, M., Papovich, C., Ferguson, H. C., & Budavári, T. 2003, ApJ, 587, 25
- Dopita et al. (2005) Dopita, M. A., Groves, B. A., Fischera, J., Sutherland, R. S., Tuffs, R. J., Popescu, C. C., Kewley, L. J., Reuland, M., & Leitherer, C. 2005, ApJ, 619, 755
- Dopita et al. (2000) Dopita, M. A., Kewley, L. J., Heisler, C. A., & Sutherland, R. S. 2000, ApJ, 542, 224
- Dopita & Sutherland (1995) Dopita, M. A. & Sutherland, R. S. 1995, ApJ, 455, 468
- Drory et al. (2005) Drory, N., Salvato, M., Gabasch, A., Bender, R., Hopp, U., Feulner, G., & Pannella, M. 2005, ApJ, 619, L131
- Erb et al. (2003) Erb, D. K., Shapley, A. E., Steidel, C. C., Pettini, M., Adelberger, K. L., Hunt, M. P., Moorwood, A. F. M., & Cuby, J. 2003, ApJ, 591, 101
- Evans & Dopita (1985) Evans, I. N. & Dopita, M. A. 1985, ApJS, 58, 125
- Faber et al. (2003) Faber, S. M., Phillips, A. C., Kibrick, R. I., Alcott, B., Allen, S. L., Burrous, J., Cantrall, T., Clarke, D., Coil, A. L., Cowley, D. J., Davis, M., Deich, W. T. S., Dietsch, K., Gilmore, D. K., Harper, C. A., Hilyard, D. F., Lewis, J. P., McVeigh, M., Newman, J., Osborne, J., Schiavon, R., Stover, R. J., Tucker, D., Wallace, V., Wei, M., Wirth, G., & Wright, C. A. 2003, in Instrument Design and Performance for Optical/Infrared Ground-based Telescopes. Edited by Iye, Masanori; Moorwood, Alan F. M. Proceedings of the SPIE, Volume 4841, pp. 1657-1669 (2003)., 1657–1669
- Faber et al. (2005) Faber, S. M., Willmer, C. N. A. W., Wolf, C., & the DEEP2 collaboration. 2005, ApJ, submitted (astro-ph/0506044)
- Fioc & Rocca-Volmerange (1997) Fioc, M. & Rocca-Volmerange, B. 1997, A&A, 326, 950
- Fontana et al. (2004) Fontana, A., Pozzetti, L., Donnarumma, I., Renzini, A., Cimatti, A., Zamorani, G., Menci, N., Daddi, E., Giallongo, E., Mignoli, M., Perna, C., Salimbeni, S., Saracco, P., Broadhurst, T., Cristiani, S., D’Odorico, S., & Gilmozzi, R. 2004, A&A, 424, 23
- Garnett (2002) Garnett, D. R. 2002, ApJ, 581, 1019
- Garnett & Shields (1987) Garnett, D. R. & Shields, G. A. 1987, ApJ, 317, 82
- Giavalisco et al. (2004) Giavalisco, M., Ferguson, H. C., Koekemoer, A. M., Dickinson, M., Alexander, D. M., Bauer, F. E., Bergeron, J., Biagetti, C., Brandt, W. N., Casertano, S., Cesarsky, C., Chatzichristou, E., Conselice, C., Cristiani, S., Da Costa, L., Dahlen, T., de Mello, D., Eisenhardt, P., Erben, T., Fall, S. M., Fassnacht, C., Fosbury, R., Fruchter, A., Gardner, J. P., Grogin, N., Hook, R. N., Hornschemeier, A. E., Idzi, R., Jogee, S., Kretchmer, C., Laidler, V., Lee, K. S., Livio, M., Lucas, R., Madau, P., Mobasher, B., Moustakas, L. A., Nonino, M., Padovani, P., Papovich, C., Park, Y., Ravindranath, S., Renzini, A., Richardson, M., Riess, A., Rosati, P., Schirmer, M., Schreier, E., Somerville, R. S., Spinrad, H., Stern, D., Stiavelli, M., Strolger, L., Urry, C. M., Vandame, B., Williams, R., & Wolf, C. 2004, ApJ, 600, L93
- Heckman et al. (1990) Heckman, T. M., Armus, L., & Miley, G. K. 1990, ApJS, 74, 833
- Ho et al. (1993) Ho, L. C., Filippenko, A. V., & Sargent, W. L. W. 1993, ApJ, 417, 63
- Jansen et al. (2000) Jansen, R. A., Fabricant, D., Franx, M., & Caldwell, N. 2000, ApJS, 126, 331
- Kauffmann et al. (2003a) Kauffmann, G., Heckman, T. M., Tremonti, C., Brinchmann, J., Charlot, S., White, S. D. M., Ridgway, S. E., Brinkmann, J., Fukugita, M., Hall, P. B., Ivezić, Ž., Richards, G. T., & Schneider, D. P. 2003a, MNRAS, 346, 1055
- Kauffmann et al. (2003b) Kauffmann, G., Heckman, T. M., White, S. D. M., Charlot, S., Tremonti, C., Brinchmann, J., Bruzual, G., Peng, E. W., Seibert, M., Bernardi, M., Blanton, M., Brinkmann, J., Castander, F., Csábai, I., Fukugita, M., Ivezic, Z., Munn, J. A., Nichol, R. C., Padmanabhan, N., Thakar, A. R., Weinberg, D. H., & York, D. 2003b, MNRAS, 341, 33
- Kennicutt (1998) Kennicutt, R. C. 1998, ARA&A, 36, 189
- Kennicutt et al. (2003) Kennicutt, R. C., Bresolin, F., & Garnett, D. R. 2003, ApJ, 591, 801
- Kewley & Dopita (2002) Kewley, L. J. & Dopita, M. A. 2002, ApJS, 142, 35
- Kewley et al. (2001a) Kewley, L. J., Heisler, C. A., Dopita, M. A., & Lumsden, S. 2001a, ApJS, 132, 37
- Kewley et al. (2001b) —. 2001b, ApJS, 132, 37
- Kobulnicky et al. (1999) Kobulnicky, H. A., Kennicutt, R. C., & Pizagno, J. L. 1999, ApJ, 514, 544
- Kobulnicky & Kewley (2004) Kobulnicky, H. A. & Kewley, L. J. 2004, ApJ, 617, 240
- Kobulnicky et al. (2003) Kobulnicky, H. A., Willmer, C. N. A., Phillips, A. C., Koo, D. C., Faber, S. M., Weiner, B. J., Sarajedini, V. L., Simard, L., & Vogt, N. P. 2003, ApJ, 599, 1006
- Kroupa (2001) Kroupa, P. 2001, MNRAS, 322, 231
- Lee et al. (2003) Lee, H., McCall, M. L., Kingsburgh, R. L., Ross, R., & Stevenson, C. C. 2003, AJ, 125, 146
- Leitherer et al. (1999) Leitherer, C., Schaerer, D., Goldader, J. D., Delgado, R. M. G., Robert, C., Kune, D. F., de Mello, D. F., Devost, D., & Heckman, T. M. 1999, ApJS, 123, 3
- Lilly et al. (2003) Lilly, S. J., Carollo, C. M., & Stockton, A. N. 2003, ApJ, 597, 730
- Pagel et al. (1979) Pagel, B. E. J., Edmunds, M. G., Blackwell, D. E., Chun, M. S., & Smith, G. 1979, MNRAS, 189, 95
- Pei et al. (1998) Pei, Y. C., Fall, S. M., & Hauser, M. G. 1998, Bulletin of the American Astronomical Society, 30, 1327
- Pettini & Pagel (2004) Pettini, M. & Pagel, B. E. J. 2004, MNRAS, 348, L59
- Pettini et al. (2001) Pettini, M., Shapley, A. E., Steidel, C. C., Cuby, J., Dickinson, M., Moorwood, A. F. M., Adelberger, K. L., & Giavalisco, M. 2001, ApJ, 554, 981
- Ravindranath & Prabhu (2001) Ravindranath, S. & Prabhu, T. P. 2001, Ap&SS, 276, 593
- Schiminovich et al. (2005) Schiminovich, D., Ilbert, O., Arnouts, S., Milliard, B., Tresse, L., Le Fèvre, O., Treyer, M., Wyder, T. K., Budavári, T., Zucca, E., Zamorani, G., Martin, D. C., Adami, C., Arnaboldi, M., Bardelli, S., Barlow, T., Bianchi, L., Bolzonella, M., Bottini, D., Byun, Y.-I., Cappi, A., Contini, T., Charlot, S., Donas, J., Forster, K., Foucaud, S., Franzetti, P., Friedman, P. G., Garilli, B., Gavignaud, I., Guzzo, L., Heckman, T. M., Hoopes, C., Iovino, A., Jelinsky, P., Le Brun, V., Lee, Y.-W., Maccagni, D., Madore, B. F., Malina, R., Marano, B., Marinoni, C., McCracken, H. J., Mazure, A., Meneux, B., Morrissey, P., Neff, S., Paltani, S., Pellò, R., Picat, J. P., Pollo, A., Pozzetti, L., Radovich, M., Rich, R. M., Scaramella, R., Scodeggio, M., Seibert, M., Siegmund, O., Small, T., Szalay, A. S., Vettolani, G., Welsh, B., Xu, C. K., & Zanichelli, A. 2005, ApJ, 619, L47
- Shapley et al. (2004) Shapley, A. E., Erb, D. K., Pettini, M., Steidel, C. C., & Adelberger, K. L. 2004, ApJ, 612, 108
- Steidel et al. (1999) Steidel, C. C., Adelberger, K. L., Giavalisco, M., Dickinson, M., & Pettini, M. 1999, ApJ, 519, 1
- Steidel et al. (2004) Steidel, C. C., Shapley, A. E., Pettini, M., Adelberger, K. L., Erb, D. K., Reddy, N. A., & Hunt, M. P. 2004, ApJ, 604, 534
- Stolte et al. (2005) Stolte, A., Brandner, W., Grebel, E. K., Lenzen, R., & Lagrange, A. 2005, ApJ, acceptged (astro-ph/0506575)
- Storchi-Bergmann et al. (1995) Storchi-Bergmann, T., Kinney, A. L., & Challis, P. 1995, ApJS, 98, 103
- Swinbank et al. (2004) Swinbank, A. M., Smail, I., Chapman, S. C., Blain, A. W., Ivison, R. J., & Keel, W. C. 2004, ApJ, 617, 64
- Tecza et al. (2004) Tecza, M., Baker, A. J., Davies, R. I., Genzel, R., Lehnert, M. D., Eisenhauer, F., Lutz, D., Nesvadba, N., Seitz, S., Tacconi, L. J., Thatte, N. A., Abuter, R., & Bender, R. 2004, ApJ, 605, L109
- Tremonti et al. (2004) Tremonti, C. A., Heckman, T. M., Kauffmann, G., Brinchmann, J., Charlot, S., White, S. D. M., Seibert, M., Peng, E. W., Schlegel, D. J., Uomoto, A., Fukugita, M., & Brinkmann, J. 2004, ApJ, 613, 898
- van Dokkum et al. (2004) van Dokkum, P. G., Franx, M., Förster Schreiber, N. M., Illingworth, G. D., Daddi, E., Knudsen, K. K., Labbé, I., Moorwood, A., Rix, H., Röttgering, H., Rudnick, G., Trujillo, I., van der Werf, P., van der Wel, A., van Starkenburg, L., & Wuyts, S. 2004, ApJ, 611, 703
- van Dokkum et al. (2005) van Dokkum, P. G., Kriek, M., Rodgers, B., Franx, M., & Puxley, P. 2005, ApJ, 622, L13
- Veilleux & Osterbrock (1987) Veilleux, S. & Osterbrock, D. E. 1987, ApJS, 63, 295
- Willmer et al. (2005) Willmer, C. N. A. W., F. S. M., Koo, D. C., & the DEEP2 collaboration. 2005, ApJ, submitted (astro-ph/0506041)
- Zaritsky et al. (1994) Zaritsky, D., Kennicutt, R. C., & Huchra, J. P. 1994, ApJ, 420, 87
- Zehavi et al. (2005) Zehavi, I., Zheng, Z., Weinberg, D. H., Frieman, J. A., & Berlind, A. A. e. a. 2005, apJ, submitted (astro-ph/0408569)
| Galaxy | R.A. (J2000) | Dec. (J2000) | Exposure (s) | Band | |||||
|---|---|---|---|---|---|---|---|---|---|
| 32038085 | 23:29:57.68 | 00:22:28.66 | 1.0183 | 23.33 | 0.57 | 0.88 | 19.10 | 2900 | J |
| 2900 | N1 | ||||||||
| 32038132 | 23:29:58.74 | 00:22:23.88 | 1.0190 | 23.87 | 0.44 | 0.62 | 20.17 | 2900 | J |
| 2900 | N1 | ||||||||
| 32020728 | 23:30:08.53 | 00:10:09.60 | 1.0446 | 23.43 | 0.11 | 0.49 | 20.36 | 3900 | J |
| 3900 | N1 | ||||||||
| 42009739 | 02:29:35.76 | 00:25:07.25 | 1.3067 | 23.12 | 0.18 | 0.33 | 3900 | H | |
| 42008627 | 02:29:54.34 | 00:23:56.42 | 1.3625 | 22.32 | 0.31 | 0.31 | 19.01 | 1900 | H |
| 2900 | J | ||||||||
| 42008700 | 02:29:53.06 | 00:23:48.46 | 1.3890 | 23.95 | 0.24 | 0.43 | 20.25 | 3900 | H |
| 2900 | J | ||||||||
| 32100778 | 23:30:38.74 | 00:14:07.57 | 1.3925 | 22.58 | 0.58 | 0.61 | 18.31 | 2900 | H |
| 32025514 | 23:30:38.28 | 00:13:55.90 | 1.3938 | 23.89 | 0.43 | 0.53 | 18.66 | 6900 | H |
| 32037003 | 23:30:13.73 | 00:20:05.22 | 1.3983 | 22.40 | 0.65 | 0.49 | 2900 | H | |
| 42055947 | 02:29:23.25 | 00:45:27.88 | 1.3987 | 21.90 | 0.35 | 0.29 | 18.83 | 3900 | H |
| 2900 | J | ||||||||
| 32036994 | 23:30:13.68 | 00:20:24.42 | 1.3990 | 23.87 | 0.30 | 0.33 | 2900 | H | |
| 42008219 | 02:30:04.48 | 00:25:00.73 | 1.4010 | 23.58 | 0.15 | 0.40 | 21.41 | 3900 | H |
| 3900 | J |
| Galaxy | aa Line flux and random error in units of . | aa Line flux and random error in units of . | aa Line flux and random error in units of . | aa Line flux and random error in units of . | bbOxygen abundance deduced from the relationship presented in Pettini & Pagel (2004). | ccOxygen abundance deduced from the relationship presented in Pettini & Pagel (2004). | dd luminosity in units of . | eeStar-formation rate in units of , calculated from using the conversion of Kennicutt (1998). | ffStellar mass and uncertainty estimated using the methods described in section 4.1. | ||
|---|---|---|---|---|---|---|---|---|---|---|---|
| 32038085 | 1.0183 | 0.8 | 6 | -21.28 | |||||||
| 32038132 | 1.0190 | 0.3 | 2 | -20.38 | |||||||
| 32020728 | 1.0446 | 0.6 | 5 | -20.72 | |||||||
| 42009739 | 1.3067 | 1.3 | 10 | -21.67 | |||||||
| 42008627 | 1.3625 | 2.1 | 16 | -22.59 | |||||||
| 42008700 | 1.3890 | 0.9 | 7 | -21.27 | |||||||
| 32100778 | 1.3925 | 0.8 | 6 | -23.05 | |||||||
| 32025514 | 1.3938 | 0.8 | 6 | -21.57 | |||||||
| 32037003 | 1.3983 | 2.1 | 17 | -22.99 | |||||||
| 42055947 | 1.3987 | 2.1 | 16 | -23.05 | |||||||
| 32036994 | 1.3990 | 1.9 | 15 | -21.17 | |||||||
| 42008219 | 1.4010 | 1.3 | 11 | -21.62 |