CRITICAL METALLICITY AND FINE-STRUCTURE EMISSION OF
PRIMORDIAL GAS
ENRICHED BY THE FIRST STARS
Abstract
The influence of the first stars on the formation of second-generation objects at high redshift may be determined, in part, by their metal enrichment of surrounding gas. At a critical metallicity, , primordial gas cools more efficiently by fine-structure lines of [C II] (157.74 m), [O I] (63.18 m, 145.5 m), [Si II] (34.8 m), and [Fe II] (25.99 m, 35.35 m) than by H I or H2 emission. This cooling may alter the process of fragmentation into smaller units. We study the time-dependent cooling of primordial gas enriched by heavy elements from early massive stars, particularly O, Si, and Fe. We define as the point when the total cooling rate by metals plus H2 equals the adiabatic compressional heating. We explore two metallicity scenarios: (1) a single metallicity for all heavy elements; (2) individual metallicities (, , , ) from theoretical supernova yields. For dense gas ( cm-3) with metals in relative solar abundances, fragmentation occurs at . However, for lower density gas ( cm-3), particularly in halos enriched in Si, O, and Fe, we find 0.1–1% . The critical metallicity approaches a minimum value at high- set by efficient LTE cooling, with thermalized level populations of fine-structure states and H2 rotational states ( and ). Primordial clouds of at 200 K are detectable in redshifted fine-structure lines, with far-infrared fluxes between and W m-2. For metallicities and molecular fractions , the fine-structure emission lines of [O I], [Si II], and [Fe II] could be – times stronger than the H2 rotational lines at 28.22 m () and 17.03 m ().
Subject headings:
cosmology: theory – nuclear reactions, nucleosynthesis, abundances – stars: Population iii – galaxies: formation – intergalactic medium1. Introduction
The last few years have witnessed an increase in the number of studies of first stars (Tumlinson & Shull, 2000; Bromm & Larson, 2004; Ciardi & Ferrara, 2005). Implicit in these studies is the issue of determining the transition between the first (metal-free) stars and the second (metal-enriched) generation of stars. This transition is thought to be determined primarily by the amount of heavy elements expelled by early stars and supernovae (SNe) and by their rate of incorporation into the surrounding intergalactic medium (IGM) and gaseous halos. At temperatures K, primordial gas cools efficiently by the excitation of resonance lines of hydrogen and helium. To cool below the “Ly barrier” at 8000 K, the gas must form H2 (Peebles & Dicke, 1968; Hirasawa, 1969; Lepp & Shull, 1984), whose rotational excitation allows the gas to cool to lower temperatures ( K) and form the first stars (Abel et al., 1997).
First-generation massive stars end their lives as SNe and eject newly synthesized heavy elements into interstellar space and out into the IGM. Once these metals are incorporated into neighboring clumps and halos, a second generation of stars will form from metal-enriched gas. When this gas includes a sufficient fraction of metals, it can cool more efficiently via the excitation of fine-structure levels of key heavy elements (C, O, Si, Fe). At this point, the gas is said to have reached “critical metallicity” (Bromm et al., 2001; Bromm & Loeb, 2003), and the cooling gas is then able to fragment into smaller cores and lower-mass stars.
Metal enrichment and the subsequent cooling both depend on the mass range of the first stars. Zero-metallicity stars above are predicted to end their lives in pair-instability supernovae or PISN (Heger & Woosley, 2002) and eject large amounts of O, Si, and Fe. Massive stars in the range 10–100 produce smaller amounts of Fe, but synthesize considerable mass in -process elements (O, Ne, Si, S, Ar). As noted by Tumlinson, Venkatesan, & Shull (2004) and Qian & Wasserburg (2005), the nucleosynthetic signatures of “Population III” stars provide key diagnostics of the initial mass function (IMF) of the first stars and SNe.
The purpose of this paper is to calculate a minimum metallicity, , at which the gas reaches the mass scale of fragmentation after the death of the first generation of stars (Schneider et al., 2002; Bromm & Loeb, 2003; Fang & Cen, 2004). Previous work (Omukai, 2000) used semi-analytical models to describe the thermal and chemical evolution of a protostellar cloud with a range of metallicities. In that study, a large network of chemical reactions was followed to describe the non-equilibrium chemistry for four elements (H, He, C, O) and 45 species, but no conclusions were drawn about the critical metallicity.
Bromm & Loeb (2003) made an analytic calculation of the critical metallicity, using cooling rates from fine-structure lines of [C II] and [O I]. However, they did not include other likely coolants such as [Si II] or [Fe II], nor did they follow the thermal evolution of the system. Based on the low [Fe/H] seen in several EMP (extremely metal poor) halo stars (Christlieb et al., 2002), they identified C and O as the elements responsible for the transition between Pop III and Pop II and derived critical values, and , for the IGM. Their study began with pre-existing clumps of cold, high-density gas. They assumed an initial hydrogen density cm-3 and explored a range of temperatures, 100 K 200 K, set by H2 cooling.
Fang & Cen (2004) also explored this transition, but they used different IMFs and were concerned with the photon production of the first objects. To connect to IGM reionization, they calculated a relationship between metallicity of the IGM and ionizing photons from PISN and type-II supernovae (SNeII). In order to reach a critical metallicity of for an IMF containing very massive stars (VMS), the transition between the two populations occurred when photon per H atom is produced. Approximately 10 photons per H are produced with a normal top-heavy IMF.
In this paper, we assume that a first generation of massive stars formed in a high-redshift halo. These stars produced a UV background and distributed the products of nucleosynthesis throughout the halo. We assume that all elements with first ionization potentials less than 13.6 eV are kept singly ionized (C II, Si II, Fe II, etc). A similar line of reasoning was followed in Bromm & Loeb (2003), but we introduce three improvements in the astrophysical calculations. First, we solve the time-dependent thermal history of the gas, cooling isobarically from an initial temperature and density. Second, we increase the number of cooling metal lines, both [C II] and [O I] but also [Si II] and [Fe II]. Third, we explore deviations from a single metallicity, , by defining individual values (, , , ) in accordance with theoretical yields from PISN and VMS.
The paper is structured as follows. We describe our semi-analytical simulations in § 2. We explain our chemical network and density evolution as a function of the different cooling functions in § 2.1. In § 2.3 we give details of the metal cooling lines used in the calculations. In § 3 we present our results. We discuss and summarize our conclusions in § 4.
2. Semi-analytic simulations
We have approached the cooling problem by considering a parcel of gas with primordial composition (see Appendix). We give the gas an initial temperature K and initial metallicity and let it cool isobarically, until the gas reaches a condition for fragmentation: a rate of cooling faster than adiabatic heating rate within a local Hubble time. We adopt an initial mass density of hydrogen, , as that of a virialized halo of total mass and baryon mass at fiducial redshift . The hydrogen number density in all forms is given by , for helium abundance by mass and g cm-3, appropriate for the baryon density parameter found by WMAP (Spergel et al., 2003). The virial radius and average hydrogen density of the halo are then,
| (1) |
| (2) |
Gas within this halo probably contains clumps of higher density, but this formula provides a characteristic mean value. This mean density is 178 times larger than the mean density of the IGM, . We chose a value of for the density ratio at virialization, its value for . For a cosmology with and , this ratio is . In general, the total matter density is
| (3) |
where , a formula accurate to 5% for values of = 0.15–1.0 (Eke et al., 1998).
The condition for fragmentation has been investigated by many authors, both analytically and through hydrodynamical numerical simulations (Rees & Ostriker, 1977; Blumenthal et al., 1984; Yamada & Nishi, 1998; Bromm et al., 2001; Nakamura & Umemura, 2001; Omukai, 2001; Schneider et al., 2002). The basic condition, , requires that the cooling time be shorter than the free-fall time, the time for a perturbation at the surface to reach the center of the clump,
| (4) |
Here, is the total particle number density and is the cooling rate per unit volume (erg cm-3 s-1). In this cooling rate, we include [C II], [Si II], [O I] and [Fe II] fine-structure and forbidden lines, as well as cooling by H I and H2. These four heavy elements (C, O, Si, Fe) are products of -burning whose dominant interstellar ions have efficient cooling from low-lying fine-structure levels. Other -process species such as Ne I, Mg II, S II, Ar I, and Ca II lack fine structure states in their ground configurations. We refer the reader to § 2.2 and § 2.3 for a complete description of the atomic data and metal cooling rates.
As the cloud contracts, with sufficient cooling for framentation, the temperature drops and the density increases. The cloud sizes at fragmentation are characterized by the Jeans length scale and Jeans mass, . Fragmentation slows when the gas becomes optically thick, but also when the gas density exceeds the critical densities for collisional de-excitation of the dominant coolants. This defines a minimum mass, which we use as the condition for fragmentation. This condition depends on the choice of the cooling function. Bromm & Loeb (2003) studied the formation of low-mass stars from gas that has been “polluted” by trace amounts of carbon and oxygen. To derive the critical metal abundances for fragmentation, they looked for the point at which the - cooling rate, , equals the adiabatic compressional heating rate, .
The gas fragments when , where is the adiabatic compression heating per unit volume (erg cm-3 s-1) arising from free-fall collapse of the gas under gravity,
| (5) |
Here, is the total mass density, where is the hydrogen number density and is the total particle number density (mostly H and He, since the electron and molecular fractions are quite small). As before, these values assume helium mass fraction (He/H = 0.0807 by number).
The initial and current cloud radii are and , and the coefficient varies from 1.22 to 2.74 for clouds with radius =0.99–0.90. We use the value corresponding to a change in radius, for a maximum coefficient (2.74), and we write the adiabatic heating rate (erg cm-3 s-1) as,
| (6) |
The different terms that form part of the cooling function used in these definitions are explained in the following section. We use the fragmentation criterion and explore cases in which adiabatic heating is compared to metal-line cooling only, as well as to the total cooling. In practice, both methods give similar results.
2.1. Chemistry network and thermal evolution
Throughout this paper we assume a CDM cosmology with , , , , and , the root-mean-square density dispersion within spheres of radius Mpc. As initial conditions, we adopt residual electron and molecular fractions (Seager et al., 2000) and (Lepp et al., 2002). These fractions are “frozen out” from expansion following the recombination epoch. We model the gas as H and He by mass and include traces amount of metals as coolants. We follow the non-equilibrium chemistry of nine species, H2, H, H+, H, H-, He, He+, He+2, and e- (Hutchings et al., 2002). The reaction rates and chemical processes can be found in the Appendix.
We follow the evolution of the gas density at constant pressure, . From the energy equation, we find,
| (7) |
where is the total particle number density and is the cooling rate per volume. From the ideal gas relation, we obtain the temperature, , and define
| (8) |
where the individual terms denote the cooling rates from metals, H2, H∘, and He+.
To find the molecular hydrogen cooling function, we solve for the statistical equilibrium of the first six rotational levels ( = 0–5). We use the radiative transition rates for the H2 rotational quadrupole lines from Wolniewicz, Simbotin, & Dalgarno (1998): s-1, s-1, s-1, and s-1. We assume separate populations of ortho-H2 ( = 1, 3, 5) and para-H2 ( = 0, 2, 4) with the usual 3:1 ortho/para ratio from nuclear spin multiplicities. The rate coefficients for H∘ and He∘ collisional excitation of these levels were taken from Forrey et al. (1997), who calculated new rates of (non-reactive) rotational excitation over the range 10 K 1000 K, using exact vibrational wavefunctions and a more reliable H3 potential energy surface (Boothroyd et al., 1996) for the interaction potential. Their H∘–H2 rates are several times larger than those (Le Bourlot et al., 1999) commonly used in other studies. We include He–H2 collisions, whose rate coefficients are 30–40 times larger than those of H∘. We scale the He rates to H rates of Forrey et al. (1997), using ratios of He/H rate coefficients computed by Le Bourlot et al. (1999).
For the complete set of collisional excitation rates and other
less important processes together with their analytical fits see
Hutchings et al. (2002). The atomic data for the metal fine-structure
and forbidden lines and the cooling rates, ,
are explained in the following sub-sections.
Table 1 shows the reference solar
metallicities used in this work, taken from Morton (2003) for C, O, Si,
and Fe. The table also lists the critical number densities,
, for H∘ de-excitation of the
fine-structure lines, where the level populations approach Boltzmann (LTE)
populations. Here, and are the radiative
decay rate and H∘-impact de-excitation rate coefficient
respectively. For , the volume rate of line cooling
scales as , rather than
at low density. Because ,
the critical metallicity
exhibits an approximately parabolic shape around its minimum at
for a particular coolant. For a given heavy element,
scales as for , and
as for . The most efficient cooling occurs at
for the fine-structure lines of a given element.
| Species | ) | (cm-3)bb is the critical density of the transition, at which H∘-impact collisional de-excitation ( K) equals radiative decay. | ||
|---|---|---|---|---|
| C II | ||||
| O I | ||||
| Si II | ||||
| Fe II | ||||
2.2. Atomic Data for Metal Lines
2.2.1 C II fine-structure line
The ground state () configuration of C II is treated as a two-level atom, with a fine-structure radiative transition from . The atomic parameters were taken from Hollenbach & McKee (1989). This transition corresponds to m with excitation energy erg and excitation temperature, K. The radiative transition rate is s-1, and the H∘-impact de-excitation rate coefficient is:
| (9) |
where . The critical density for H∘ de-excitation is . The cooling rate is
| (10) |
where is the carbon metallicity and is the solar carbon abundance relative to hydrogen. By detailed balance, we have,
| (11) |
where and are statistical weights.
2.2.2 O I fine-structure and forbidden lines
The ground-state () configuration of O I is a 5-level multiplet, with transitions between fine structure levels arising from (3P2,3P1,3P0,1D2, 1S0). We label these levels, from lowest to highest, as 1–5; their excitation temperatures from the ground (3P2) state are = 227.7 K (3P1) and 326.7 K (3P0). For the excited terms, = 22,523 K (1D2) and 48,661 K (1S0). The fine-structure transitions within the 3P term lie at far-infrared wavelenegths: m () and m (). The optical forbidden lines lie at 6391.5 Å, 6363.8 Å, and 6300.3 Å (from 1D to 3P) and at 2972.3 Å, 2958.4 Å, and 5577.4 Å from the 1S term.
The radiative transition probabilities were taken from tabulations in Osterbrock (1989): s-1, s-1, s-1, s-1, s-1, s-1, s-1, s-1, s-1. The H∘ collisional de-excitation rate coefficients (cm3 s-1) were taken from Hollenbach & McKee (1989): , , . The remainder of the rate coefficients are less well determined and are estimated to be cm3 s-1. The critical density of the first excited state, 3P1 by H∘ de-excitation is . The radiative cooling rate from [O I] was computed from the equilibrium populations, multiplied by their radiative decay rates and line energies.
2.2.3 Si II fine-structure line
For the Si II () ground-state configuration, we also provide a two-level treatment, with a fine-structure radiative transition from . This transition corresponds to 34.8 m with erg and K. The atomic parameters were taken from Hollenbach & McKee (1989). The spontaneous transition rate is s-1, and the H∘-impact de-excitation rate coefficient is:
| (12) |
The critical density for H∘ de-excitation is . As in equation 10, the cooling rate is:
| (13) |
2.2.4 Fe II fine-structure lines
The ground-state (6D) configuration of Fe II is modeled as a 5-level atom, with fine-structure levels of total angular momentum = 9/2, 7/2, 5/2, 3/2, and 1/2 (labeled 1–5 respectively). The fine-structure level energies were taken from the NBS tables (Moore, 1952), and the radiative transition rates were adopted from calculations of the “Iron Project” (Quinet et al., 1996). The fine-structure levels 2–5 have excitation temperatures = 553.6 K, 960.6 K, 1241.1 K, and 1405.7 K above ground. The primary radiative transitions occur at mid-infrared wavelengths: 25.99 m (), m (), m (), and m (). The spontaneous transition rates are: s-1, s-1, s-1, s-1, taken from Quinet et al. (1996), and s-1, taken from Hollenbach & McKee (1989).
The H∘-impact de-excitation rate coefficients were taken from Hollenbach & McKee (1989), with no assumed temperature dependence. These rates (in units cm3 s-1) are: , and . In the absence of information on higher- levels in the 6D multiplet, we have adopted de-excitation rates of cm3 s-1, constant with temperature. The critical density of the first excited state, 6D7/2, resulting from H∘ de-excitation is . We computed the radiative cooling rate from [Fe II] from the statistical equilibrium populations of the excited fine-structure levels, multiplied by their radiative decay rates and line energies.
2.3. Metal cooling
At K, excitation of Ly is no longer an efficient cooling process. Similarly, at K, cooling by pure rotational lines from H2 becomes ineffective. At very low temperatures ( K, HD cooling can be effective, despite the small primordial abundance, (D/H) ppm, owing to its weak dipole transitions (Lepp & Shull, 1984; Lepp et al., 2002). At K, in the absence of external photoionizing sources, the hydrogen gas is completly neutral, and low-energy fine-structure transitions of [C II], [O I], [Si II], and [Fe II], excited by H∘ collisions, become the most important coolants. (We assume that C, Si, and Fe are photoionized by ambient UV radiation from newly formed hot stars.) These fine-structure transitions can also be excited by electrons, once the electron fraction, , rises above about . At redshifts, , the residual electron fraction is , and the electrons contributed by photoionization of trace metals (C+, Si+, S+, Fe+) are negligible. As the cloud cools and condenses, declines owing to recombination of the trace H+.
In Figures 1 and 2 we plot the
four metal cooling functions together with at
metallicities of and , respectively.
In both figures, we show the total cooling function, as well as
individual rates from H2, [C II], [O I], [Si II], and [Fe II].
The low-density cooling rates are for gas with total number
density .
At high densities ( cm-3) and low metallicities
(), cooling by H∘ excitation of
H2 becomes important at K compared to the metal lines.


2.4. Analytic Estimates of Critical Metallicities
The criterion for fragmentation, used to derive , comes from equating heating and cooling functions of the form, and . From equation (5), we have , where . Above the critical density, when the fine-structure levels reach LTE (Boltzmann) populations, the LTE cooling function can be written , where can be derived from the LTE excited populations times the radiative transition rates () and line energies (). Thus, the critical metallicity is
| (14) |
The LTE cooling function, , can easily be evaluated for a two-level atom of element (i) of solar abundance relative to hydrogen:
| (15) |
where and are the statistical weights of the lower and upper states, respectively, of the two-level transition. From the above, we arrive at a convenient analytic expression for the critical metallicity for a given atom and fine-structure coolant, that depends only on its reference abundance and the atomic parameters of the transition:
| (16) |
We can evaluate this expression for the two-level species [C II] and [Si II] at and , where efficient fine-structure LTE cooling begins:
| (17) | |||||
| (18) |
For [O I] and [Fe II], with 3-level and 5-level fine-structure states, respectively, we can apply the 2-level formalism to the lowest two states, to find approximate values,
| (19) | |||||
| (20) |
The critical densities for H∘ de-excitation are: , , , and . These formulae provide reference metallicities, but they are no substitute for the exact calculations described below. For instance, they do not give the temperature dependence implicit in equation (16), arising from the Boltzmann factor for excitation of fine-structure states. However, for LTE conditions at high density, these formulae agree fairly well with the numerical computations. Small differences occur for the multi-level [Fe II] and [O I] lines, since we used a 2-level approximation that becomes inaccurate at higher temperatures by omitting higher states.
3. Results
In § 3.1 we show results from simulations with a single metallicity, , adopting the same relative metal abundances for each of the four metals considered. In § 3.2 we include individual metallicities for C, O, Si, and Fe, using metal yields from PISN calculated by Tumlinson et al. (2004). In our formulation, each metal appears with a different abundance relative to the other three elements, depending on the mass range of progenitors. Our analysis of follows the fragmentation criterion (§ 2), in which we compare the adiabatic heating with cooling rates from metals plus H2. We also present the final properties of the fragmented gas, such as temperature and Jeans mass, for a variety of metallicities and densities.
3.1. Single-metallicity simulations
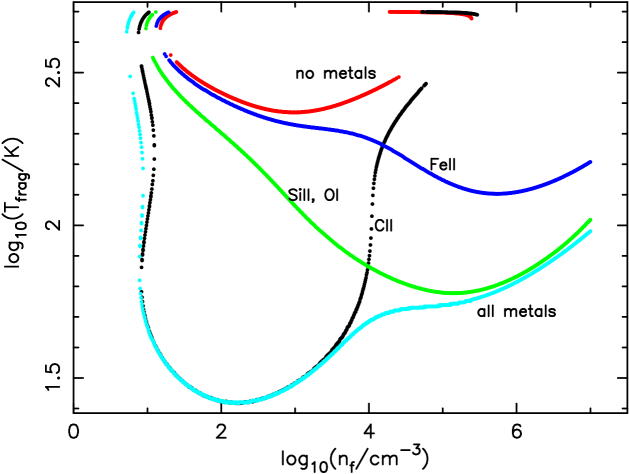
First, we assume that all metals in the gas appear with the same relative abundance, characterized by a single metallicity (). Figure 3 synthesizes the results of many models of cloud evolution, for different initial densities, with an initial temperature of 200 K. The elements are color-coded in groups (C-alone, O plus Si, Fe-alone) reflecting their probable origin from progenitor mass ranges and nucleosynthetic pathways. There are three set of curves corresponding to three choices of the cooling function. In red, we use only metal cooling by [C II]. In green, we use the combined metal cooling function of [Si II] and [O I], and black corresponds to only [Fe II]. We have combined the results for [Si II] and [O I], since these elements come from similar massive stars, and because this presentation makes the results less cluttered. The [O I] 63 m line dominates the cooling when only those two elements are considered.
Each set of three curves (red, green, black) in Figure 3 corresponds to the locus of fragmentation points in metallicity and final density . The code starts with an initial density, corresponding to the point farthest to the left of each curve. Each point on the 10 sets of curves is found by running many simulations for various initial densities and metallicities, until they satisfy the fragmentation criterion () at and density . The double-valuedness in many of the parabolic curves is explained by Figure 4, which shows the cooling rates and equilibria for gas with cm-3 and three metallicities.
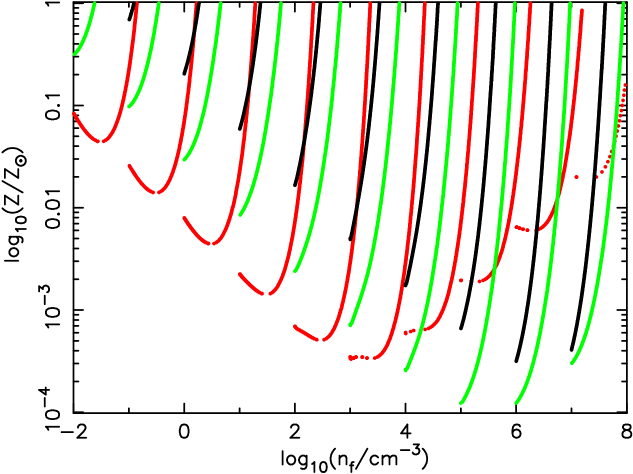
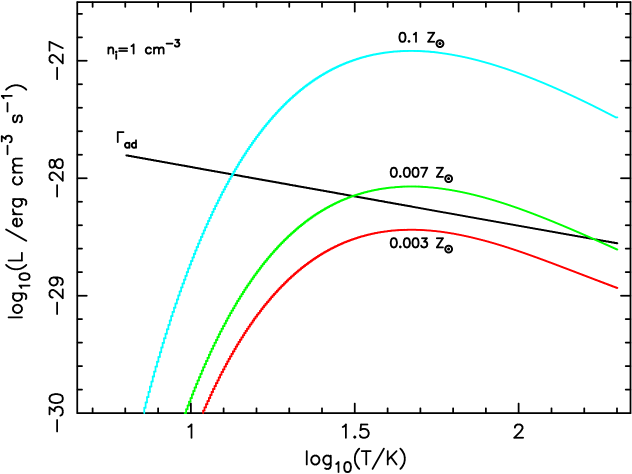
Table 2 summarizes the results of Figure 3 by choosing three particular values of temperature and density relevant for this study. The first column shows the temperature and density of the gas. For the low-density case, we choose the set of three curves corresponding to an initial density of 0.1 cm-3, while the high-density case starts at cm-3. We begin at K, and after the gas cools down, we choose two more temperatures, 150 K and 100 K and their corresponding densities. The next four columns show the metallicity at those temperatures and densities during fragmentation. In the fourth column, all metal lines are included in the cooling function. The last column shows the Jeans mass, , at fragmentation,
| (21) |
taken from Clarke & Bromm (2003), where is the temperature at fragmentation and is the hydrogen number density.
| () | C IIbbColumns 2–5 give the critical metallicity, in units of solar metallicity, corresponding to a choice of metals in the cooling function. Column C II means that only [C II] lines are included; Column labeled “All Metals” includes C, O, Si, Fe. | (O I, Si II) | Fe II | All Metals | ccJeans mass in . Same format as in Table 1, where 1.0(4) denotes . |
| Low | |||||
| 200, 1.0(-1) | |||||
| 150, 1.3(-1) | … | ||||
| 100, 2.0(-1) | … | ||||
| High | |||||
| 200, 1.0(4) | |||||
| 150, 1.3(4) | |||||
| 100, 2.0(4) | |||||
The minimum critical metallicities are calculated from Figure 3 and shown in Figure 5. The bottom panel of Figure 5 shows two sets of curves, to illustrate the slight differences in fragmentation criteria when one equates to cooling by metals-only (dashed lines) and to total cooling (solid lines). In both cases, one can see the transition from non-LTE to LTE of particular emission lines. The minimum value in each curve corresponds to the critical density of the line (see Table 1). The curves turn around when collisional de-excitation of the lines starts to dominate for each metal. The volume cooling rate then scales as rather than . The cooling efficiency is reduced, and higher abundances of metals are needed to reach fragmentation.
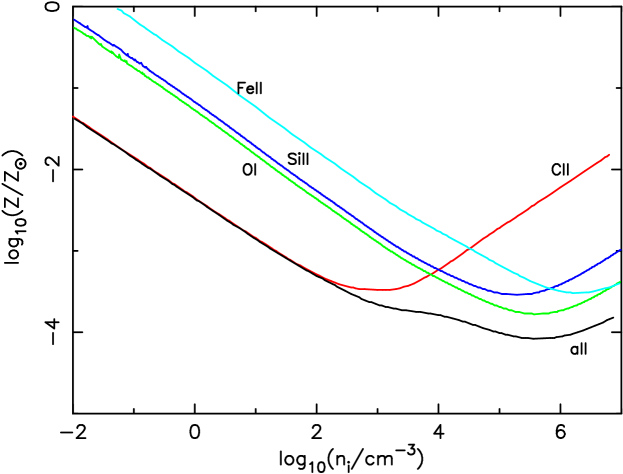
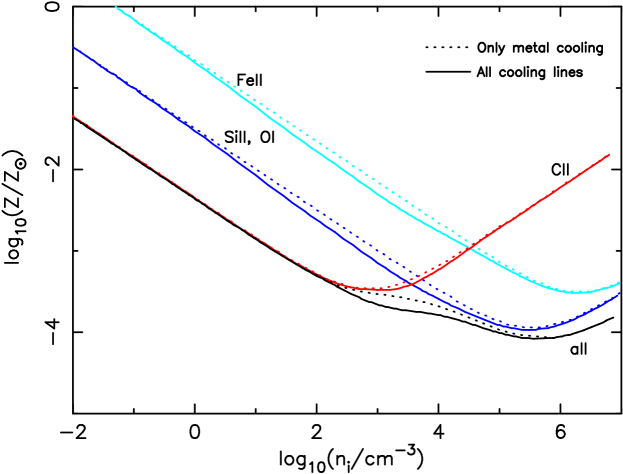
Table 3 shows the values of the minimum critical metallicities for the fragmentation criterion, and for several values of gas density. We choose a range in densities, from cm-3, just below the mean density of gas in virialized halos at , up to cm-3, characteristic of dense cores. Within these halos, and particularly at their center, one expects to find clumps of cooler gas near the threshold of gravitational instability. These star-forming cores may have cooled or been compressed to higher values. There may also be multiple clumps within the halo. These inhomogeneities probably play an important role in how the first star formation is initiated. They may also affect how the heavy elements are incorporated into surrounding gas, how those gas clouds are taken to critical metallicity, and how subsequent generations of stars are produced.
| C II | (O I, Si II) | Fe II | All Metals | |
|---|---|---|---|---|
| (cm-3) | log | log | log | log |
| 0.1 | ||||
| 1.0 | ||||
| 1.0(1) | ||||
| 1.0(2) | ||||
| 1.0(3) | ||||
| 1.0(4) | ||||
| 1.0(5) | ||||
| 1.0(6) | ||||
Figure 6 shows the final state of the gas at the instant of fragmentation. We fix the metallicity and evolve the cooling of the gas, for many initial densities, from K until the fragmentation criterion is satisfied. The final temperature and Jeans mass of the fragments are plotted as a function of the final density of the gas. In both panels, we ran the simulation for five different metallicities, including all the metal lines. The curves correspond to metallicities ranging from to . Larger amounts of metals allow the gas to cool to very low temperatures, as expected. Figure 6 also illustrates the possibility of thermal phase transitions, resulting in a drop in the final temperature. The temperature reaches a minimum at cm-3 for , but rises to cm-3 for . This shift results from a change in primary coolants, from [C II] cooling ( cm-3) to fine-structure lines ([O I], [Si II], [Fe II]) with higher critical densities, cm-3 to cm-3.


Figure 7 shows the same final temperature as in the top panel of Figure 6, emphasizing the effects of specific heavy elements. As labeled, we show cases with no metal lines, only Fe II, only Si II plus O I, only C II, and all four elements in the cooling function. In each case, the metallicity is . At cm-3, the cooling is driven mainly by [O I] lines. This is because the C II levels reach LTE, so its cooling scales as rather than .
3.2. Multiple-Metallicity Simulations
Empirical evidence from extremely metal poor (EMP) halo stars (Christlieb et al., 2002) suggests that many progenitor stars, with a range of masses, contributed to the observed nucleosynthetic patterns. This point was stressed by Tumlinson, Venkatesan, & Shull (2004) and Qian & Wasserburg (2005). When exploring the concept of “critical metallicity”, we need to understand the effects of different mixtures of heavy elements, produced by massive stars and SNe with a range of initial masses.
We adopt the relative abundances of metals from studies of PISN yields. More specifically, we use the results from Tumlinson et al. (2004) who reviewed and critiqued the hypothesis that the primordial stars were VMS. They calculated the theoretical yields from PISN for three progenitor mass ranges: 150–170 , 185–205 , and 240–260 (see their Figure 1). We use these yields and run three sets of simulations, in which we take the Fe abundance as a free parameter. Depending on the range of masses and their yields, we calculate the metallicity of the other three elements (C, O, Si). Table 4 gives the abundances of [C/Fe], [O/Fe], and [Si/Fe] and the mass ranges.
| Mass Range | [C/Fe] | [O/Fe] | [Si/Fe] | [Si/O] |
|---|---|---|---|---|
| 1.4 | 1.9 | 2.4 | 0.5 | |
| 0.4 | 1.2 | 0.8 | ||
Figure 8 shows the minimum metallicity needed for fragmentation for three mass ranges of PISN. The solid line in all panels is the critical metallicity. For each mass range, varies considerably, depending on the dominant elements synthesized. For a mass range 150–170 , the main component of total comes from Si II, and the less important component is Fe II. For the highest mass range, 240–260 , the main metal cooling comes from Fe II, while the least important element is Si II. To a good approximation, C II and O I keep the same relative importance in all three mass ranges, with O I contributing slightly more cooling than C II.
Figure 9 summarizes all the results. The full line shows , considering a single metallicity, while the dashed and dotted lines show from simulations with individual metallicities of C, O, Si, and Fe, given by the theoretical yields of PISN.


3.3. Luminosities and Detection of Cooling Lines
In the preceding sections, we have explored the microphysics of fine-structure cooling of primordial gas, as it makes a transition from H2 cooling to metal fine-structure line cooling. An obvious question is whether such cooling clumps are detectable at high redshift. How much mass must be cooling, and to what metallicity must it be enriched, in order to rise above the threshold of detectability by current and future telescopes?
For redshifts in the range , the fine-structure lines under consideration will shift into the far-infrared (FIR) and sub-millimeter regions of the spectrum. On the ground, partial-transmission windows exist in the sub-mm, near 350 m (333–380 m), 450 m (420–500 m), and 850 m (830–910 m). These FIR windows will be observable on the ground with ALMA. In space, there are several planned missions that offer a chance for more sensitive FIR observations with mirrors cooled to 5–10 K. The SPICA mission is a proposed Japanese infrared astronomical satellite (Matsumoto, 2003) designed to explore the universe with a cooled (4.5 K) telescope of 3.5m aperture. A spectrometer aboard SPICA (Bradford et al., 2003) could reach flux limits of W m-2. An even more ambitious mission is SAFIR (Single Aperture Far Infrared Telescope), a 10m-class, cold (4–10 K) space telescope with hopes of achieving broad-band FIR sensitivity to emission-line fluxes of W m-2 (Lester, 2004; Benford et al., 2004).
To produce detectable FIR line emission, the cooling gas clouds must have baryon masses of at least at metallicities . If the clouds have high densities, , the cooling rate is proportional to mass, and we can estimate the line luminosities from the LTE cooling rates, . Using the results of § 2.4 for K, we estimate that the metal fine structure lines have luminosities:
| (22) | |||||
| (23) | |||||
| (24) | |||||
| (25) |
A similar calculation can be made for the first two rotational lines of H2, at 28.22 m and 17.03 m, assuming LTE populations for the upper rotational levels, and 3. This calculation differs somewhat from the numerical calculations, in which we fix the ortho/para ratio at a constant value 3:1. For the 2-level analytic model,
| (26) | |||
| (27) |
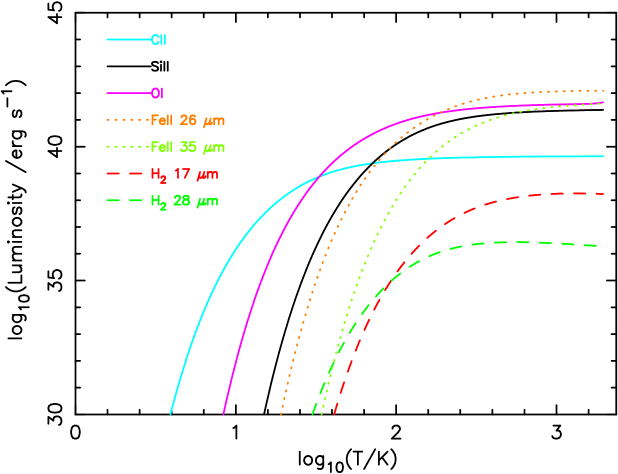
Figure 10 shows the individual line luminosities from a numerical model with of cooling gas at and residual molecular fraction at temperatures ranging from 10–1000 K. Note that the metal fine-structure lines of [O I], [Si II], and [Fe II] are considerably stronger than the H2 rotational lines. Even for metallicities () and molecular fraction (), the [O I] fine-structure line is 200 times stronger than the 17.03 m line of H2 and 1000 times stronger than the 28.22 m line.
At redshifts , the source luminosity distances are . Luminosities of therefore correspond to line fluxes , where we have converted from cgs units to SI units of line sensitivity (W m-2) used by the SAFIR studies. At , is 4 times larger, so these fluxes would drop by another factor of 16.
For a given metallicity, , the strongest lines from metal-enriched clouds are probably [O I] 63.18 m and [Fe II] 25.99 m. Lines of [Si II] (34.8 m) and [C II] (158 m) are ten times weaker, at the same metallicity. However, as we have noted above, it is possible that O, Si, and Fe metallicities could be enhanced in regions contaminated by products of massive stars. For of cooling gas at 1% solar metallicity and K, these lines should have luminosities erg s-1 and fluxes of W m-2 at . Ground-based searches for these lines in the m band would probe redshift intervals and . Searches at other redshifts open up in the space FIR.
4. Discussion and Conclusions
In this paper, we have examined the thermal evolution of a primordial gas that has been enriched with trace amounts of metals. We have assumed that these metals have managed to leave their parent halos (Tumlinson et al., 2004), where the first stars have exploded as supernovae. Therefore, a maximum level of metallicity is reached in the IGM. The purpose of this paper was to calculate the fraction of metals necessary to produce continuum fragmentation and to examine the properties of the gas when this occurs.
The results of this paper have been divided in two parts, in the first part (§ 3.1), we assumed a single metallicity, with C, O, Si, and Fe appearing in relative solar abundances. We used this metallicity as a exploratory parameter to find the instant at which the gas fragments. The second part of our study considered individual metallicities (§ 3.2). This is a more natural approach, in which the fractional abundance for each metal comes from theoretical PISN yields, averaged over various mass ranges, calculated by Tumlinson et al. (2004). In this case, we used Fe as a exploratory parameter and the amount of metallicity for each of the other three metals considered in this paper depends on the mass range of the PISN.
We have neglected in this work any kind of radiative feedback (UV or X-ray), more specifically photo-ionization heating, which raises the temperature of the gas and therefore shutting off star-formation (the temperature raises over K). Another neglected heating process is cosmic rays, which will be examined in a later paper. To compare our results with work done by previous authors, we looked for the point in clump evolution when the cooling rate () equals the adiabatic compressional heating rate. This is the definition used by Bromm & Loeb (2003) for [C II] and [O I] cooling. We have also introduced fine-structure cooling by [Si II] and [Fe II], and we explored the slight differences when one equates the total cooling rate (including molecular cooling) to the compressional heating rate.
Our results at high densities agree well with Bromm & Loeb (2003). However, the required level of metallicity for a gas to fragment at high redshift depends on whether the second-generation star formation is triggered from clumps or from low density gas within the halo. As can be seen from Figures 4 and 8, the critical metallicity is considerably higher (% solar) for the mean gas density, cm-3, typical of virialized halos at . These halos may have denser clumps, into which the first heavy elements are incorporated, but the details of these processes are complicated (Tumlinson, Venkatesan, & Shull 2004). Numerical simulations are probably required to fully understand the metal transport and fraction of metals that escape into the lower-density IGM.
At densities for the important fine-structure coolants, the fragmentation criterion shifts to higher values. Cooling is most efficient at or near the densities, , at which the fine-structure levels reach LTE. For this density environment, the minimum critical metallicities, , are [C/H], [O/H], [Si/H], and [Fe/H]. When all metal transitions are included, we find a minimum and , with a temperature K. In this case, all the metals appear in the cooling function with the same fractional abundance, but these results are highly dependent on the amount of mixing in the gas, which may determine the relative abundances of each metal.
An important parameter to consider in more detail is the initial abundance of residual molecular hydrogen. In all the simulations presented in this paper, the initial fractional abundance was taken as the residual H2 fraction, . We also ran the single-metallicity simulations with (Galli & Palla, 1998). The differences between simulations run with low-H2 and high-H2 residual abundances are small at low densities. The maximum difference in is % at cm-3.
For excitation from the ground vibrational state of H2, the most important rotational cooling lines are at m () and m (), labeled (0-0) S(0) and (0-0) S(1), respectively. Because of their low radiative transition rates, these H2 emission lines are quite weak; the metal fine-structure lines are expected to be considerably stronger, even at K, once the metallicity rises above .
Using individual metallicities for C, O, Si, and Fe, we found an important distinction from the single-metallicity case. These results suggest that, for massive stars enhanced in -process elements (O, Si and Fe), the critical metallicity for fragmentation is much higher than previous works have suggested. Higher metallicities are also required if the metal-enriched gas has lower densities than .
Redshifted fine-structure lines from metal-enriched primordial gas at 200 K could be observable from high-redshift halos. In addition to the weak rotational lines of H2 (28 m and 17 m) and [C II] 157.74 m, the most important coolants are likely to be [O I] 63.18 m, [Si II] 34.8 m, and [Fe II] (25.99 m and 35.35 m). With redshifting, these lines would appear in the FIR sub-mm, and even the mm-band, if .
Acknowledgements
We are grateful to Aparna Venkatesan, Jason Tumlinson, Jason Glenn, and Dan Lester for useful discussions regarding this project, and Phil Maloney for help with the numerical techniques. This research was supported by astrophysics theory grants from NASA (NAG5-7262) and NSF (AST02-06042).
References
- Abel et al. (1997) Abel, T., Anninos, P., Zhang, Y., & Norman, M. L. 1997, New Astronomy, 2, 181
- Benford et al. (2004) Benford, D. J., Amato, M. J., Mather, J. C., Moseley, S. H., & Leisawitz, D. J. 2004, Astrophysics and Space Science, 294, 177
- Blumenthal et al. (1984) Blumenthal, G. R., Faber, S. M., Primack, J. R., & Rees, M. J. 1984, Nature, 311, 517
- Boothroyd et al. (1996) Boothroyd, A. I., Keogh, W. J., Martin, P. G., & Peterson, M. R. 1996, J. Chem,. Phys., 104, 7139
- Bradford et al. (2003) Bradford, C. M., et al. 2003, Proc. SPIE, 4850, 1137
- Bromm et al. (2001) Bromm, V., Ferrara, A., Coppi, P. S., & Larson, R. B. 2001, MNRAS, 328, 969
- Bromm & Larson (2004) Bromm, V., & Larson, R. B. 2004, ARAA, 42, 79
- Bromm & Loeb (2003) Bromm, V., & Loeb, A. 2003, Nature, 425, 812
- Christlieb et al. (2002) Christlieb, N., et al. 2002, Nature, 419, 904
- Ciardi & Ferrara (2005) Ciardi, B., & Ferrara, A. 2005, Space Science Reviews, 116, 625
- Clarke & Bromm (2003) Clarke, C. J., & Bromm, V. 2003, MNRAS, 343, 1224
- Eke et al. (1998) Eke, V. R., Navarro, J. F., & Frenk, C. S. 1998, ApJ, 503, 569
- Fang & Cen (2004) Fang, T., & Cen, R. 2004, ApJ, 616, L87
- Forrey et al. (1997) Forrey, R. C., Balakrishnan, N., Dalgarno, A., & Lepp, S. 1997, ApJ, 489, 1000
- Fuller & Couchman (2000) Fuller, T. M., & Couchman, H. M. P. 2000, ApJ, 544, 6
- Galli & Palla (1998) Galli, D., & Palla, F. 1998, A&A, 335, 403
- Haiman et al. (1996) Haiman, Z., Thoul, A. A., & Loeb, A. 1996, ApJ, 464, 523
- Heger & Woosley (2002) Heger, A., & Woosley, S. E. 2002, ApJ, 567, 532
- Hirasawa (1969) Hirasawa, T. 1969, Progress of Theoretical Physics, 42, 523
- Hollenbach & McKee (1989) Hollenbach, D., & McKee, C. F. 1989, ApJ, 342, 306
- Hutchings et al. (2002) Hutchings, R. M., Santoro, F., Thomas, P. A., & Couchman, H. M. P. 2002, MNRAS, 330, 927
- Le Bourlot et al. (1999) Le Bourlot, J., Pineau des Forêts, G., & Flower, D. R. 1999, MNRAS, 305, 802
- Lepp & Shull (1984) Lepp, S., & Shull, J. M. 1984, ApJ, 280, 465
- Lepp et al. (2002) Lepp, S., Stancil, P. C., & Dalgarno, A. 2002, Journal of Physics B, 35, 57
- Lester (2004) Lester, D. 2004, Proc. SPIE, Astronomical Telescopes and Instrumentation, 5487, 1507
- Matsumoto (2003) Matsumoto, T. 2003, Proc. SPIE, 4850, 1091
- Moore (1952) Moore, C. E. 1952, NBS Circular, 467, 55
- Morton (2003) Morton, D. C. 2003, ApJS, 149, 205
- Nakamura & Umemura (2001) Nakamura, F., & Umemura, M. 2001, ApJ, 548, 19
- Omukai (2000) Omukai, K. 2000, ApJ, 534, 809
- Omukai (2001) —. 2001, ApJ, 546, 635
- Osterbrock (1989) Osterbrock, D. E. 1989, Astrophysics of Gaseous Nebulae and Active Galactic Nuclei (Mill Valley: University Science Books)
- Peebles & Dicke (1968) Peebles, P. J. E., & Dicke, R. H. 1968, ApJ, 154, 891
- Quinet et al. (1996) Quinet, P., Le Dourneuf, M., & Zeippen, C. J. 1996, A&AS, 120, 361
- Rees & Ostriker (1977) Rees, M. J., & Ostriker, J. P. 1977, MNRAS, 179, 541
- Schneider et al. (2002) Schneider, R., Ferrara, A., Natarajan, P., & Omukai, K. 2002, ApJ, 571, 30
- Seager et al. (2000) Seager, S., Sasselov, D. D., & Scott, D. 2000, ApJS, 128, 407
- Spergel et al. (2003) Spergel, D. N., et al. 2003, ApJS, 148, 175
- Stancil et al. (1998) Stancil, P. C., Lepp, S., & Dalgarno, A. 1998, ApJ, 509, 1
- Tumlinson & Shull (2000) Tumlinson, J., & Shull, J. M. 2000, ApJ, 528, L65
- Tumlinson et al. (2004) Tumlinson, J., Venkatesan, A., & Shull, J. M. 2004, ApJ, 612, 602
- Yamada & Nishi (1998) Yamada, M., & Nishi, R. 1998, ApJ, 505, 148
Appendix A Primordial Chemical Reaction Network
Table 5 shows the main chemical reaction between elements in the primordial gas used in our simulations. The gas is composed by H2, H, H+, H, H-, He, He+, He+2, and e-. The reaction rates were compiled from the following authors: Haiman et al. (1996), Galli & Palla (1998), Fuller & Couchman (2000), Stancil et al. (1998) and Abel et al. (1997). The minimal model shown in the table was defined by Hutchings et al. (2002).
| Reaction | Rate (cm3 s-1) | Reference | |
|---|---|---|---|
| 1 | HTL | ||
| 2 | HTL | ||
| 3 | GP | ||
| 4 | FC | ||
| 5 | FC | ||
| 6 | SLD | ||
| 7 | GP | ||
| 8 | SLD | ||
| 9 | , | ||
| GP | |||
| 10 | |||
| AAZN | |||
| 11 | GP | ||
| 12 | HTL | ||
| 13 | |||
| AAZN | |||
| 14 | HTL | ||
| 15 | HTL | ||