CHANDRA OBSERVATIONS OF GAS STRIPPING IN THE ELLIPTICAL GALAXY NGC 4552 IN THE VIRGO CLUSTER
Abstract
We use a ks Chandra observation to study ram-pressure stripping in NGC 4552 (M89), an elliptical galaxy in the Virgo Cluster. Chandra images in the keV band show a sharp leading edge in the surface brightness kpc north of the galaxy center, a cool ( keV) tail with mean density cm extending kpc to the south of the galaxy, and two kpc horns of emission extending southward away from the leading edge. These are all features characteristic of supersonic ram-pressure stripping of galaxy gas, due to NGC 4552’s motion through the surrounding Virgo ICM. Fitting the surface brightness profile and spectra across the leading edge, we find the galaxy gas inside the edge is cooler ( keV) and denser ( cm ) than the surrounding Virgo ICM ( keV and cm ). The resulting pressure ratio between the free-streaming ICM and cluster gas at the stagnation point is for galaxy gas metallicities of , which suggests that NGC 4552 is moving supersonically through the cluster with a velocity km s (Mach ) at an angle towards us with respect to the plane of the sky.
1 INTRODUCTION
Hierarchical models of structure formation, in which galaxies formed at high redshift and rapidly coalesced into groups and clusters through accretion and mergers, have become a compelling paradigm for understanding galaxy evolution. In such dynamically rich environments, galaxies are subject to an array of physical processes that affect their evolution. These physical processes form two broad classes: (1) tidal interactions such as those induced by major mergers (e.g., Lavery & Henry 1988), off-axis galaxy collisions (Müller et al. 1989), galaxy harassment (Moore et al. 1996) or galaxy fly-bys near the core of the cluster potential (Byrd & Valtonen 1990), and (2) gas-gas interactions, notably ram pressure by the intracluster gas (ICM) on the galaxy’s interstellar medium (ISM), due to the galaxy’s motion through the surrounding ICM (Gunn & Gott 1972), or ISM-ISM interactions produced in galaxy-galaxy collisions (Kenney et al. 1995). These gas-dynamical processes may be enhanced by turbulence and viscous effects (Nulsen 1982; Quilis et al. 2000) or inhomogeneities and bulk motions in the ICM gas (Kenney et al. 2004). Combes (2004) and references therein provide a recent overview. No model for galaxy evolution can be complete without a detailed understanding of the gas-dynamics of these interactions. Similarly no model for the evolution of the intracluster medium can be complete without understanding the feedback of gas and energy from the galaxy into the ICM by these gravitational and hydrodynamical stripping processes.
The actions of tidal forces are identified by the appearance of disturbed stellar morphologies, such as stretched stellar tails (see e.g. Gnedin 2003, Vollmer 2003); while the characteristic signatures of hydrodynamic stripping (see e.g. Stevens et al. 1999; Toniazzo & Schindler 2001; Acreman et al. 2003 and references therein) are imprinted on the structure of the hot X-ray emitting gas in and near the galaxy. Notably the ram-pressure experienced by galaxies moving through the dense ICM can produce sharp surface brightness edges (“cold fronts”) along the leading interface between the galaxy and the ICM (Acreman et al. 2003; Machacek et al. 2005a). These cold fronts are contact discontinuities where a sharp rise in surface brightness (gas density) is accompanied by a corresponding drop in gas temperature, and are the galaxy-sized analogues of similar subcluster-scale features identified near the cores of rich clusters (see e.g. Markevitch et al. 2000, Vikhlinin et al. 2001; Mazzotta et al. 2001). The higher pressure found in the cold front compared to that in the cluster gas is balanced by the ram pressure caused by the motion of the cloud (in our case, galaxy) through the surrounding ICM. Tails of stripped galaxy gas have been found to extend to kpc behind the galaxy before fading into the background emission of the ambient cluster gas (see e.g. Forman et al. 1979, White et al. 1991, Rangarajan et al. 1995 for M86; Irwin & Sarazin 1996, Biller et al. 2004 for NGC 4472; Sakelliou et al. 1996 for 4C34.16; Wang et al. 2004 for C153; Machacek et al. 2005a, Scharf et al. 2005 for NGC 1404). Detailed studies of these X-ray features in nearby systems (see, for example, Biller et al. 2004; Machacek et al. 2005a, 2005b; Sun & Vikhlinin 2005; Sun, Jerius & Jones 2005), made possible by the high angular resolution of Chandra and XMM-Newton, not only reveal the nature of the gas-dynamics of the stripping process, but also are one of the few ways to constrain the three dimensional motion of the galaxy as it passes through the group or cluster core (Merrifield 1998; Dosaj et al. 2002).
NGC 4552 (,, J2000) is an elliptical galaxy located east of M87 in subcluster A of the Virgo cluster. Measurement of NGC 4552’s distance modulus using surface brightness fluctuations (Tonry et al. 2001) places it at nearly the same luminosity distance as M87, while NGC 4552’s low line of sight velocity ( km s , NED; Smith et al. 2000) compared to that of M87 ( km s , NED; Smith et al. 2000) implies that NGC 4552 is moving supersonically through the Virgo ICM with at least km s towards us relative to M87. Thus NGC 4552 is a likely candidate for ram-pressure stripping by the cluster gas.
Since NGC 4552 is a member of the large sample of nearby elliptical galaxies used to establish correlations between X-ray emission and other ISM tracers (see e.g. O’Sullivan et al. 2001 and references therein), its global X-ray properties are well studied. Early observations with the Einstein Observatory (Forman, Jones & Tucker 1985; Canizares, Fabbiano & Trinchieri 1987; Roberts et al. 1991; Kim, Fabbiano, & Trinchieri 1992; Eskridge, Fabbiano, & Kim 1995) focused on the measurement of NGC 4552’s total X-ray luminosity to establish the – relation. Subsequent ROSAT observations of NGC 4552 were used to study the possible dependence of this relation on environment (Brown & Bregman 2000; O’Sullivan et al. 2001). Fits to the mean X-ray spectrum for NGC 4552 using ROSAT resulted in mean temperatures for the X-ray gas in the galaxy of keV depending on the spectral model (Davis & White 1996; Brown & Bregman 2000; Matsushita 2001). Using ASCA data, Matsushita, Ohashi, & Makishima (2000) modelled the mean spectrum of NGC 4552 using variable abundance thermal plasma models including an additional bremsstrahlung component in the spectral models to account for the contribution of unresolved point sources in low spatial resolution data. They found mean temperatures keV for NGC 4552, in agreement with the ROSAT studies, but with generally higher abundances (). Most recent studies, across a wide range of wavelengths, have concentrated on the nuclear properties of NGC 4552. A brief review of prior work on the nucleus can be found in Machacek et al. (2006; hereafter known as Paper II), where we present our results from Chandra observations of the central regions of NGC 4552 that show shocks close to the center of NGC 4552 that were produced by recent nuclear activity.
In this paper we use Chandra X-ray observations to focus on the properties of gas in the outer regions of NGC 4552 where hydrodynamic gas stripping is occuring. Our discussion is organized as follows: In §2 we describe the observations and our data reduction and processing procedures. In §3 we present the background subtracted, exposure corrected image of NGC 4552 showing the prominent X-ray emission features of the system: a sharp surface brightness edge to the north, ’horns’ of emission extending away to the south from the surface brightness edge, a ram pressure stripped X-ray tail, a bright nucleus, and bright ringlike features (discussed in detail in Paper II) near the galaxy center. We then discuss our analysis method and main results, including the determination of the gas density and temperature, for gas stripping from the outer regions of the galaxy. We use these results to constrain the velocity of NGC 4552 through the Virgo ICM. In §4 we summarize our results. Unless otherwise indicated all errors correspond to confidence levels and coordinates are J2000. Taking the distance to the dominant elliptical M87 as representative of the distance to subcluster A of the Virgo Cluster containing NGC 4552, the luminosity distance to the cluster is Mpc (Tonry et al. 2001) and corresponds to a distance scale of pc.
2 OBSERVATIONS AND DATA REDUCTION
For our analysis, we used a ks observation of the elliptical galaxy NGC 4552 in Virgo taken with Chandra on 2001 April 22 using the Advanced CCD Imaging Spectrometer array (ACIS, Garmire et al. 1992; Bautz et al. 1998) with ACIS-S (chip S3) at the aimpoint. The focal plane temperature of the instrument was C throughout the observation. The data were analyzed using the standard X-ray processing packages, CIAO version , FTOOLS and XSPEC version . Filtering removed events with bad grades (, , and ) and those with significant flux in border pixels of the event islands (VFAINT mode), as well as any events falling on hot pixels. Use of VFAINT mode improves background rejection by as much as a factor of in the S3 chip for soft X-ray energies ( keV) important to this observation. The data were reprocessed and response files created using the most recent gain tables and instrumental corrections. These included correcting for the time-dependent declining efficiency of the ACIS detector due to the buildup of contaminants on the optical filter (Plucinsky et al. 2003), which is important at energies below keV, and for the slow secular drift (tgain) of the average PHA values for photons of fixed energy.111see Vikhlinin et al. in http://cxc.harvard.edu/contrib/alexey/tgain/tgain.html Periods of anomalously high background (flares) were identified and removed from the data, along with periods of anomalously low count rates at the beginning and end of the observation. This resulted in a useful exposure time of s.
Backgrounds for use in the imaging analyses and spectral measurements of the Virgo Cluster gas were created from the ks period D source free dataset (aciss_D_7_bg_evt_271103) appropriate for the date of observation and instrument configuration.222see http://cxc.harvard.edu/contrib/maxim/acisbg . Identical cleaning, energy and spatial filters were applied to source and background data throughout. We checked the standard normalization of the source free background, set by the ratio of the exposure times, by comparing count rates between the source and background files in the keV energy range, where particle background dominates. We found the standard normalization was too high and renormalized the source free data by a factor of to correct for this difference. Point sources were identified in the field of the S3 chip in the keV energy band using a multiscale wavelet decomposition algorithm set with a detection threshold. The resulting source identifications were excluded from the spectral and surface brightness analyses that follow.
3 RESULTS: RAM PRESSURE STRIPPING OF NGC 4552
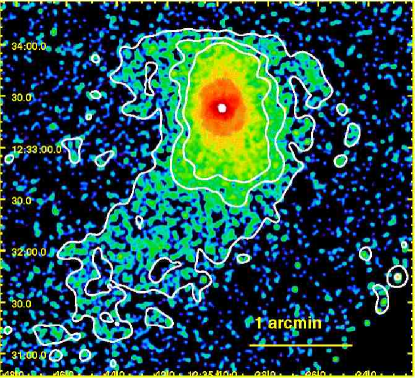
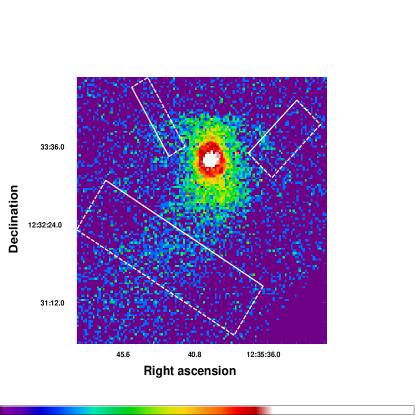
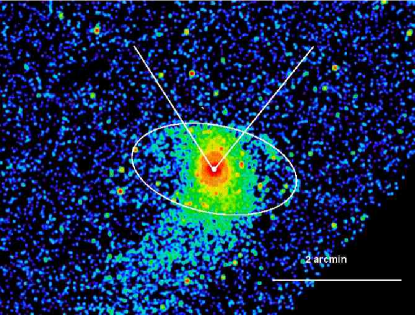
In Figure 1 we present the keV Chandra image of the diffuse emission in NGC 4552 overlaid with X-ray surface brightness contours showing the X-ray features of interest for our analysis. Point sources were removed from the image and the point source regions filled with the local average emission level using CIAO tool dmfilth. The image was then background subtracted, corrected for telescope vignetting and detector response using exposure maps created with standard CIAO tools. First, two narrow band ( and keV) images were background subtracted and exposure corrected using monoenergetic instrument maps of and keV, respectively. The fluxed narrow band images were then summed and smoothed with a Gaussian kernel to produce the image in Figure 1. We chose conservative Gaussian smoothing for our images to minimize potential numerical artifacts from the smoothing algorithm. The smoothing scale represents a compromise between the need for high spatial resolution to map sharp or narrow features and the need to smooth over larger scales to highlight faint extended emission features. We see a sharp, flattened discontinuity (edge) in the surface brightness kpc () north of NGC 4552’s center. Horns of emission extend kpc () to the southeast and southwest away from each side of the flattened edge. An X-ray tail extends kpc () to the south-southeast before becoming indistinguishable from the ambient ICM. In Fig. 2 we show projections across the horns and tail in a keV image of the diffuse emission (binned to pixel size but without background subtraction), demonstrating that these features are highly significant.


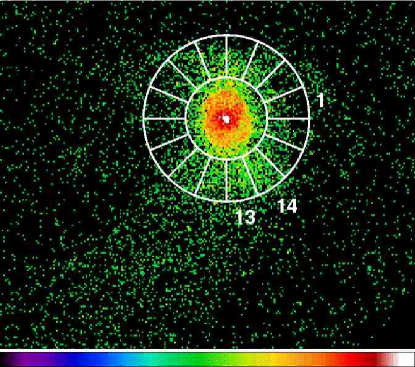

We see in Figure 1 an enhanced region of X-ray emission in the southwest quadrant of the galaxy, near the beginning of the tail, that we denote as the southern lump SL. In Figure 3 we show the keV emission in the galaxy for radii in equal sectors numbered counterclockwise from . As shown in the right panel of Figure 3, X-ray emission from the outer radii of the galaxy is very asymmetric. Enhanced soft emission occurs both in the northen galaxy regions (sectors ), behind the leading edge of the galaxy, and in the southern galaxy regions (sectors ) near the beginning of the tail. The peak in the soft emission for these regions occurs in the southwest quadrant of the galaxy in sectors , at the position of the southern lump (SL). Thus we see that the southern lump SL, as well as the horns and the tail, is also highly significant.
Disturbed X-ray morphologies may arise from tidal interactions caused by a recent or ongoing merger, winds of outflowing material due to a recent starburst, or outflows from a central AGN, as well as from ram pressure stripping of the galaxy ISM due to the motion of the galaxy through the ambient Virgo ICM. For NGC 4552 these first three scenarios are disfavored. Tidal (gravitational) interactions act on both stars and gas, producing characteristic stellar tidal streams or tails (Gnedin 2003; Combes 2004). There is no evidence for disturbed morphology in the stellar distribution of NGC 4552 or for significant extragalactic stellar light that might result, if the observed features were of tidal origin (Bettoni et al. 2003).
A second possibility, given the classification of NGC 4552 as a transition nucleus (Ho et al. 1997), is that the distorted X-ray morphology may be due to winds from a compact nuclear starburst. However, the transition nucleus classification for NGC 4552 is weak, due to uncertainties in the measurement of the H line emission (Ho et al. 1997), and the radio spectrum of NGC 4552 is inconsistent with that expected from such a starburst. The nucleus of NGC 4552 exhibits a compact core radio source with a flat spectrum, whose peak brightness temperature of K (Filho et al. 2004) is several orders of magnitude above the K upper limit (Condon et al. 1991) for the brightness temperature of a compact nuclear starburst. In addition, starburst winds tend to produce conical outflows with associated optical line (H) emission from the interaction between the supernova driven ejecta and the surrounding ISM (see, e.g., Strickland et al. 2000 for NGC 253 and Cecil, Bland-Hawthorn & Veilleux 2002 for NGC 3079), which are not seen in NGC 4552.
A third possibility is that AGN outbursts could be responsible for the distorted X-ray morphology seen at large radii in NGC 4552. The nucleus of NGC 4552 does harbor a supermassive black hole (Filho et al. 2004) and does undergo outbursts, as evidenced by the ring structures seen in Figure 1 and analyzed in detail in Paper II. However, the X-ray signatures of such outbursts are residual bright-rimmed cavities and buoyant bubbles, as found in M87 (e.g., Forman et al. 2005), and/or X-ray edges corresponding to shocks driven into the ambient medium by the outburst (e.g., Fabian et al. 2003 for NGC 1275 in Perseus and Nulsen et al. 2005 for Hydra A). This is quite different from the ‘flattened leading edge - trailing tail’ morphology seen in Figure 1.
In contrast, the qualitative correspondence between the main X-ray features shown in Figure 1, i.e. the leading edge, horns, and tail, and those found in simulations (e.g. see Stevens et al. 1999; Toniazzo & Schindler 2001; Acreman et al. 2003) of ram-pressure stripping of elliptical galaxies moving through surrounding cluster gas is striking. However, since none of these simulations model the specific galaxy, orbital, or cluster characteristics of NGC 4552 in Virgo, only a qualitative, not quantitative, comparison of these simulations to our observation should be made. For supersonic stripping, the galaxy ISM is initially pushed back and fanned out (Stevens et al. 1999, Model 1b, Figure 2; Toniazzo & Schindler 2001, Figure 3; Acreman et al. 2003, Figure 2c, Gyr slice) causing the edge between the galaxy gas and the ICM to flatten, as is seen for NGC 4552 (Fig. 1). This sharp surface brightness discontinuity, kpc north of the galaxy’s center, coupled with a gas tail in the opposite direction, fixes the galaxy’s direction of motion in the plane of the sky. Irregular filaments of stripped material also are seen in simulation images extending back from the leading edge, similar to the ’horns’ we observe in NGC 4552. These filaments signal the onset of Kelvin-Helmholtz instabilities, where stripping is occurring at the boundary between galaxy and ICM gas. In the simulation images, galaxy gas, once stripped and decelerated, forms a distinctive tail of emission behind the galaxy, again similar to what we see in Figure 1. The three-dimensional simulations of Toniazzo & Schindler (2001) demonstrate that the tail is in general not axisymmetric with respect to the direction of motion, but may appear angular or curved, as is also found in our image. Thus the most likely explanation for the origin of the features shown in Figure 1 is ram-pressure stripping of galaxy gas due to the motion of NGC 4552 through the Virgo Cluster ICM. In order to investigate quantitatively these complex gas-dynamical processes and test our ram-pressure-stripping hypothesis, we first determine the spectral properties and densities of hot gas in the surrounding ICM and in NGC 4552’s main emission features.
3.1 Gas Temperatures and Abundances in the Outer Regions
Spectral extraction regions were chosen to isolate, as much as possible given our limited photon statistics, emission from the individual features. The geometries of these spectral extraction regions are listed in Table 1 and are shown in Figure 4.
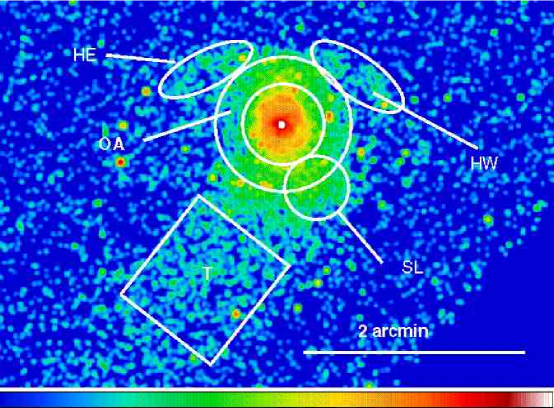
These regions are HE and HW for the eastern and western ’horns’ extending from the northern surface brightness edge to either side of the galaxy, OA for galaxy emission at large radii but inside the northern edge, SL for the region (’lump’) of enhanced emission in the southwestern quadrant of NGC 4552, and T for the tail of emission extending from the galaxy to the south. To determine source existence, one compares the source plus background counts in a region to that expected from the background alone. We also can determine how well the flux can be measured for each feature. We compute both these statistics for regions HE, HW, SL, and T. The background regions we used to compute these measures are listed in Table 2, and the respective areas and observed counts are given in Table 3. We note that the background region (SL_BG) used for region SL, that is embedded in the galaxy, was a neighboring region that included the surrounding galaxy emission. Neighboring Virgo Cluster emission regions were used as local backgrounds to compute these statistics for features HE, HW, and T, since those regions extend outward from NGC 4552 into the Virgo Cluster emission. For each region we find that the cumulative Poisson probability that the observed or greater number of counts could have arisen from a fluctuation of the expected background is . Thus the detection of these features is highly significant. The precision to which the flux can be measured for each feature is given in Table 3, as the net source counts and the total uncertainty in each measurement.
For the analysis below, since the spectra for gas in NGC 4552 and in the X-ray tail are soft, we restrict the spectral fit energy range for the tail (T), horns (HE+HW) and galaxy regions outside the rings to keV, where the source count rates are above background. We initially separated the outer annular region (OA) for NGC 4552 into two separate rectangular regions, one just inside the northern leading edge (NG) and one to the south near the beginning of the tail (SG), to look for temperature differences between these two regions. However, since we found no statistically significant difference between the spectral fits for these regions (see Table LABEL:tab:allspectra), we combined them into the annular region (OA) shown, in order to improve statistics and sharpen our measurement of the temperature and abundance for galaxy gas outside the central region.
3.1.1 Virgo North (VN) Background Region
We chose a rectangular region (VN) centered north of NGC 4552, comprising approximately of the area of the S3 chip, to determine the spectrum of the Virgo Cluster gas in the vicinity of NGC 4552. We fit the spectrum for the Virgo ICM (region VN) over the full keV energy band, where the S3 detector has good efficiency. We fix the hydrogen absorbing column at cm , the Galactic value (Dickey & Lockman 1990) and allow the temperature, abundance and normalization to vary. We find the temperature of the Virgo Cluster ICM to be keV with metal abundance . We then allowed the absorbing column to vary and found no suggestion for increased absorption. Our results are in excellent agreement with previous spectral analyses of the Virgo Cluster ICM using data from Ginga (Takano et al. 1989), ROSAT (Böhringer et al. 1994), and ASCA (Ohashi et al. 1998, Shibata et al. 2001), that find, with Galactic hydrogen absorption, temperatures keV and metal abundances of , at projected distances ( kpc from M87) comparable to that of NGC 4552. We note that the temperature and X-ray emissivity of the Virgo ICM are relatively insensitive to the metal abundance over the abundance range () determined by our fit. If we allow the abundance to vary over this range, we find variations in the Virgo ICM temperature of keV, within the confidence level for the canonical fit, and variations in the inferred keV X-ray emissivity for the cluster gas of .
Region VN also was used as a local background region for galaxy source regions at large radii (NG, SG, OA, SL), the horns (HW+HE) and the tail (T), to remove contamination from Virgo Cluster emission. For spectral fitting, counts were grouped both by using predefined bins resulting in channels of approximately logarithmic width, and by using a minimum counts per bin. Both methods gave consistent spectral model fits. The spectra for all of the above regions are well represented by single-temperature APEC or VAPEC thermal plasma models (Smith et al. 2001) corrected for absorption using Wisconsin photo-electric cross-sections (Morrison & McCammon 1983). Our results for these regions are summarized in Table LABEL:tab:allspectra.
We checked that our results were not sensitive to the position of the local background region (VN) on the detector by recomputing the spectral fits using a second circular region east of NGC 4552 (VE in Table 1) and found no significant differences in the fitted parameters. We also fit the spectra to these regions using blank sky backgrounds (as for VN) and a two component APEC + APEC model. We fixed the temperature and abundance of one APEC component at our best fit values for the Virgo Cluster emission ( keV and , see Table LABEL:tab:allspectra), while allowing the temperature and abundance of the second APEC component and both component normalizations to vary, and found consistent results. Thus our results are not biased by our choice of VN as the local background. Since the models agree within their CL, we present only those results (using background region VN) for the tail and galaxy emission at large radii in Table LABEL:tab:allspectra.
3.1.2 Outer Annulus (OA) of ISM
For fixed Galactic absorption, we find the temperature and abundance of the outer galaxy gas in region OA to be keV and , a metallicity marginally higher than that for the Virgo ICM, but with large uncertainty. To check the stability of the fit, we allowed the absorbing column to vary and found no suggestion for increased absorption above the Galactic value. To assess the effect of any residual unresolved X-ray binaries on our results, we also fit the spectrum for region OA, galaxy emission within the northern edge, over the keV energy range with an absorbed two component model consisting of an APEC component for emission from the diffuse gas and a keV bremsstrahlung component to model unresolved X-ray binaries (Kraft et al. 2001). We fix the hydrogen absorbing column at its Galactic value, while allowing the temperature and abundance in the APEC component and both component normalizations to vary. We find that the fitted temperature ( keV) and abundance () for the thermal component in this two component model agree, within their confidence limits, with the single APEC model results listed in Table LABEL:tab:allspectra. The bremsstrahlung (unresolved binary) component contributes only to the keV luminosity of region OA. This is consistent with theoretical expectations for the contribution of X-ray binaries to the flux in region OA found by integrating the average X-ray luminosity function for LMXB’s (Gilfanov, 2004) below our observed keV point source detection threshold ( erg s cm ) in that region. Thus, the effects of residual unresolved X-ray binaries on the measured properties of the diffuse gas in region OA do not bias the single temperature APEC model results for the properties of the galaxy gas which are important to our analysis. We find that the temperature of the ISM on the galaxy side of the (leading) northern edge ( keV) is a factor lower than the temperature of the gas in the ambient Virgo ICM ( keV). As shown in Figure 1, this temperature drop corresponds to a sharp increase in surface brightness (and thus gas density as quantified in §3.2). This is consistent with the interpretation of the northern edge as a cold front, the leading edge of the galaxy ISM as it undergoes ram pressure stripping, in broad agreement with expectations from simulations (e.g. see Stevens et al. 1999, Figure 2, model 1b; Acreman et al. 2003, Figures 10a & c and 11b & d, Gyr time slice).
3.1.3 Southern ‘Lump’ (SL) Spectrum
Figures 1 and 3 show a bright region (lump) of emission in the outer southwest quadrant of the galaxy. We use a circular region centered at (, ) surrounding the lump (region SL in Figure 4) to isolate the spectrum for this region. Although we find, using an APEC model with Galactic absorption, a temperature keV and abundance formally consistent with the properties of galaxy gas elsewhere outside the central rings in NGC 4552, the is large. The fit is improved () by using an absorbed VAPEC model with a higher iron abundance, while fixing all other abundances at , the mean abundance for the galaxy ISM in region OA. The hydrogen absorbing column remained fixed at the Galactic value. We include this fit in Table LABEL:tab:allspectra. In this VAPEC model, the temperature of the gas in the southern lump is keV, consistent with previous results for gas at large radii, but the iron abundance is increased to near solar values (). This may suggest that the southwest quadrant of the galaxy has either experienced a recent episode of star formation itself or has had metals transported from star forming activity near the galaxy center (expected for a transition type nucleus) to larger radii in the galaxy as a result of outflows.
3.1.4 East and West Horns (HE, HW)
The regions HE and HW for the horn-like features are faint, with region HE and HW containing only and net source counts, respectively, in the keV energy band. In order to improve statistics, we combine these regions and fit their average spectrum (HE+HW in Table LABEL:tab:allspectra). We restrict our models to those with three or fewer free parameters. Neither an absorbed bremsstrahlung model nor absorbed power law model, each with all parameters free to vary, can fully describe the data, giving of and , respectively. A thermal APEC model with Galactic absorption provides a better fit to the data with temperature keV and abundance (). The probability of obtaining this value of or higher, given degrees of freedom, is ( confidence).
The for the model fit to the combined spectrum for the horns might suggest that these two regions are not homogeneous in their spectral properties. We investigate this possibility by fitting the spectrum for each horn individually. Using absorbed APEC thermal plasma models with fixed abundance and Galactic absorption, we find the temperature of gas in the eastern horn HE to be keV () and in the western horn HW to be keV () for abundance, taken from the fit to the combined horn regions HE+HW (see Table LABEL:tab:allspectra). These temperatures vary by when the abundance is varied between to (see Table LABEL:tab:metalscool). Although suggestive, the fitted temperatures agree within their confidence limits. Thus with these data, we can not conclude that the temperatures of the eastern and western horns are significantly different. However, if such a temperature difference were to be confirmed in a deeper exposure, it would not be surprising. The horns are spatially separated and most likely correspond to different stripping events. Temperature differences between gas in the two horns could arise from hydrodynamical effects caused by local temperature and pressure gradients in the different turbulent eddies responsible for the stripping process in each region.
The main conclusion that can be drawn from the current data is that the temperature of the gas in the horns is cool, similar to that measured throughout the outer regions of NGC 4552 (see Table LABEL:tab:allspectra. These temperatures agree within their confidence limits with the temperature ( keV) for gas in the outer radii of NGC 4552 (region OA). In contrast, they are times lower than the keV temperature of the surrounding Virgo Cluster ICM. This is the key property of the gas in the horns that identifies it as galaxy (and not cluster) gas, likely in the process of being stripped. These results are consistent with simulations of ram-pressure stripping (see, e.g. Stevens et al. 1999, Figure 2, model 1b), where irregular filaments due to the onset of hydrodynamical instabilities during stripping are cooler and denser than the surrounding ICM.
3.2 Gas Densities from Fitting the Surface Brightness Profile
In Figure 5 we show the angular sector used to construct the keV surface brightness profile to the north across the flattened surface brightness edge between galaxy gas and the Virgo Cluster ICM, as a function of the mean distance from the center of NGC 4552. The profile is constructed from elliptical annuli constrained to lie within the angular sector centered on the galaxy nucleus and extending from to measured clockwise from east, that was chosen to exclude the horns of emission extending southward from each side of the northern leading edge. The elliptical annuli are concentric to a ‘bounding’ ellipse, with semi-major (-minor) axes of () and position angle of , that traces the shape of the northern surface brightness edge within the angular sector. The radial extent of each elliptical annulus varies logarithmically inward and outward from the bounding ellipse with logarithmic step size .


In the left panel of Figure 6, we show the keV surface brightness profile as a function of the mean distance from the center of NGC 4552 to the north across the flattened surface brightness edge between galaxy gas and the Virgo Cluster ICM. Two sharp surface brightness discontinuities (denoted by vertical dashed lines) are evident in Figure 6: the outer, ‘leading’ edge is at the northern interface between the galaxy cold front and Virgo Cluster gas, and the inner discontinuity is at the position of the rim of the bright northern ring. We analyse the leading edge of the cold front in this paper and the central rings in Paper II.
The observed surface brightness profile is proportional to the product of the X-ray emissivity and the square of the electron density, integrated along the line of sight. By fitting the surface brightness profile, we are able to determine the shape of the density distribution, the location of the edge, and the ratio of electron densities on either side of the edge, averaged over the respective profile bins. If the density is slowly varying over the profile bin, as is the case for a cold front, this measured density ratio is a good measure of the physical density discontinuity across the edge.
As was done for other cold fronts (Markevitch et al. 2000; Vikhlinin et al. 2001; Machacek et al. 2005a), we assume a spherically symmetric power law distribution of the form
| (1) |
for the electron density in NGC 4552 inside the leading edge of the cold front (but outside the central rings), where and are the normalization and power law index for the electron density of NGC 4552 in the cold front, respectively. The radial distance and location of the leading surface brightness discontinuity are measured from the optical center of NGC 4552, i.e. the center of the bounding ellipse.
We model the electron density in the Virgo Cluster ICM (within subcluster A) using a spherically symmetric, isothermal model centered on M87 with , and core radius taken from a fit by Schindler et al. (1999) to ROSAT All-Sky Survey data of the Virgo ICM out to a radius of from M87. We normalize the cluster model using the surface brightness kpc away from NGC 4552, in the undisturbed Virgo ICM (cluster free stream region). We find the central electron density (density model normalization) for the Virgo ICM to be cm , in agreement with previous results (Schindler et al. 1999).
However, to model the electron density, at the interface between galaxy gas in the cold front and the Virgo ICM, requires additional assumptions about the three-dimensional geometry of NGC 4552 relative to the cluster center. We assume that the distance of M87 is representative of the cluster center, at least for subcluster A containing both M87 and NGC 4552. Measurements of distance moduli for NGC 4552 () and M87 (), using I-band surface brightness fluctuations (Tonry et al. 2001), agree within uncertainties, suggesting the two galaxies are at comparable distances. We thus assume that the projected distance between NGC 4552 and M87 is representative of their true physical separation. The electron density of the Virgo ICM, just outside the leading edge, is then cm .
We then use a multivariate minimization algorithm to fit the surface brightness profile across the leading edge, allowing the location of the edge () , the power law index of the electron density inside the edge (), and the discontinuity () to be free parameters. The discontinuity () is given by
| (2) |
where () and () are the X-ray emissivity (electron density) inside () and outside () the leading edge of the cold front. We find the best fit position of the leading, northern edge (cold front) to be kpc from the galaxy center, the slope of the electron density inside the cold front to be , and the discontinuity (given by equation 2) to be . The uncertainties on the discontinuity reflect the CL uncertainties in the slope found for .
While the surface brightness discontinuity depends only on the slope of the power law distribution given by the fit to the surface brightness profile, we see from equation 2 that the ratio of the electron densities inside and outside the leading edge is sensitive, through the X-ray emissivity, to the spectral properties of the gas. In Table LABEL:tab:metalscool we show the dependence of the spectral fit parameters on the galaxy abundances for all the galaxy regions of interest and list the parameters for the nearby Virgo Cluster ICM for comparison. As this table shows, the temperature found for gas in each region is insensitive to the abundance over the range of interest (). On the other hand, since metal lines dominate the cooling function for temperatures keV (Tucker & Gould 1966; Raymond & Smith 1977; Smith et al. 2001), the spectral model normalization, and thus X-ray emissivity, vary by a factor of over the same range. As shown for the infalling elliptical galaxy NGC 1404 in the Fornax Cluster (Machacek et al. 2005a), this may introduce significant uncertainties in modeling the electron density in the galaxy from the surface brightness discontinuity between galaxy and cluster gas.
We use keV X-ray emissivities given in Table LABEL:tab:metalscool derived from our spectral fits, the cluster ICM density outside the cold front ( cm ) determined from the cluster ICM -model, and the measured discontinuity () in equation 2 to infer the electron density inside the cold front. In Table LABEL:tab:properties we show the effect of the uncertainty in NGC 4552’s abundance (and thus emissivity) on the ratio of electron densities inside and outside the leading edge (cold front) and the propagation of that uncertainty through the analysis of the galaxy motion that follows. Since we found no strong metallicity gradients within the galaxy (see Table LABEL:tab:allspectra), we adopt a common mean metallicity for gas in the whole galaxy of , determined from a spectral fit to the galaxy emission within a radius of , excluding resolved point sources and the nucleus. From Table LABEL:tab:metalscool, the keV emissivity for keV galaxy gas at large radii (region OA) with abundance is erg cm s. We take the keV X-ray emissivity for Virgo ICM gas (also from Table LABEL:tab:metalscool) to be erg cm s. The density ratio across the cold front is then found to be , and the electron density at kpc, inside NGC 4552 in the cold front, is cm .
3.3 The Leading Edge of the Cold Front: Constraining NGC 4552’s Velocity
Following Vikhlinin et al. (2001), we use the gas temperature and density ratios across the leading edge in NGC 4552 to calculate the pressure ratio between galaxy gas in the cold front inside the leading edge and undisturbed Virgo cluster gas in the free-stream region. We assume the galaxy gas in NGC 4552 just inside the edge is in pressure equilibrium with cluster gas at the stagnation point just outside the edge, where the relative velocity between NGC 4552 and the cluster gas is zero. Thus is a measure of the pressure ratio between cluster gas at the stagnation point and in the free-stream region, and can be used to determine the Mach number of NGC 4552’s motion relative to the ICM (Landau & Lifschitz 1959; Vikhlinin et al. 2001). In Table LABEL:tab:properties we summarize the dependencies of this velocity analysis for NGC 4552 on the metallicity of the galaxy gas over the abundance range . It is important to note that, because the motion lies on the supersonic, steeply rising branch of the pressure ratio versus Mach number curve (Eq. in Vikhlinin et al. 2001), the Mach number remains well constrained, despite the uncertainties in the density and pressure ratios caused by uncertainties in NGC 4552’s poorly constrained metallicity.
We find that NGC 4552 is moving at Mach through the Virgo Cluster gas. Given the speed of sound in keV gas of km s , the speed of NGC 4552 relative to the ICM is km s . Taking km s , the relative radial velocity between NGC 4552 and M87 (NED, Smith et al. 2000), as the relative radial velocity between NGC 4552 and the surrounding Virgo ICM, we find the component of velocity in the plane of the sky to be km s and the inclination angle of the motion with respect to the plane of the sky to be towards the observer.
3.4 The Ram-Pressure Stripped Tail
With the motion of NGC 4552 through the ICM constrained by the properties of the leading cold front, we can examine the properties of the hot gas in the tail. From Table LABEL:tab:allspectra, we see that the temperature ( keV) of X-ray-emitting gas in the tail is consistent (given the large uncertainties) with the temperature of gas in the outer region of the galaxy OA () and in the horns (), where stripping is expected to be occurring. The gas temperature in the tail is times lower than that of the Virgo ICM, proving that the tail is composed predominantly of ram-pressure-stripped galaxy gas rather than Virgo ICM gas concentrated into a wake. Although poorly constrained due to our limited statistics, the metallicity of gas in the tail () is also consistent with that in the galaxy. The keV luminosity for hot gas in the tail (from region T) is erg s .
We estimate the mean electron density for gas in the tail from the XSPEC APEC spectral model normalization , where
| (3) |
is the angular size distance to the source, is the source redshift, and are the mean electron and hydrogen number densities, respectively, is the gas filling factor, and is the volume of the tail emission region. All quantities are in cgs units. If we assume gas in the tail uniformly fills a cylindrical volume (corresponding to the spectral extraction region T) of radius kpc () and length , where is the inclination angle of the motion with respect to the plane of the sky, we find a mean electron density for hot gas in the tail of cm . As shown in Table LABEL:tab:metalscool and reflected by the large uncertainties, the APEC model normalization , and thus the inferred mean electron density, are strongly dependent on the metallicity of the tail. Assuming the “best fit” model for the tail (, keV, ), the mean electron density in the tail (region T) is cm . Thus the tail is cooler and denser than the surrounding ICM, as expected from simulations (see, e.g. Stevens et al. 1999, Figure 2, Model 1b).

In Figure 7 we compare the surface brightness in a rectangular region of width kpc projected onto the tail’s central axis in kpc bins along the length of the tail (filled circles) to the projection of the surface brightness of the surrounding Virgo ICM in a parallel region of the same dimensions, orientation, and bin size (open squares). We define the beginning of the tail (and of the projection in Figure 7) at the point kpc south of NGC 4552’s center, where the tail visually appears distinct from the galaxy’s more spherical, hot gas halo (see Figure 1). The solid and long-dashed lines denote the best linear fits to the projected surface brightness of the tail and Virgo ICM, respectively. As expected from the -model for the Virgo ICM (Schindler et al. 1999), the projected surface brightness of the Virgo ICM at the distance of the tail from M87 is very flat, consistent with being constant. In contrast the projected surface brightness of the tail declines by a factor before becoming indistinguishable from the surrounding Virgo ICM. Defining the length of the observed tail, in the plane of the sky, as the distance from where the tail appears distinct from NGC 4552 to where it fades into the Virgo ICM, we estimate this length to be kpc (from Figure 7), corresponding to a physical length (given ) of kpc. Using our derived mean density of cm and assuming uniform filling of a cylindrical volume of radius kpc and physical length kpc, we estimate the gas mass in the observed tail to be .
We find the mean thermal pressure for gas in the tail to be keV cm , where the errors reflect the CL combined uncertainties due to the measured tail gas temperature and metallicity and NGC 4552’s inclination angle . We estimate the mean pressure of the surrounding ICM using the Virgo ICM -model evaluated at the midpoint of the cylindrical emission region (T). Since the perpendicular ( dependent) component of the distance between the midpoint of region T and the Virgo Cluster center (taken to be M87) is small ( for ) compared to the transverse component (), the dependence of the cluster gas electron density can be ignored. We find the mean thermal pressure for undisturbed Virgo Cluster gas at the location of the tail to be keV cm . Although the uncertainties are large, these data suggest that the thermal pressure of the undisturbed ICM alone may not be sufficient to establish pressure equilibrium with the stripped gas in the tail. This is in agreement with simulations that find the stripped ISM may not be in pressure equilibrium with the ambient medium, but that gas in the tail expands while it is removed (Toniazzo & Schindler 2001; Heinz et al. 2003).
If we assume the gas, once heated and stripped from the galaxy, is free to expand adiabatically at approximately the tail sound speed ( km s for keV gas), we can use the initial tail radius to estimate the time needed for gas in the tail to reach pressure equilibrium with the undisturbed ICM (Machacek et al. 2005b), i.e.
| (4) |
for a monatomic ideal gas with adiabatic index , where and are the initial and final thermal pressures in the tail. Assuming thermal pressures dominate, the final tail pressure is approximately the pressure of the surrounding ICM. Using the best APEC model fit parameters for the tail gas, , and initial radius kpc (from region T), we find the time for the tail to expand to equilibrium to be Myr. Given NGC 4552’s transverse velocity of kms, gas at the end of the observable tail ( kpc downstream in the plane of the sky) has had Myr more time to expand than gas now found near the beginning of the tail, and so the southern end of the tail may be nearly in pressure equilibrium with the ICM.
As the gas density in the tail decreases due to adiabatic expansion, we would expect the tail to broaden and fade. From conservation of entropy, the mean density and temperature of the tail gas at pressure equilibrium would be cm and keV, with an expected corresponding decrease in surface brightness by a factor . Although our statistics are too limited to directly observe a temperature decline in the tail, the observed rapid fading of the tail, by a factor from Figure 7, is broadly consistent with that expected from adiabatic expansion.
3.5 In Search of the Bow Shock
For supersonic motion one would expect a bow shock to form in the Virgo ICM in front of the galaxy. However, the bow shock is likely to be the least visible of the three features (cold front, tail, bow shock) expected from supersonic ram pressure stripping (Stevens et al. 1999). The primary reason for this is that the shock front is narrow and the observed properties are very sensitive to projection effects. While the Rankine-Hugonoit conditions (§ Landau & Lifshitz 1959) predict a peak density and temperature jump of and at the shock front for Mach motion through the cluster gas, the observed temperature and density jumps will be much lower, primarily due to integration along the line of sight that crosses mostly through unshocked cluster gas, and to projection effects caused by the fact that the motion of NGC 4552 is not in the plane of the sky, but at an inclination angle of out of the plane towards the observer.
Following Vikhlinin et al. (2001) we estimate the approximate location of the bow shock in front of NGC 4552 from the Mach number and the location () of the body sonic point, i.e. the point on the body where the flow velocity equals the sound speed of the cluster gas. is the coordinate of the body sonic point measured along the axis of symmetry and is the radial distance of the body sonic point from the axis of symmetry (see Vikhlinin et al. 2001, Figure 9). As Vikhlinin et al. (2001) describe, we derive the shock position using Moeckel’s (1949)333Approximate Method for Predicting Form and Location of Shock Waves, NACA Techical Note 1921. Available online at http://naca.larc.nasa.gov/reports/1949/naca-tn-1921. Figure 7, that shows the ratio of the shock detachment distance , where is the location of the bow shock along the symmetry axis, versus the radial coordinate of the body sonic point as a function of the Mach number. For a Mach shock, . Thus if the body sonic point is known, the calculation of the shock position is well determined. If the body being stripped has a well defined shoulder, as in A3667 (Vikhlinin et al. 2001), the body sonic point is at the location of the shoulder. However, in NGC 4552 (see Figure 1), the ‘horns’ make the precise location of the shoulder difficult to discern. Instead we use Figure 9 of Moeckel (1949) to find the body sonic point for Mach motion as that point on the body surface where the angle, , of the tangent line from the symmetry axis to the body surface is . Again the precise shape of the body surface is uncertain due to the irregular ‘horns’. We estimate the ‘body surface’ of the galaxy by a sphere centered on the galaxy nucleus with a radius of kpc (the radial distance to the leading edge). This approximately spherical shape is consistent with the distribution of optical light and broadly consistent with the galaxy gas excluding the horns and the tail. We then find kpc, the shock detachment distance , and the distance , between the position of the leading edge and the body sonic point along the symmetry axis, of kpc. Rewriting the shock detachment distance , we expect the bow shock to intersect the symmetry axis at kpc outside the leading edge or equivalently at kpc from NGC 4552’s center. It is interesting to note that the surface brightness outside the leading edge, shown in Figure 6, does increase by a factor between kpc, broadly consistent with this picture. While suggestive, a much deeper observation is needed to establish whether or not this rise is actually evidence for the expected bow shock.
The density and thus surface brightness are also expected to rise in the stagnation region as the gas behind the shock slows and is adiabatically compressed in front of the leading edge (Vikhlinin et al. 2001). Again a rise in the surface brightness is observed in Figure 6 in front of the northern edge (kpc). However, this observed rise in surface brightness also could partly be due to galaxy gas being stripped by instabilities to form the horns. The expected temperature rise in the gas behind the shock front, as seen, e.g., in simulation slices by Stevens et al. (1999), would not be observable in our data due to dilution by unshocked gas projected along the line of sight and our limited statistics over the small region (Mach angle ) between the shock front and the galaxy.
4 CONCLUSIONS
In this work we analysed a ks Chandra observation of the elliptical galaxy NGC 4552 in the Virgo Cluster and found X-ray evidence for ram-pressure stripping in the outer regions of the galaxy, due to its supersonic motion through the Virgo ICM. We find the following:
-
1.
The keV X-ray emission shows the classic features of a cold front and ram-pressure stripping as a gas rich galaxy moves supersonically within a rich cluster. We see: (1) a sharp, flattened leading surface brightness edge located kpc from the center of NGC 4552 due to the ram-pressure of the Virgo ICM, (2) two horns of emission extending kpc to either side of the edge that are composed of galaxy gas in the process of being stripped due to the onset of Kelvin-Helmholtz instabilities, and (3) a tail of emission extending kpc behind NGC 4552 opposite the leading edge.
-
2.
Galaxy gas inside the leading edge is cool ( keV) compared to the surrounding keV Virgo ICM. The surface brightness distribution inside the leading edge is well fit by a power law density distribution cm (for ), where kpc is the position of the edge. The density ratio between gas inside the cold front and the surrounding Virgo ICM, found from fitting the surface brightness profile, is for galaxy ISM metal abundances from to .
-
3.
Assuming NGC 4552 and M87 both lie in the plane of the sky, the resulting pressure ratio () between the free-streaming ICM and cluster gas at the stagnation point implies that NGC 4552 is moving supersonically (Mach ) through the cluster gas with speed km s at an angle towards us with respect to the plane of the sky.
-
4.
The properties of the X-ray tail behind NGC 4552 are consistent with it being composed primarily of ram-pressure stripped galaxy gas. The tail is cool, with mean temperature keV, and denser than the Virgo ICM, with cm for . Although the errors are large, mostly due to uncertainties in the tail gas metallicity, the mean thermal pressure of gas in the tail suggests that it is over-pressured with respect to the ambient ICM. The subsequent adiabatic expansion of gas in the tail may partially explain the rapid fading of the tail with distance from the galaxy.
References
- Acreman et al. (2003) Acreman, D., Stevens, I., Ponman, T., & Sakelliou, I. 2003, MNRAS, 341, 1333
- Bautz et al. (1998) Bautz, M.W., et al. 1998, X-ray Optics, Instruments and Missions, ed. R.B. Hoover & A.B. Walker, Proc. SPIE, 3444, 210
- Bettoni et al. (2003) Bettoni, D., Galletta, G. & Garcia-Burill0, S. 2003, A & A, 405, 5
- Biller et al. (2004) Biller, B.A., Jones, C., Forman, W.R., Kraft, R. & Ensslin, T. 2004, ApJ, 613, 238
- Böhringer et al. (1994) Böhringer, H., Briel, U. G., Schwarz, R. A., Voges, W., Hartner, G., & Trümper, J. 1994, Nature, 368, 828
- Brown & Bregman (2000) Brown, B. & Bregman, J. 2000, ApJ, 539, 592
- Byrd & Valtonen (1990) Byrd, G. & Valtonen, M. 1990, ApJ, 350, 89
- Canizares, Fabbiano, & Trinchieri (1987) Canizares, C., Fabbiano, G. & Trinchieri, G. 1987, ApJ, 312, 503
- Cecil, Bland-Hawthorn & Veilleux (2002) Cecil,G., Bland-Hawthorn, J. & Veilleux, S 2002, ApJ, 576, 745
- Combes (2004) Combes, F. 2004, in IAU Symposium 217: Recycling Intergalactic and Interstellar Matter, ed. P.-A. Duc, J.Braine, & E. Brinks, ASP Conference Series, vol. 217 (San Franscisco, Astronomical Society of the Pacific), 440
- Condon et al. (1991) Condon, J., Huang, Z.-P., Yin, Q.F., Thuan, T.X. 1991, ApJ, 378, 65
- Davis & White (1996) Davis, D & White, R. 1996, ApJ, 470, L35
- Dickey & Lockman (1990) Dickey, J.M. & Lockman, F.J., 1990, ARAA, 28, 215
- Dosaj et al. (2002) Dosaj, A., Forman, C., Forman, W.R., Markevitch, M., & Vikhlinin, A. 2002, BAAS, 34, 712
- Eskridge, Fabbiano, & Kim (1995) Eskridge, P., Fabbiano, G. & Kim, D.-W. 1995, ApJS, 97, 141
- Fabian et al. (2003) Fabian, A.C., Sanders, J.S., Allen, S.W., Crawford, C.S., Iwasawa, K., Johnstone, R.M., Schmidt, R.W., & Taylor, G.B. 2003, MNRAS, 344, L43
- Filho et al. (2004) Filho, M.E.,Fraternali, F., Markoff, S., Nagar, N.M., Barthel, P.D., Ho, L.D., and Yuan, F. 2004, A & A, 418, 429
- Forman, Jones & Tucker (1985) Forman, W., Jones, C. & Tucker, W. 1985, ApJ, 293, 102
- Forman et al. (1979) Forman, W., Schwarz, J., Jones, C., Liller, W.,& Fabian, A. 1979, ApJ, 234, L27
- Forman et al. (2005) Forman, W., Nulsen, P., Heinz, S., Owen, F., Eilek, J., Vikhlinin, A., Markevitch, M., Kraft, R., Churazov, E., Jones, C. 2005, ApJ, in press, eprint astro-ph/0312576
- Garmire et al. (1992) Garmire, G.P. et al. 1992, AIAA, Space Programs and Technologies Conference, March 24-27, 1992 (Paper 92-1473; New York: AIAA)
- Gilfanov (2004) Gilfanov, M. 2004, MNRAS, 349, 146
- Gnedin (2003) Gnedin, O.J. 2003, ApJ, 582,141
- Gunn & Gott (1972) Gunn, J., & Gott, J. 1972, ApJ, 176, 1
- Heinz et al. (2003) Heinz, S., Churazov, E., Forman, W., Jones, C., & Briel, U.G. (2003), MNRAS, 346, 13
- Ho et al. (1997) Ho, L.C., Filippenko, A.V. & Sargent, W.L.W. 1997, ApJS, 112, 315
- Irwin & Sarazin (1996) Irwin, J.A. & Sarazin, C.L. 1996, ApJ, 471, 683
- Kenney, et al. (1995) Kenney, J., et al. 1995, ApJ, 438, 135
- Kenney, et al. (2004) Kenney, J., van Gorkom, J.H. & Vollmer, B. 2004, astro-ph/0403103
- Kim, Fabbiano & Trinchieri (1992) Kim, D.-W., Fabbiano, G., & Trinchieri, G. 1992, ApJS, 80, 645
- Kraft et al. (2001) Kraft, R., Kregenow, J.M., Forman, W.R., Jones, C., & Murray, S.S. 2005, ApJ, 560, 675
- Landau & Lifshitz (1959) Landau, L.D. & Lifshitz, E.M. 1959, Fluid Mechanics (London: Pergamon), Chapter IX
- Lavery & Henry (1988) Lavery, R. & Henry, J.P. 1988, ApJ, 330, 596
- (34) Machacek, M., Dosaj, A., Forman, W., Jones, C., Markevitch, M., Vikhlinin, A., Warmflash, A., & Kraft, R. 2005a, ApJ, 621, 663
- (35) Machacek, M., Nulsen, P., Stirbat, L., Jones, C. & Forman, W.R. 2005b, ApJ, 630, 280
- Machacek et al. (2006) Machacek, M., Nulsen, P.e.J., Jones, C., & Forman, W.R. 2006, ApJ, submitted (Paper II)
- Markevitch et al. (2000) Markevitch, M. et al. 2000, ApJ, 541, 542
- Matsushita (2001) Matsushita, K 2001, ApJ, 547, 693
- Matsushita, Ohashi, & Makishima (2000) Matsushita, K., Ohashi, T. & Makishima, K. 2000, PASJ, 52, 685
- Mazzotta et al. (2001) Mazzotta, P., Markevitch, M., Vikhlinin, A., Forman, W.R.,David, L. & VanSpeybroeck, L. 2001, ApJ, 555, 205
- Merrifield (1998) Merrifield, M.R. 1998, MNRAS,294, 347
- Moore, et al. (1996) Moore, B., Katz, N., Lake, G., Dressler, A., & Oemler, A. 1996, Nature, 379, 613
- Moekel (1949) Moekel, W.E. 1949, Approximate Method for Predicting Form and Location of Detached Shock Waves Ahead of Plane or Axially Symmetric Bodies, NACA Technical Note 1921, available online at http://naca.larc.nasa.gov/reports/1949/naca-tn-1921
- Morrison & McCammon (1983) Morrison, R. & McCammon, D. 1983, ApJ, 270, 119
- Müller, et al. (1989) Müller, M., Mair, G., & Hillebrandt, W. 1989, A&A, 216, 19
- Nulsen (1982) Nulsen, P.E.J. 1982, MNRAS, 198, 1007
- Nulsen et al. (2005) Nulsen, P.E.J., McNamara, B.R., Wise, M.W., & David, L.P. 2005, ApJ, 628, 629
- Ohashi et al. (1998) Ohashi, T. et al. in IAU symposium 188, The Hot Universe, ed. K Koyama, S. Kitamoto, & M. Itoh (Dordrecht:Kluwer), 317
- O’Sullivan et al. (2001) O’Sullivan, E., Forbes, D.A. & Ponman, T. J. 2001, MNRAS, 328, 461
- Plucinsky et al. (2003) Plucinsky, P.P., Schulz, N.S., Marshall, H.L., Grant, C.E., Chartas, G., Sanwal, D., Teter, M., Vikhlinin, A.A., Edgar, R.J., Wise, M.W., Allen, G.E., Virani, S.N., DePasquale, J.M. & Raley, M.T. 2003, in Proceedings of The SPIE X-ray and Gamma-Ray Telescopes and Instruments for Astronomy, ed. J.E. Trluemper & H. Tannenbaum, Proceedings of The SPIE, 4851, 89
- Quilis, et al. (2000) Quilis, V., Moore, B., & Bower, R. 2000, Science,288, 1617
- Rangarajan et al. (1995) Rangarajan, F.V.N., White, D.A., Ebeling, H. & Fabian, A. 1995, MNRAS, 277, 1047
- Raymond & Smith (1977) Raymond, J.C. & Smith, B.W. 1977, ApJS, 35, 419
- Roberts et al. (1991) Roberts, M., Hogg, D., Bregman, J., Forman, W.R. & Jones, C. 1991, ApJS, 75, 751
- Sakelliou et al. (1996) Sakelliou, I., Merrifield, M.R., & McHardy, I.M. 1996, MNRAS, 283, 673
- Scharf, et al. (2005) Scharf, C.A.,Zurek, D.R., & Bureau, M. 2005, ApJ, 633, 154
- Schindler et al. (1999) Schindler, S., Binggeli, B., Böhringer, H. 1999, A & A, 343, 420
- Shibata et al. (2001) Shibata, R., Matsushita, K., Yamasaki, N.Y., Ohashi, T., Ishida, M., Kikuchi, K, Böhringer, H., & Matsumoto, H. 2001, ApJ, 549, 228
- Smith et al. (2000) Smith, R.J., Lucey, J.R., Hudson, M.J., Schlegel, D.J. & Davies, R.L. 2000, MNRAS, 313, 469
- Smith et al. (2001) Smith, R.K., Brickhouse, N.S., Liedahl, D. A. & Raymond, J.D. 2001, ApJ, 556, L91
- Stevens et al. (1999) Stevens, I.R., Acreman, D. & Ponman, T.J. 1999, MNRAS, 310, 663
- Strickland et al. (2000) Strickland, D, Heckman, T., Weaver, K., & Dahlem, M. 2000, AJ, 120, 2965
- Sun & Vikhlinin (2005) Sun, M. & Vikhlinin, A. 2005, ApJ, 621, 718
- Sun, Jerius & Jones (2005) Sun, M., Jerius, D. & Jones, C. 2005, ApJ, submitted, eprint astroph/0501501
- Takano et al. (1989) Takano, S. et al. , 1989, Nature, 340, 289
- Toniazzo & Schindler (2001) Toniazzo, T., & Schindler, S. 2001, MNRAS, 325, 509
- Tonry et al. (2001) Tonry, J.L., Dressler, A., Blakeslee, J.P., Ajhar, E.A., Fletcher, A.B., Luppino, G.A. Metzger, M.R. & Moore, C.B. 2001, ApJ, 546, 681
- Tucker & Gould (1966) Tucker, W. & Gould, R. 1966, ApJ, 144, 244
- Vikhlinin et al. (2001) Vikhlinin, A., Markevitch, M. & Murray, S.S. 2001, ApJ, 551, 160
- Vollmer (2003) Vollmer, B. 2003, A&A, 398, 525
- Wang et al. (2004) Wang, Q.D., Owen, F., Ledlow, M., & Keel, W. 2004, in Proc. IAU Colloq. 195, Outskirts of Galaxy Clusters: Intense Life in the Suburbs, ed. A. Diaferio (Cambridge: Cambridge Univ. Press), 78
- White et al. (1991) White, D., Fabian, A., Forman, W., Jones, C. & Stern, C. 1991, ApJ, 375, 35
| Region | Shape | Center | Dimensions | Orientation |
|---|---|---|---|---|
| RA, DEC | arcsec | degrees | ||
| VN | rectangular | , | , | |
| VE | circular | , | ||
| NG | rectangular | , | , | |
| SG | rectangular | , | , | |
| OA | annular | , | , | |
| SL | circular | , | ||
| HW | elliptical | , | , | |
| HE | elliptical | , | , | |
| T | rectangular | , | , |
Note. — WCS coordinates for the centers of the regions are J2000. Dimensions specified are radii for circular regions, (inner, outer) radii for annular regions, (length,width) for rectangular regions and semi-(major, minor) axis for elliptical regions. Orientation angles are for a region’s major axis measured counterclockwise from west (+x axis in Figure 4). Source regions are also shown in Figure 4 except for regions NG and SG, that were combined into the larger region OA to improve statistics. HW and HE were combined into a single “horn” region (HE+HW) in the spectral analysis to improve statistics for the horns.
| Region | Shape | Center | Dimensions |
|---|---|---|---|
| RA, DEC | arcsec | ||
| HE_BG | circular | , | |
| HW_BG | circular | , | |
| SL_BG | elliptical | , | , |
| T_BG | circular | , |
Note. — Background regions used to compute the uncertainty in the flux measurement for regions HE, HW, R, SL, and T are denoted as HE_BG, HW_BG, SL_BG, and T_BG, respectively. WCS coordinates for the centers of the regions are J2000. Dimensions specified are radii for circular regions, (inner, outer) radii for the annular region, and semi-(major, minor) axis for the elliptical region. The major axis of the elliptical region is oriented at measured counterclockwise from west (+x axis in Figure 4). Source regions are listed in Table 1 and are shown in Figure 4.
| Region | Region | Region | Bkgd | Bkgd | Bkgd | Source |
|---|---|---|---|---|---|---|
| ID | Cnts | Area | ID | Cnts | Area | Cnts |
| HE | HE_BG | |||||
| HW | HW_BG | |||||
| SL | SL_BG | |||||
| T | T_BG |
Note. — The columns represent (1) region identifier, (2) total counts in the keV energy band, (3) area of the region in arcsec, (4) background region identifier, (5) counts in the background region in the keV energy band, (6) background region area in arcsec, and (7) the net source counts and the uncertainty. The above counts and areas exclude contributions from point sources identified in each region. These are counts from point sources ( arcsec) for region HE, counts from point source ( arcsec) for region HW, counts from point sources ( arcsec) for background region HE_BG (HW_BG), counts from point source ( arcsec) for region SL, counts from point sources ( arcsec) for region SL_BG, counts from point source ( arcsec) for region T, and counts from point sources ( arcsec) for region T_BG.