Deep Extragalactic VLBI-Optical Survey (DEVOS)
We present the results of the pilot observations of the Deep Extragalactic VLBI-Optical Survey (DEVOS). Our ultimate aim is to collect information on compact structures in a large sample of extragalactic radio sources ( objects) up to two orders of magnitude fainter than those studied in typical imaging Very Long Baseline Interferometry (VLBI) surveys up until now. This would lead to an unprecedented data base for various astrophysical, astrometric and cosmological studies. The first global VLBI observations of the DEVOS programme were successfully conducted in May 2002. We selected sources without any spectral criterion from the Very Large Array (VLA) Faint Images of the Radio Sky at Twenty-centimeters (FIRST) catalogue, that are also detected with the Multi-Element Radio Linked Interferometer Network (MERLIN). The DEVOS pilot sample sources are in the area of the sky that is covered by the Sloan Digital Sky Survey (SDSS). We describe the sample selection and present high resolution 5-GHz radio images of the sources. Based on the results of this pilot study, we estimate the outcome of and the resources needed for a full-scale DEVOS project.
Key Words.:
techniques: interferometric – radio continuum: galaxies – galaxies: active – quasars: general – surveys1 Introduction
Very Long Baseline Interferometry (VLBI) imaging surveys provide data – milli-arcsecond (mas) resolution images – for large samples of extragalactic radio sources, thus enabling studies of the nature of physical phenomena in the close vicinity of the central engine in active galactic nuclei (AGNs). Completed and ongoing VLBI surveys are reviewed by Gurvits (gurvits02 (2002)).
Until recently, large-scale VLBI surveys at GHz frequencies were usually targeted, and the samples are flux density limited at mJy. The surveys often apply spectral selection criteria to observe mostly flat-spectrum radio sources (e.g. Beasley et al. beasley02 (2002), Scott et al. vsop (2004)). These samples are therefore dominated by relatively nearby () luminous AGNs. Novel approaches – aiming at the fainter radio source population – like phase-reference imaging around strong calibrator sources, and deep wide-field imaging in particular, are summarised by Garrett et al. (2005b ).
In order to reach conclusive results on the intrinsic properties of sources as well as possible imprints of cosmological models in the source structures, one has to match in luminosity sources detected and imaged with VLBI at low redshift (e.g. ) with those at high redshift (). This requires VLBI study of sources of luminosities W Hz-1, corresponding to mJy-level flux densities. This work can be carried out with sensitive VLBI arrays (lower noise, larger apertures, broader bands, higher stability of the signal paths) using innovative observing techniques. It now seems feasible to increase the total number of VLBI-imaged extragalactic sources to at least .
The applications of data from VLBI surveys include astrophysical and cosmological studies of powerful compact radio sources. In order to place the objects in the cosmological context, redshift measurements are also required. With the advent of large optical surveys (e.g. the Sloan Digital Sky Survey, SDSS, Abazajian et al. abaza03 (2003, 2004); the 2dF Survey, Croom et al. croom (2004)), the problem of missing optical identifications (morphological type, redshift) will be partly eliminated within the next couple of years. We can match the sky coverage of optical and VLBI surveys by selecting sources for VLBI observations from celestial areas covered by the optical surveys.
It is hard to predict in detail what kind of scientific insight will become possible with such a dramatic increase in the number of VLBI-imaged sources. One can briefly mention a few possible applications:
-
•
The cosmological evolution of radio-loud active galaxy population could be studied with the data base in the light of orientation-dependent unification models of powerful radio sources (cf. Wall & Jackson wall (1997)). Note that we do not introduce initial sample selection criteria based on source spectral index (see Sect. 2).
-
•
Morphological classification of low-luminosity sources could be compared with that of their high-luminosity counterparts, in view of possible evolutionary effects.
-
•
The arcsecond-scale and high-resolution radio morphology of the sources could be investigated to look for signatures of restarted activity in AGNs (e.g. Marecki marecki (2004)).
-
•
Sub-samples of less powerful radio sources, e.g. Compact Steep Spectrum (CSS) objects could be selected and studied to determine their morphological, physical and evolutionary properties compared to the well-studied powerful objects (e.g. Kunert et al. kunert (2002)).
-
•
The data base would be useful to study gravitational lensing since the survey of weak compact radio sources probes the parent population of lensed objects being found in e.g. the Cosmic Lens All-Sky Survey (CLASS) of weak flat-spectrum sources (e.g. Myers et al. myers (2003)).
-
•
Several thousand mas-scale images of optically identified extragalactic sources with known redshifts are needed to bring about conclusive estimates of fundamental cosmological parameters, such as the density parameters and (Gurvits gurvits03 (2003) and references therein; Jackson jackson (2004)). As shown by Gurvits (gurvits94 (1994)), such a cosmological test could be conducted with a very limited VLBI -coverage using visibility data, and does not require high dynamic range imaging.
-
•
Getting VLBI images of extragalactic sources will be an essential supplement to and basis for future development of the astrometric VLBI data bases (e.g. Johnston et al. johnston (1995), Ma et al. ma (1998)). The sensitive next-generation space-borne optical astrometry missions (e.g. Gaia, Perryman et al. perryman (2001)) would provide a possibility to directly link the radio and optical reference frames using a large number of AGNs observed also with VLBI.
-
•
Some of the sources detected can serve as in-beam phase-reference calibrators for future VLBI observations (Garrett et al. 2005a ). These observations need accurate positions of the sources which can be provided by the DEVOS programme.
In this paper we present Multi-Element Radio Linked Interferomerer Network (MERLIN) and global VLBI imaging results at 5 GHz of a sample of 47 radio sources initially selected from the Faint Images of the Radio Sky at Twenty-centimeters (FIRST) survey (White et al. white (1997)). By means of this pilot study we assess the feasibility of this approach to eventually image thousands of faint radio sources at mas resolution.
The target selection and the observations are described in Sect. 2. The data reduction procedures are presented in Sect. 3. The results are shown and discussed in Sect. 4. A summary and discussion of future observations are given in Sect. 5. The MERLIN and VLBI images with the image parameters are presented in the online version of this paper only.
2 Sample selection and observations
The aim of DEVOS programme is to obtain high-resolution radio images of compact radio sources considerably weaker than currently available in other large-scale imaging VLBI surveys. The technique of phase-referencing (e.g. Lestrade et al. lestrade (1990); Beasley & Conway beasley (1995)) is employed in order to extend the coherence time by using regularly interleaving observations of a nearby bright and compact calibrator source. Phase-referencing can be applied for surveying a number of faint objects in the vicinity of an adequately chosen reference source. In this case we reverse the usual logic of first selecting the target object and then looking for a suitable reference source. If a calibrator is selected first, and the potential targets populate its close vicinity densely enough, then a single calibrator can serve as phase-reference source for all of the targets. The different target sources are observed between the regular intervals spent on the reference source. Each target source is observed several times during the experiment which improves the -coverage and hence the image quality. The method we applied for our observations was introduced and demonstrated first by Garrett et al. (garrett98 (1998)) and Garrington et al. (gg99 (1999)). Wrobel et al. (wrobel (2005)) also used this method for investigating parsec-scale radio properties of about 200 faint FIRST sources. Potential calibrator sources are relatively common and well distributed (e.g. Beasley et al. beasley02 (2002)), therefore practically the whole sky north of declination can be surveyed using this method.
Another aim of our survey is to ensure that many of the sources will have optical identifications and redshifts. In particular, this can be achieved if the sources are selected from the fields that are being surveyed in the SDSS. According to recent studies (Ivezić et al. ivezic (2002)), optical counterparts of at least of all FIRST radio sources are expected to be identified by SDSS. The SDSS-FIRST catalogue is expected to contain spectra for 15 000 quasars.
The source sample for the DEVOS pilot observations described here was defined in 2000, preceding any of the SDSS data releases. The bright flat-spectrum radio-loud AGN J1257+3229 was selected as calibrator, keeping the potential survey areas of SDSS in mind. Optical imaging data of the celestial area surrounding the calibrator J1257+3229 have recently become available in the latest SDSS Data Release111SDSS Data Release 4 (DR4) – http://www.sdss.org/dr4/. The phase-reference calibrator with a total flux density of 530 mJy at 5 GHz is close to the North Galactic Pole (NGP). The object is also known as an X-ray source identified in the ROSAT All-Sky Survey (Brinkmann et al. brinkmann (1997)). Its equatorial coordinates in the International Celestial Reference Frame (ICRF) are given in the VLBA Calibrator Survey222http://magnolia.nrao.edu/vlba_calib/ (Beasley et al. beasley02 (2002)): right ascension , declination . The accuracy is 0.5 mas in both and .
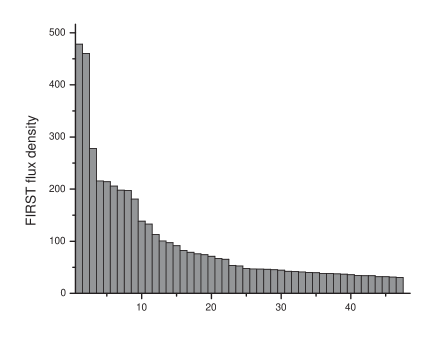
Due to the limited observing resources, we selected sources that are bright and compact enough that they might be detectable with VLBI at high angular resolution, within a reasonable integration time. Note that no criterion was set based on the spectra: radio sources with either steep or flat spectra could be selected as well. The extragalactic radio sources for the DEVOS pilot project described here were chosen from the FIRST survey data base obtained with the US National Radio Astronomy Observatory (NRAO) Very Large Array (VLA) at the frequency of 1.4 GHz (White et al. white (1997)), according to the following selection criteria:
-
1.
the integrated flux density at 1.4 GHz is mJy,
-
2.
the angular size of the source is (i.e. unresolved with the VLA in the FIRST),
-
3.
the angular separation of the target source from the phase-reference calibrator source selected is less than .
47 sources match the first two criteria from the 1042 FIRST sources found within the search radius. The sources potentially suitable for subsequent VLBI imaging were chosen based on 5-GHz MERLIN detections of the sample at an angular resolution of mas. The sources detected with MERLIN were then observed with VLBI. This subsample was imaged at 5 GHz with a global VLBI network at mas resolution.
| Source name | Equatorial coordinates (J2000) | FIRST | GB6 | MERLIN 5 GHz | VLBI 5 GHz | Optical ID | |||
| R.A. | Dec. | int | int | peak | int | peak | int | ||
| h m s | mJy | mJy | mJy/beam | mJy | mJy/beam | mJy | |||
| J124833.1+323207 | 12 48 33.12774 | 32 32 07.2818 | 41.91 | – | 9.4 # | 18.3 | 5.2 # | 13.6 | |
| J124912.4+324438 | 12 49 12.4943 | 32 44 38.765 | 37.46 | – | 2.0 | 3.3 | 0.8 | ||
| J124954.5+332330 | 12 49 54.5037 | 33 23 30.086 | 460.29 | 377 | 2.2 | 1.8 | 0.8 | ||
| J125106.9+320906 | 12 51 06.9619 | 32 09 06.392 | 197.27 | 59 | 5.4 & | 23.7 | 0.6 | A | |
| J125214.1+333109 | 12 52 14.18760 | 33 31 09.7061 | 122.64 | 53 | 10.1 & | 19.7 | 1.4 | ||
| J125221.2+313029 | 12 52 21.2646 | 31 30 29.583 | 31.22 | – | 2.7 | 3.4 | 0.8 | ||
| J125240.2+331058 | 12 52 40.28575 | 33 10 58.1931 | 214.18 | 167 | 129.1 # | 132.1 | 74.9 # | 154.0 | AS |
| J125252.8+314419 | 12 52 52.8420 | 31 44 19.502 | 46.19 | – | 3.7 | 5.4 | 0.7 | ||
| J125354.0+311556 | 12 53 54.0410 | 31 15 56.703 | 78.55 | – | 2.3 | 2.0 | 0.7 | AS | |
| J125410.8+330912 | 12 54 10.83148 | 33 09 12.0372 | 35.69 | – | 7.7 | 14.6 | 1.8 | S | |
| J125452.4+311819 | 12 54 52.47075 | 31 18 19.8254 | 97.08 | – | 10.2 # | 15.2 | 2.2 # | 9.9 | |
| J125546.2+304611 | 12 55 46.2141 | 30 46 11.461 | 197.96 | 2.7 | 3.0 | 0.6 | |||
| J125620.6+304525 | 12 56 20.6524 | 30 45 25.514 | 32.03 | 20 | 2.9 | 6.9 | 0.9 | ||
| J125658.4+325053 | 12 56 58.45917 | 32 50 53.9630 | 205.86 | 54 | 5.6 | 17.8 | 0.9 | S | |
| J125728.6+342428 | 12 57 28.6610 | 34 24 28.998 | 66.91 | – | 4.5 | 9.4 | 1.4 | S | |
| J125734.2+335801 | 12 57 34.21675 | 33 58 02.0043 | 71.14 | 2.6 | 11.1 | 0.6 | |||
| J125734.8+335812 | 12 57 34.8440 | 33 58 12.965 | 40.08 | 2.7 | 1.9 | 0.6 | |||
| J125755.7+313915 | 12 57 55.72881 | 31 39 15.3298 | 32.10 | – | 11.6 # | 11.7 | 9.0 # | 12.0 | S |
| J125842.2+341109 | 12 58 42.20288 | 34 11 09.5319 | 38.12 | – | 4.1 # | 4.2 | 0.79 # | 2.9 | |
| J125858.6+325738 | 12 58 58.60329 | 32 57 38.1592 | 91.48 | 34 | 46.0 # | 47.1 | 17.8 # | 48.7 | AS |
| J125900.0+330617 | 12 59 00.0167 | 33 06 17.130 | 277.85 | 144 | 11.4 & | 58.7 | 0.8 | ||
| J125954.0+335653 | 12 59 54.01264 | 33 56 53.3788 | 478.02 | 146 | 74.1 @ | 153.3 | 7.9 @ | 85.1 | AS |
| J130056.5+314443 | 13 00 56.5325 | 31 44 43.726 | 82.34 | 31 | 6.6 | 14.0 | 1.1 | S | |
| J130114.5+313254 | 13 01 14.51914 | 31 32 54.6472 | 46.77 | 21 | 7.8 # | 10.0 | 6.6 # | 7.2 | A |
| J130121.4+340030 | 13 01 21.42787 | 34 00 30.2497 | 36.94 | 27 | 30.1 # | 31.1 | 16.2 # | 29.9 | AS |
| J130129.1+333700 | 13 01 29.15475 | 33 37 00.3839 | 75.89 | 52 | 62.1 # | 62.8 | 123.2 # | 127.0 | AS |
| J130137.5+323423 | 13 01 37.58463 | 32 34 23.6414 | 47.50 | 21 | 10.9 # | 12.8 | 3.4 # | 13.1 | S |
| J130150.4+313742 | 13 01 50.44960 | 31 37 42.9140 | 215.65 | 60 | 12.1 & | 37.2 | 1.1 | ||
| J130200.7+340232 | 13 02 00.7554 | 34 02 32.164 | 65.45 | 28 | 3.0 | 8.9 | 0.6 | ||
| J130230.8+305109 | 13 02 30.8975 | 30 51 09.299 | 45.37 | – | 2.8 | 6.5 | 0.8 | ||
| J130310.2+333406 | 13 03 10.27119 | 33 34 06.7751 | 100.45 | 44 | 5.8 # | 8.4 | 4.5 # | 4.8 | AS |
| J130311.8+320739 | 13 03 11.87280 | 32 07 39.3167 | 30.35 | 32 | 13.2 # | 14.4 | 12.0 # | 16.0 | AS |
| J130411.2+310222 | 13 04 11.2967 | 31 02 22.631 | 34.26 | – | 2.1 | 4.3 | 0.7 | ||
| J130424.9+334924 | 13 04 24.9873 | 33 49 24.297 | 132.98 | 55 | 6.7 & | 33.1 | 1.0 | ||
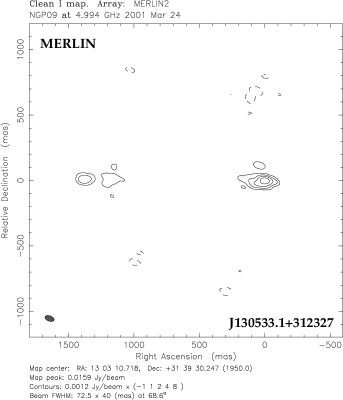
| J130533.1+312327 | 13 05 33.11925 | 31 23 27.3718 | 180.09 | 67 | 15.9 & | 35.9 | 1.5 | ||
| J130620.5+324522 | 13 06 20.5690 | 32 45 22.088 | 52.55 | 20 | 4.3 & | 15.2 | 1.2 | AS | |
| J130650.3+315054 | 13 06 50.3492 | 31 50 54.812 | 40.96 | – | 4.7 | 8.4 | 1.1 | S | |
Notes: Col. 1 – source name, derived from the best available radio coordinates; Col. 2 – J2000 right ascension (h m s); Col. 3 – J2000 declination ( ) (the accuracy of the improved coordinates for the MERLIN-only and VLBI detections is different; see the text for the details); Col. 4 – FIRST integrated flux density at 1.4 GHz (mJy); Col. 5 – GB6 total flux density at 5 GHz (mJy) (Gregory et al. gb6 (1996)), a,b mark double sources unresolved in GB6 (see also Table 2); Col. 6 – MERLIN peak brightness at 5 GHz (mJy/beam); the MERLIN image is displayed in Fig. 3 (#), Fig. 4 (@) or Fig. 5 (&); Col. 7 – MERLIN integrated flux density at 5 GHz (mJy); Col. 8 – VLBI peak brightness at 5 GHz (mJy/beam), an upper limit is given for VLBI non-detections; the VLBI image is displayed in Fig. 3 (#) or Fig. 4 (@); Col. 9 – VLBI integrated flux density at 5 GHz (mJy), marginal VLBI detections are indicated with a “” sign. Col. 10 – optical identifications of the sources: SDSS DR4 (S) and APM (A), McMahon et al. (mcmahon (2002)).
2.1 MERLIN filter observations and data reduction
After selecting the reference source and the targets, we imaged the sample at an intermediate angular resolution with MERLIN. The primary goal of the MERLIN observations was to optimise the subsequent VLBI observations: to identify the objects that may be suitable for the highest angular resolution ( mas) imaging, and to improve the astrometric source positions. The NGP field was observed with MERLIN at 5 GHz with 14 MHz bandwidth in dual circular polarisation on 24–28 March 2001. The total observing time was 29.8 hours. Each target source was observed 6 times in 4.5-min scans between 2-min intervals spent on the phase-reference calibrator, including antenna slewing. The resulting image angular resolution was mas. The data were calibrated with the NRAO AIPS package (e.g. Diamond aips (1995)) and imaged with AIPS and the Caltech Difmap package (Shepherd et al. difmap (1994)). A large () field of view was investigated in each case to look for distant source components. In the NGP field, 37 out of the total 47 sources have been detected with MERLIN and proposed later for VLBI observations (Table 1). For all of these objects, the MERLIN image peak brightness exceeded mJy/beam (). The ten sources from the originally defined NGP sample that were not detected with MERLIN are listed in Table 2, along with their FIRST integrated flux density at 1.4 GHz and the upper limit of their MERLIN peak brightness at 5 GHz. These sources appeared completely resolved at mas angular scale.
2.2 VLBI observations
The 5-GHz global VLBI observations of the MERLIN-filtered NGP sample involving 19 antennas of the European VLBI Network (EVN) and the NRAO Very Long Baseline Array (VLBA) took place on 30 May 2002. The total observing time was 21 hours, with 7 hours overlap between the two arrays. The participating radio telescopes were Effelsberg (Germany), Westerbork (The Netherlands), Jodrell Bank Mk2 (UK), Medicina, Noto (Italy), Toruń (Poland), Onsala (Sweden), Sheshan, Nanshan (China) from the EVN, and all the ten stations of the VLBA. The data were recorded with a data rate of 256 Mbit s-1, in four 8 MHz wide intermediate frequency channels (IFs) in both left and right circular polarisation at all antennas except Sheshan where only left circular polarisation was available. The total bandwidth was 32 MHz in both polarisations.
Each programme source was observed in 10 scans of 2.5 min duration. Taking the slewing times of the antennas into account, it corresponds to 20 min accumulated observing time per source. The estimated image thermal noise () was Jy/beam.
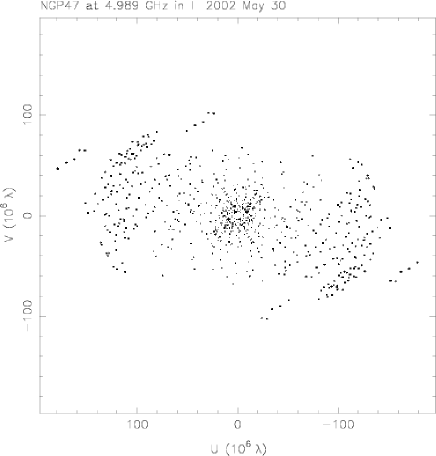
In each 6-min observing cycle, two programme sources were observed, chosen with the minimum angular distance between them. The reference source was observed for 1 min per cycle. An example of a ()-coverage for a program source is shown in Fig. 1. The typical restoring beam using natural weighting is mas 3 mas in a position angle (PA) of .
| Source name | FIRST flux | GB6 flux | MERLIN peak | Opt. ID |
|---|---|---|---|---|
| density (mJy) | density (mJy) | (mJy/beam) | ||
| J125102+315634 | 44.35 | 33 | 1.9 | A |
| J125543+324115 | 33.99 | 34 | 2.0 | |
| J125546+304605 | 138.37 | 2.2 | ||
| J125746+305952 | 38.04 | 20 | 2.3 | A |
| J125821+313130 | 46.53 | – | 1.7 | |
| J125938+313047 | 53.70 | 24 | 1.7 | |
| J130203+320635 | 74.02 | – | 1.9 | |
| J130334+305817 | 33.99 | – | 1.7 | |
| J130557+333016 | 39.58 | 1.6 | A | |
| J130557+333030 | 42.35 | 1.8 |
Notes: Col. 1 – source name; Col. 2 – FIRST integrated flux density at 1.4 GHz (mJy); Col. 3 – GB6 total flux density at 5 GHz (mJy) (Gregory et al. gb6 (1996)), a,c mark double sources unresolved in GB6 (see also Table 1); Col. 4 – upper limit of MERLIN peak brightness at 5 GHz (mJy/beam) corresponding to image noise. Col. 5 – optical identifications of the sources: APM (A), McMahon et al. (mcmahon (2002)).
| Source name | SDSS name | separation () | magnitude | morphology | VLBI-detected |
|---|---|---|---|---|---|
| J125240.2+331058 | SDSS J125240.29+331058.1 | 0.12 | 19.28 | G | |
| J125354.0+311556 | SDSS J125354.05+311558.9 | 0.28 | 21.37 | G | |
| J125410.8+330912 | SDSS J125410.83+330912 | 0.07 | 22.40 | G | |
| J125658.4+325053 | SDSS J125658.42+325053.2 | 0.86 | 21.40 | Q | |
| J125728.6+342428 | SDSS J125728.64+342429.1 | 0.20 | 22.53 | G | |
| J125755.7+313915 | SDSS J125755.77+313915.2 | 0.59 | 23.10 | G | |
| J125858.6+325738 | SDSS J125858.6+325738.2 | 0.09 | 19.41 | Q | |
| J125954.0+335653 | SDSS J125954.01+335653.3 | 0.07 | 20.74 | G | |
| J130056.5+314443 | SDSS J130056.49+314442.7 | 1.08 | 22.54 | G | |
| J130121.4+340030 | SDSS J130121.42+340030.1 | 0.06 | 19.32 | Q | |
| J130129.1+333700 | SDSS J130129.15+333700.3 | 0.03 | 19.68 | Q | |
| J130137.5+323423 | SDSS J130137.6+323423.2 | 0.43 | 23.20 | G | |
| J130310.2+333406 | SDSS J130310.26+333406.7 | 0.03 | 19.96 | Q | |
| J130311.8+320739 | SDSS J130311.87+320739.3 | 0.05 | 20.41 | Q | |
| J130620.5+324522 | SDSS J130620.56+324522 | 0.06 | 18.66 | G | |
| J130650.3+315054 | SDSS J130650.33+315054.4 | 0.42 | 22.35 | G |
Notes: Col. 1 – source name; Col. 2 – SDSS source name; Col. 3 – angular distance between the best available radio and the SDSS optical positions (); Col. 4 – SDSS magnitude; Col. 5 – optical morphology: extended (galaxy, G) or point-like (quasi-stellar object, Q); Col. 6 – VLBI-detected sources ().
3 VLBI data processing and imaging
The correlation took place at the EVN MkIV Data Processor at the Joint Institute for VLBI in Europe (JIVE) in Dwingeloo (The Netherlands). The NRAO AIPS package was used for the initial data calibration. The reference source J1257+3229 was imaged first (Fig. 2). The residual amplitude and phase corrections resulted from the hybrid mapping of J1257+3229 were applied to the target sources. No amplitude self-calibration was attempted after this point except in the cases of the two brightest target sources (J125240.2+331058 and J130129.1+333700). The original field of view of VLBI images limited by time-smearing was .

Initially, all programme sources were imaged and investigated individually. Difmap and AIPS packages were used for imaging. For the sources brighter than mJy/beam, phase self-calibration was performed. For the rest of the sources, the images are the results of a CLEANing process only. For phase self-calibration, we used a simple initial brightness distribution model, the CLEAN model of the phase-reference image for each source, with a 3-min solution interval. The information on the target source positions relative to the reference source is preserved this way. We carried out tests on the reliability of the imaging by means of comparing the results obtained with both packages. In Difmap, we do not have full control over the self-calibration process in a sense that one cannot set a signal-to-noise ratio (SNR) threshold for the solutions to be accepted or dismissed. In AIPS, we were able to set SNR and apply phase self-calibration only if most of the solutions were good. Our experience showed that the images made using both packages this way were equivalent.
With the ultimate aim of observing and imaging thousands of radio sources in the full DEVOS, an automated (fast and objective) procedure to prepare the VLBI images is needed. Relatively simple scripts have been written and tested for this purpose using Difmap. We then compared the images prepared “manually” and reproduced in this paper with those obtained by the automated procedure. It turned out that the same sources were detected, with qualitatively identical mas-scale structures. The peak brightness and image noise values were also consistent. The differences in peak brightnesses were typically less than %.
4 Results and discussion
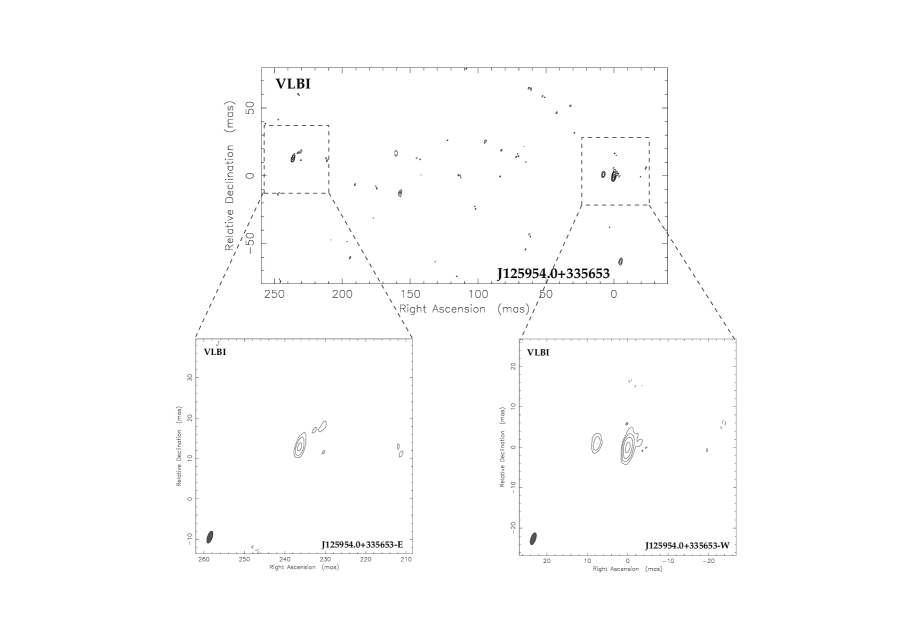
The sample of 37 MERLIN-detected sources observed with VLBI is given in Table 1. Among them, a total of 19 sources were detected and imaged with VLBI. Natural weighting of the visibility data was used to maximise the sensitivity. The MERLIN and VLBI images of 12 sources are shown in Fig. 3. The images of the complex structure of one more source, J125954.0+335653 are shown in Fig. 4. The detailed image parameters are given in Table 4. Additionally, there were 6 marginal VLBI detections located at the MERLIN position within the MERLIN source structure. These cases are indicated with “” in Col. 9 of Table 1. For these sources, only the dirty images were investigated but not reproduced in this paper since they all show simple featureless low-brightness structure. For the rest of the VLBI-observed sources, the upper limits of the peak brightness corresponding to the image noise are shown in Table 1.
The majority (17 out of 24) of the sources not detected or marginally detected with VLBI appeared compact and unresolved with MERLIN. The images of these sources are not shown here but the MERLIN peak brightness values are reported in Table 1. However, 7 of the 24 sources exhibit significantly resolved structure at the MERLIN angular scales (Fig. 5).
In Tables 1 and 2, we also list the 5-GHz total flux densities taken from the GB6 catalogue (Gregory et al. gb6 (1996)). The radio spectral properties of the sources can be inferred from comparing these data with the FIRST flux densities. However, a large fraction of the sources in our sample is not found in GB6: their 5-GHz total flux densities are lower than the 18-mJy detection threshold there. Since our survey is more sensitive, five of these objects have been detected even with VLBI, with integrated flux densities up to 13.6 mJy. The GB6 data would have limited potential in constraining our initial sample.
We looked for close companions of our sources selected as unresolved in FIRST. It turned out that many of the objects that we resolved, 8 among the 10 sources not detected with MERLIN (Table 2), have a companion within in the FIRST catalogue. These pairs of sources are most likely physically associated, although chance coincidences in about half of the cases are also possible at around angular separation (cf. McMahon et al. mcmahon (2002)). There are 14 such “double” sources in the DEVOS NGP sample, and only one of them was – marginally – detected with VLBI (J125734.2+335801). However, a compact source in a FIRST “triple” (J125240.2+331058) is a strong VLBI detection. We shall investigate whether the initial sample selection could be usefully constrained by excluding the components of “double” FIRST sources in the future.
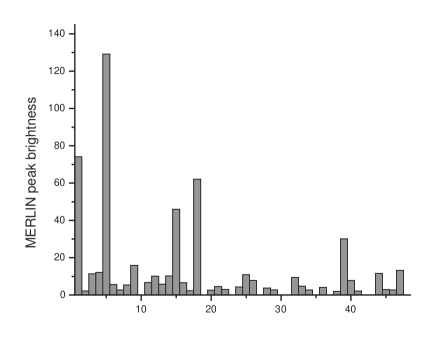
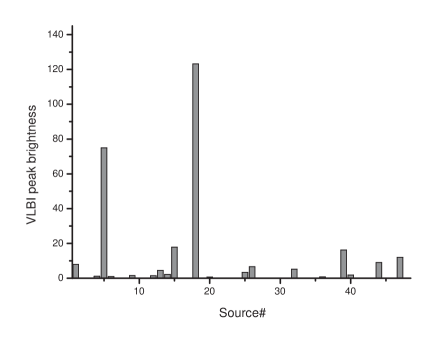
The distribution of MERLIN and VLBI peak brightnesses are shown in Fig. 6. Based on their peak brightness, the 19 sources detected with VLBI can be grouped as follows:
-
•
2 bright objects (75 and 123 mJy/beam)
-
•
3 objects with mJy/beam
-
•
8 objects with mJy/beam
-
•
6 objects marginally detected with mJy/beam peak brightness (, with possibly extended structures resolved with VLBI) and co-located within the MERLIN source structure.
In certain cases the image noise achieved is higher than the thermal noise expected (see Col. 4 of Table 4). The dynamic range may be limited by residual phase-referencing errors introduced by the switching technique. Direct fringe-fitting was attempted for four target sources brighter than mJy/beam in order to estimate the coherence loss in the phase-referencing process by comparing the images obtained in both ways. The differences of peak brightnesses ranged from 5 to 25%. Therefore the threshold for the VLBI non-detections was multiplied by a factor of 1.25 in Col. 8 of Table 1 to account for this effect.
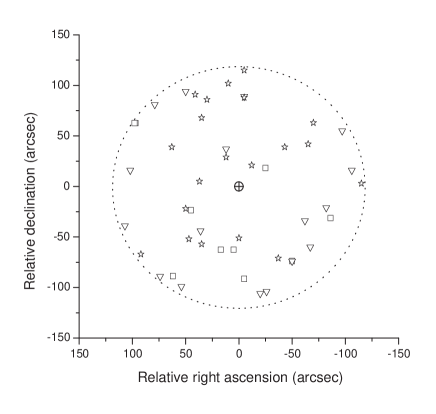
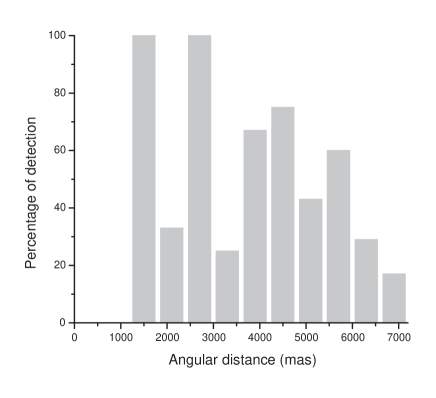
We note that we were able to image the faintest source (J130311.8+320739) in our initial FIRST sample. The object shows a compact radio structure with 10-mJy level flux density at 5 GHz. The detections are apparently not affected by the angular distance of the target sources from the phase-reference calibrator (Fig. 7 and 8). For example, the object J124833.1+323207 is located at the very edge of the -radius circle around the reference source. It was detected with a peak brightness of 5.2 mJy/beam. The VLBI detection rate is not significantly different for small and large target–reference separations (Fig. 8). We also note that for 2 VLBI-detected sources (J125755.7+313915 and J130114.5+313254) the deconvolved FIRST angular sizes are (4.91 and 4.85, respectively).
The improved VLBI coordinates of the brightness peak locations for the sources detected with MERLIN and VLBI are given in Table 1. The source names are derived from these coordinates according to the IAU convention. The formal positional accuracy is proportional to the angular resolution of the array and scales inversely with the signal-to-noise ratio, i.e. the source strength (e.g. Lestrade et al. lestrade (1990)). For the MERLIN-only detections, the accuracy estimated is 9 mas (, for the weakest sources) or better in both and . For sources clearly detected with VLBI (those with integrated VLBI flux densities cited in Col. 9 of Table 1), the coordinates relative to those of the phase-reference calibrator source are accurate to 0.2 mas in and 0.4 mas in . These are conservative estimates calculated for weak sources and assuming relatively large target–reference source separations. The relative astrometric position errors of the target sources in phase-referencing observations are known to depend on their angular separation from the calibrator. Chatterjee et al. (chatterjee (2004)) give an estimate of this effect by comparing measured and modelled pulsar positions. Their results indicate that the astrometric errors are within 0.5 mas at 5 GHz frequency even at separation, the limit we used in our experiment. Our estimates are consistent with the results of Chatterjee et al. (chatterjee (2004)). Taking the accuracy of the phase-reference calibrator coordinates into account, the absolute ICRF positions of the VLBI-detected DEVOS sources are accurate to at least 0.6 mas and 0.7 mas in and , respectively. For marginal VLBI detections, these absolute accuracies are mas.
Although the number of observed and detected sources in our pilot experiment is rather small, it is still possible to get an idea for the VLBI detection rate of FIRST-based source samples selected using similar critera to those employed here. Taking the results of Garrington et al. (gg99 (1999)) and Wrobel et al. (wrobel (2005)) into account as well, a VLBI detection rate of up to 40% is expected.
Most recently, Porcas et al. (porcas (2004)) conducted a survey of FIRST radio sources at 1.4 GHz with a single highly sensitive VLBI baseline between Arecibo and Effelsberg. They found that about one third of all sources had detectable compact structure at the mJy level. This ratio holds for the weakest ( mJy) sources as well, and is essentially independent from the source total flux density.
A deep wide-field VLBI survey was conducted by Garrett et al. (2005a ) at 1.4 GHz with the VLBA and the 100-m Green Bank Telescope. Sixty-one mJy and sub-mJy-level radio sources previously imaged with the Westerbork Synthesis Radio Telescope (WSRT) at arcsecond scales were observed simultaneously. A total of 9 sources were detected with VLBI, with image noise ranging from 9 to 55 Jy/beam. The detection rate is 29% for the mJy WSRT sources, giving a lower limit for the fraction of the objects that are powered by accretion process onto massive black holes. This detection rate is consistent with our result.
4.1 Notes on individual sources
The VLBI images of the sample sources reveal a large variety of radio morphologies, ranging from those typical for compact AGNs through “classical” core–jet structures to highly resolved sources. Cross-identification of the DEVOS pilot sample objects using imaging data from the SDSS revealed optical counterparts of 16 sources of the total 47 (34%). Details are given in Tables 1 and 3. All of the optically identified radio sources were detected with MERLIN and 11 also with VLBI (including 2 marginal detections). All the 6 sources that appear point-like in the SDSS images were detected with VLBI and thus are among the most compact objects in the radio as well. These quasi-stellar objects would be classified by spectroscopic data conclusively. Eight optical counterparts within of our 19 VLBI-detected sources were found in the catalogue of Automatic Plate Measuring (APM) identifications using the Palomar Observatory Sky Survey (POSS) first-epoch red and/or blue plates (McMahon et al. mcmahon (2002), see Col. 10 of Table 1). Moreover, 3 out of our 18 MERLIN-only detections (also Col. 10 of Table 1) and 3 out of 10 MERLIN non-detections also have APM counterparts (Col. 5 of Table 2). Here we briefly comment on sources that have interesting observational properties or additional information available from the literature.
J125240.2+331058 The FIRST image shows a three-component radio structure. We were able to image with VLBI the central compact object that lies between two diffuse low-brightness lobes apart from each other.
J125858.6+325738 Based on the structural pattern, this source might be a compact symmetric object (CSO, cf. Taylor et al. taylor (2000)).
J125954.0+335653 This galaxy is the strongest source at 1.4 GHz in the DEVOS NGP sample. A redshift of was measured by Allington-Smith et al. (allington (1985)). It was resolved by MERLIN into a double-lobe radio structure. We could detect both components separated by mas with VLBI, although heavily resolved (Fig. 4). This corresponds to a projected linear extent of kpc, assuming a flat cosmological model with , and km s-1 Mpc-1. Based on the steep spectrum (radio spectral index ) and the small size, the object can be identified as a CSS source. Its 5-GHz rest-frame radio luminosity is W Hz-1.
J130121.4+340030 The VLBI image of this quasar (also known as 5C 12.165) at a redshift of (Barkhouse & Hall barkhouse (2001)) shows a typical one-sided core–jet structure.
J130129.1+333700 The integrated 5-GHz flux density of this source measured in our MERLIN experiment was 62.8 mJy in March 2001. About a year later (in May 2002), a flux density of 127.0 mJy was determined with VLBI. This indicates significant flux density variability, consistent with the compact radio structure. Note that – according to what is expected in the absence of variability – none of the other sources showed VLBI peak brightness higher than the MERLIN value (Fig. 6).
5 Summary and future outlook
The primary goal of the DEVOS pilot project was to verify and adjust sample selection criteria, observing strategies and data reduction procedures before the full survey has started. Here we presented MERLIN and global VLBI observations of a sample of 47 radio sources selected from the FIRST survey with mJy and , within separation from the phase-reference calibrator source J1257+3229. We detected 37 sources at 5 GHz with MERLIN observations at a peak brightness of at least mJy/beam, filtering out extended radio structures not detected with MERLIN. Subsequent 5-GHz observations with the global VLBI network revealed that 19 of the sources are stronger than mJy at an angular resolution of mas. The MERLIN images of 20 and VLBI images of 13 sources are presented. We were able to identify 34% of the pilot source sample with SDSS-detected sources. All of these sources were detected with MERLIN and 11 with VLBI. All sources with unresolved optical structure were detected with VLBI.
With the typically mJy/beam () VLBI image noise achieved, we could determine the mas-scale brightness distribution of sources with rest-frame brightness temperatures of at least K. Hence the objects detected are likely to be powered by AGN rather than starburst activity (e.g. Condon condon (1992)). In DEVOS, we are probing the same AGN population, but one or two orders of magnitude fainter than traditionally surveyed with imaging VLBI. The results of this pilot study can already be valuable in their own right since there are a couple of individual sources that may be worth studying further (e.g. J125858.6+325738 and J130129.1+333700).
With the current observational setup in VLBI, the total time spent on the sources (20 min) is sufficient to detect and image the compact objects with a peak brightness of at least 1 mJy/beam. The phase-referencing technique in the “nodding style” was successful: the 6-min long observing cycles involving scans on two different target sources between the calibrator scans proved adequate at 5 GHz.
Tools are available for efficient data reduction in a highly automated way for the full survey. In this pilot project, we used relatively simple Difmap scripts which were tested with our MERLIN and VLBI data. The results were carefully compared with manually prepared AIPS and Difmap images. We also aim at developing an AIPS pipeline procedure for calibration and data reduction in the future such as e.g. the EVN pipeline (Reynolds et al. reynolds (2002)).
Potential phase-reference calibrator sources are well distributed in the sky, thus practically any celestial area north of declination can be covered in DEVOS. Emphasis should be made on the areas subject to deep optical surveys in order to supplement the data base with optical identifications and redshift data. Due to the nature of the phase-referencing observations, high-quality images of the calibrator sources are obtained, which could be considered as valuable by-products on otherwise scientifically interesting bright radio-loud AGNs.
We found that the sources that appear associated with a nearby object in the FIRST catalogue have a relatively low chance for being detected at sub-arcsecond angular scales. In our MERLIN observations, there were 11 objects with 5-GHz peak brightness between 2 and 4 mJy/beam. Only one of them was marginally detected later with VLBI (J125734.2+335801). Therefore if a higher threshold of 4 mJy/beam is set as a criterion for inclusion in the sub-sample observed with VLBI with this setup, 18 of the 26 objects would have been detected, giving a considerably higher success rate. Since the DEVOS is a very demanding project in terms of network resources, the high detection rate is of special importance.
If more stringent filtering criteria are applied, the number of sources in a field around a given phase-reference calibrator could possibly be increased by allowing somewhat larger (e.g. ) maximum target–reference angular separation. This would allow us to image about the same number of sources per VLBI experiment. Another possibility to enlarge the initial FIRST sample is to set a lower limit on the integrated 1.4-GHz flux density, e.g. 20 mJy.
With a detection rate of %, VLBI imaging of 10 000 objects implies 25 000 sources in the parent FIRST-based sample to be observed with MERLIN. The full SDSS-FIRST spectroscopic quasar sample will contain objects (Ivezić et al. ivezic (2002)). Our experience shows that a significant fraction of these is expected to have compact radio structure and could be detected with VLBI. With the technical capabilities available for the pilot experiment presented here, such a full survey would require approximately 600 days of MERLIN and 450 days of VLBI time. The latter could be decreased to 300 days if the more stringent value of 4 mJy/beam is used for the limiting MERLIN peak brigthness.
However, the e-MERLIN development (Garrington et al. garrington04 (2004)) planned to be completed by 2007 will lead to a substantial (a factor of 35) increase in the sensitivity at 5 GHz, significantly reducing the observing time required for DEVOS. With real-time eVLBI now in an experimental phase at the EVN (Szomoru et al. szomoru (2004)), it may also be possible in the near future to perform preliminary source filtering observations using data taken on the shortest EVN baselines in real time, thus further decreasing the demand on VLBI resources.
With the perspective of further developments in the VLBI technique (disk-based recording, eVLBI, e.g. van Langevelde et al. langevelde (2004) and references therein; Garrett garrett05 (2005)), a survey like DEVOS would require much less telescope resources than at present. Conservatively assuming 1 Gbit s-1 data recording rate – most likely an underestimate by a factor of a few at the EVN in ten years time –, phase-referenced imaging of sources providing the same image noise as in this pilot study would take about 75 days total observing time.
The next logical phase of programmes like DEVOS is to employ the wide-field technique to survey the Jy radio source population at mas angular resolution. Deep wide-field VLBI observations have already been conducted reaching the rms image noise of 9 Jy/beam (Garrett et al. 2005a ). Even though observations of this kind are currently very demanding in terms of correlator capacity and data analysis resources, they open up the perspective of studying the faint active galaxy population at the earliest cosmological epochs and help understanding their formation and evolution. DEVOS can provide calibrator sources for these observations with accurate positions necessary to anchor the surveyed fields to the ICRF.
With the advent of the Square Kilometre Array (SKA), and using this sensitive instrument in a high-resolution configuration as part of a VLBI network, a much deeper DEVOS-like survey would become technically feasible (Gurvits gurvits04 (2004)).
After completing this pilot study, we intend to initiate further VLBI and target-finding filter observations in the framework of DEVOS. We already observed 42 FIRST-based sources with MERLIN at 5 GHz in a field close to the celestial equator around the phase-reference calibrator quasar J1549+0237 (Mosoni et al. equ (2002)). A total of 30 sources have been selected for future VLBI observations.
Acknowledgements.
We thank the anonymous referee for suggestions that helped us to improve the paper. LM acknowledges the help of the JIVE Support Group. We thank Anita Richards and Peter Thomasson for their assistance with the MERLIN data reduction. This research was supported by the European Commission’s IHP Programme “Access to Large-Scale Facilities”, under contracts no. HPRI-CT-1999-00045 and HPRI-CT-2001-00142, and the Hungarian Scientific Research Fund (OTKA, grant no. T046097). SF acknowledges the Bolyai Research Scholarship received from the Hungarian Academy of Sciences. MERLIN is a National Facility operated by the University of Manchester at Jodrell Bank Observatory on behalf of PPARC. The European VLBI Network is a joint facility of European, Chinese, South African and other radio astronomy institutes funded by their national research councils. The National Radio Astronomy Observatory (NRAO) is a facility of the NSF operated under cooperative agreement by Associated Universities, Inc. This research has made use of the FIRST survey and SDSS data base, the NASA’s Astrophysics Data System, the NASA/IPAC Extragalactic Database (NED) which is operated by the Jet Propulsion Laboratory, California Institute of Technology, under contract with the National Aeronautics and Space Administration.References
- (1) Abazajian, K., Adelman-McCarthy, J.K., Agüeros, M.A., et al. 2003, AJ, 126, 2081
- (2) Abazajian, K., Adelman-McCarthy, J.K., Agüeros, M.A., et al. 2004, AJ, 128, 502
- (3) Allington-Smith, J.R., Lilly, S.J., & Longair, M.S. 1985, MNRAS, 213, 243
- (4) Barkhouse, W.A., & Hall, P.B. 2001, AJ, 121, 2843
- (5) Beasley, A.J., & Conway, J.E. 1995, in ASP Conf. Ser. 82, Very Long Baseline Interferometry and the VLBA, ed. J.A. Zensus, P.J. Diamond, & P.J. Napier, 327
- (6) Beasley, A.J., Gordon, D., Peck, A.B., et al. 2002, ApJS, 141, 13
- (7) Brinkmann, W., Siebert, J., Feigelson, E.D., et al. 1997, A&A, 323, 739
- (8) Chatterjee, S., Cordes, J.M., Vlemmings, W.H.T., et al. 2004, ApJ, 604, 339
- (9) Condon, J.J. 1992, ARA&A, 30, 575
- (10) Croom, S.M., Smith, R.J., Boyle, B.J., et al. 2004, MNRAS, 349, 1397
- (11) Diamond, P.J. 1995, in ASP Conf. Ser. 82, Very Long Baseline Interferometry and the VLBA, ed. J.A. Zensus, P.J. Diamond, & P.J. Napier, 227
- (12) Garrett, M.A. 2005, in ESO Astrophys. Symp., Exploring the Cosmic Frontier: Astrophysical Instruments for the 21st Century (Berlin: Springer), in press (astro-ph/0409021)
- (13) Garrett, M.A., Garrington, S.T. 1998, ASP Conference Series, Volume 144, IAU Colloquium 164, eds. J.A. Zensus, G.B. Taylor, & J.M. Wrobel, p. 145.
- (14) Garrett, M.A., Wrobel, J.M., & Morganti, R. 2005a, ApJ, 619, 105
- (15) Garrett, M.A., Wrobel, J.M., & Morganti, R. 2005b, in ASP Conf. Ser., Future Directions in High Resolution Astronomy: The 10th Anniversary of the VLBA, ed. J.D. Romney, & M.J. Reid, in press (astro-ph/0403642)
- (16) Garrington, S.T., Garrett, M.A., & Polatidis, A. 1999, New Astron. Rev., 43, 629
- (17) Garrington, S.T., Anderson, B., Baines, C., et al. 2004, Proc. SPIE, Vol. 5489 (Bellingham: International Society for Optical Engineering), 332
- (18) Gregory P.C., Scott W.K., Douglas K., Condon J.J. 1996, ApJS, 103, 427
- (19) Gurvits, L.I. 1994, ApJ, 425, 442
- (20) Gurvits, L.I. 2002, in ASP Conf. Ser. 284, AGN Surveys, ed. R.F. Green, E.Ye. Khachikian, & D.B. Sanders, 265
- (21) Gurvits, L.I. 2003, in ASP Conf. Ser. 300, Radio Astronomy at the Fringe, ed. J.A. Zensus, M.H. Cohen, & E. Ros, 285
- (22) Gurvits, L.I. 2004, New Astron. Rev., 48, 1211
- (23) Ivezić, Ž., Menou, K., Knapp, G.R., et al. 2002, AJ, 124, 2364
- (24) Jackson, J. 2004, J. Cosmol. Astropart. Phys., 11, 007
- (25) Johnston, K.J., Fey, A.L., Zacharias, N., et al. 1995, AJ, 110, 880
- (26) Kunert, M., Marecki, A., Spencer, R.E., Kus, A.J., & Niezgoda, J. 2002, A&A, 391, 47
- (27) Lestrade, J.-F., Rogers, A.E.E., Whitney, A.R., et al. 1990, AJ, 99, 1663
- (28) Ma, C., Arias, E.F., Eubanks, T.M., et al. 1998, AJ, 116, 516
- (29) Marecki, A. 2004, in Proc. 7th EVN Symp., ed. R. Bachiller, F. Colomer, J.F. Desmurs, & P. de Vicente (Alcala de Henares: Observatorio Astronomico Nacional), 117
- (30) McMahon, R.G., White, R.L., Helfand, D.J., & Becker, R.H. 2002, ApJS, 143, 1
- (31) Mosoni, L., Frey, S., Paragi, Z., et al. 2002, in Proc. 6th EVN Symp., ed. E. Ros, R.W. Porcas, A.P. Lobanov, & J.A. Zensus (Bonn: MPIfR), 97
- (32) Myers, S.T., Jackson, N.J., Browne, I.W.A., et al. 2003, MNRAS, 341, 1
- (33) Perryman, M.A.C., de Boer, K.S., Gilmore, G., et al. 2001, A&A, 369, 339
- (34) Porcas, R.W., Alef, W., Ghosh, T., Salter, C.J., & Garrington, S. T. 2004, in Proc. 7th EVN Symp., ed. R. Bachiller, F. Colomer, J.F. Desmurs, & P. de Vicente (Alcala de Henares: Observatorio Astronomico Nacional), 31
- (35) Reynolds, C., Paragi, Z., Garrett, M.A. 2002, URSI General Assembly, astro-ph/0205118
- (36) Scott, W.K., Fomalont, E.B., Horiuchi, S., et al. 2004, ApJS, 155, 33
- (37) Shepherd, M.C., Pearson, T.J., & Taylor, G.B. 1994, BAAS, 26, 987
- (38) Szomoru, A., Biggs, A., Garrett, M., et al. 2004, in Proc. 7th EVN Symp., ed. R. Bachiller, F. Colomer, J.F. Desmurs, & P. de Vicente (Alcala de Henares: Observatorio Astronomico Nacional), 257
- (39) Taylor, G.B., Marr, J.M., Pearson, T.J., & Readhead, A.C.S. 2000, ApJ, 541, 112
- (40) van Langevelde, H.J., Garrett, M.A., Parsley, S., et al. 2004, Proc. SPIE, Vol. 5489 (Bellingham: International Society for Optical Engineering), 324
- (41) Wall, J.V., & Jackson, C.A. 1997, MNRAS, 290, L1
- (42) White, R.L., Becker, R.H., Helfand, D.J., & Gregg, M.D. 1997, ApJ, 475, 479
- (43) Wrobel, J.M., Rector, T.A., Taylor, G.B., Myers, S.T., & Fassnacht, C.D. 2005, AJ, in press (astro-ph/0506193)


| Source name | Observing | Peak brightness | Lowest contour () | Restoring beam | |
|---|---|---|---|---|---|
| array | (mJy/beam) | size (masmas) | PA () | ||
| J124833.1+323207 | MERLIN | 9.4 | 0.98 | ||
| VLBI | 5.2 | 0.61 | |||
| J125240.2+331058 | MERLIN | 129.0 | 0.90 | ||
| VLBI | 74.9 | 0.51 | |||
| J125452.4+311819 | MERLIN | 10.2 | 0.85 | ||
| VLBI | 2.4 | 0.36 | |||
| J125755.7+313915 | MERLIN | 11.6 | 0.82 | ||
| VLBI | 9.0 | 0.50 | |||
| J125842.2+341109 | MERLIN | 4.1 | 0.86 | ||
| VLBI | 0.79 | 0.27 | |||
| J125858.6+325738 | MERLIN | 46.0 | 0.79 | ||
| VLBI | 17.8 | 0.41 | |||
| J125954.0+335653 | MERLIN | 74.1 | 0.91 | ||
| VLBI | 7.9 | 0.78 | |||
| J130114.5+313254 | MERLIN | 7.8 | 0.95 | ||
| VLBI | 6.6 | 0.55 | |||
| J130121.4+340030 | MERLIN | 30.1 | 0.65 | ||
| VLBI | 16.2 | 0.30 | |||
| J130129.1+333700 | MERLIN | 62.1 | 0.84 | ||
| VLBI | 123.2 | 0.51 | |||
| J130137.5+323423 | MERLIN | 10.9 | 1.04 | ||
| VLBI | 3.4 | 0.33 | |||
| J130310.2+333406 | MERLIN | 5.8 | 0.89 | ||
| VLBI | 4.5 | 0.34 | |||
| J130311.8+320739 | MERLIN | 13.2 | 0.82 | ||
| VLBI | 12.0 | 0.70 | |||
Notes: Col. 1 – source name; Col. 2 – interferometer array name; Col. 3 – peak brightness at 5 GHz (mJy/beam); Col. 4 – lowest contour level (mJy/beam) corresponding to image noise; Col. 5 – Gaussian restoring beam size (masmas); Col. 6 – restoring beam major axis position angle () measured from north through east.


| Source name | Peak brightness | Lowest contour () | Restoring beam | |
|---|---|---|---|---|
| (mJy/beam) | size (masmas) | PA () | ||
| J125106.9+320906 | 5.4 | 1.11 | ||
| J125214.1+333109 | 10.1 | 1.14 | ||
| J125900.0+330617 | 11.4 | 1.25 | ||
| J130150.4+313742 | 12.1 | 0.97 | ||
| J130424.9+334924 | 6.7 | 1.44 | ||
| J130533.1+312327 | 15.9 | 1.20 | ||
| J130620.5+324522 | 4.3 | 0.92 | ||
Notes: Col. 1 – source name; Col. 2 – peak brightness at 5 GHz (mJy/beam); Col. 3 – lowest contour level (mJy/beam) corresponding to image noise; Col. 4 – Gaussian restoring beam size (masmas); Col. 5 – restoring beam major axis position angle () measured from north through east.