Spitzer IRAC Imaging of the Relativistic Jet from Superluminal Quasar PKS 0637752
Abstract
Emission from the relativistic jet located at hundreds of kpc from the core of the superluminal quasar PKS 0637752 was detected at 3.6 and with the Infrared Array Camera (IRAC) on the Spitzer Space Telescope. The unprecedented sensitivity and arcsecond resolution of IRAC allows us to explore the mid-infrared emission from kiloparsec-scale quasar jets for the first time. The mid-infrared flux from the jet knots, when combined with radio and optical fluxes, confirms a synchrotron origin of the radio-to-optical emission and constrains very well the high energy end of the nonthermal electron distribution. Assuming the X-rays are produced in the relativistically moving knots via inverse Compton scattering of cosmic microwave background (CMB) radiation, the infrared observation puts constraints on the matter content of the quasar extended jet. Specifically, pure pair jet models are unfavorable based on the lack of an infrared bump associated with “bulk Comptonization” of CMB photons by an ultrarelativistic jet.
Subject headings:
galaxies: jets — infrared: galaxies — quasars: individual(PKS 0637752 (catalog )) — radiation mechanisms: non-thermal1. Introduction
Since the discovery of an X-ray jet of the quasar PKS 0637752 (Chartas et al., 2000; Schwartz et al., 2000), a number of X-ray jets extending to hundreds of kpc distances from the quasar nucleus have been unveiled by Chandra (see e.g., Sambruna et al., 2004; Marshall et al., 2005). The X-ray emission mechanism, however, still remains unsettled for most of the large-scale jets of powerful quasars. Based on the spectral energy distribution (SED) from radio, optical, and X-ray bands, it has been argued that the X-ray intensity is too high to be explained by synchrotron or synchrotron self-Compton radiation from a single population of electrons.
A currently favored hypothesis for the strong X-ray emission is relativistically-amplified inverse Compton (IC) scattering of cosmic microwave background (CMB), in which the bulk flow of the jet is assumed to be relativistic, with a Lorentz factor all the way to nearly Mpc distances, and to be directed toward the observer at a small viewing angle of (Tavecchio et al., 2000; Celotti, Ghisellini, & Chiaberge, 2001). However, some difficulties in this model have been recognized, and alternative scenarios have been proposed (Aharonian, 2002; Dermer & Atoyan, 2002; Stawarz & Ostrowski, 2002; Atoyan & Dermer, 2004). Discussions of these models are hampered by poorly known physical conditions in quasar jets, as well as by limited observational windows available so far.
In this Letter, we present Spitzer IRAC imaging at wavelengths 3.6 and of the jet of the superluminal quasar PKS 0637752. With the unprecedented sensitivity afforded by IRAC, the observation aimed at measuring the mid-infrared part of the broadband nonthermal spectrum of the jet knots. Also we have searched for a possible infrared bump, which is expected if the jet is indeed highly relativistic at hundreds kpc distances from the central engine, and contains cold (a Lorentz factor ) electrons. The redshift of PKS 0637752 is (Savage, Browne, & Bolton, 1976), so we adopt a luminosity distance of , for a CDM cosmology with , , and .
2. Observations and Results
We have observed PKS 0637752 with Spitzer IRAC on 2005 March 27 as part of our Cycle-1 General Observer program (Spitzer Program ID 3586). IRAC is equipped with a four-channel camera, InSb arrays at 3.6 and and Si:As arrays at 5.8 and , each with a field of view (Fazio et al., 2004). Only the pair of 3.6 and arrays, observing the same sky simultaneously, was chosen for the observation of PKS 0637752, to obtain longer exposures in one pair of bandpasses as opposed to two pairs with truncated exposure time. The 3.6/5.8 pair was chosen for a better spatial resolution and sensitivity. The pixel size in both arrays is . The point spread functions are and (FWHM) for the 3.6 and bands, respectively (Fazio et al., 2004). A total of 50 frames per IRAC band, each with a 30-s frame time, were obtained. The 50 images of the Basic Calibrated Data processed in the Spitzer Science Center (SSC) were combined into a projected image using the SSC software mopex.
Our aims are to explore possible infrared emission of the jet close () to the quasar core. For this purpose, the wings of the bright core must be subtracted carefully. We made use of the point response function (PRF) image of a bright star provided by the SSC to cancel out the PRF wings. We also employed three bright field stars in our image as PRF templates, and found that the results from the SSC template are consistent with those from the field star templates. In our image, on the other hand, there are no suitable stars for such comparisons. In what follows, we present both the 3.6 and results making use of the SSC template alone. The infrared fluxes from the core of PKS 0637752 were measured as 5.0 and 9.6 mJy in the and bands, respectively. These values are below the saturation limits for a 30-s frame.
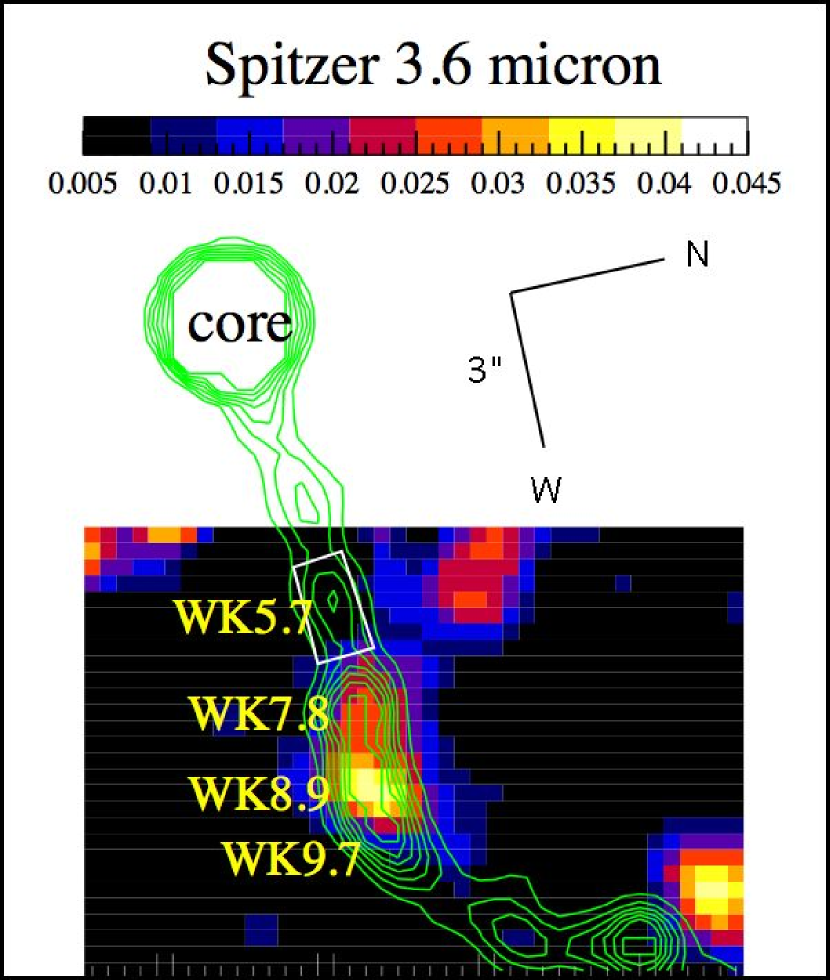
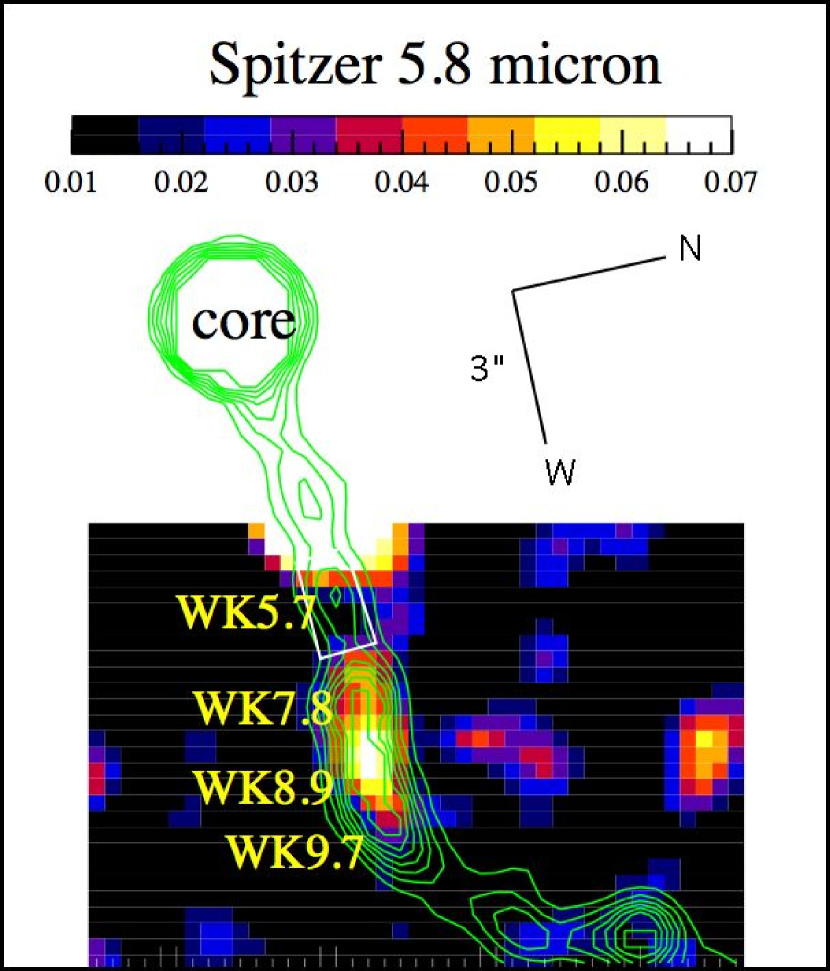
Figure 1 shows the IRAC images of PKS 0637752 after subtraction of the PRF wings of the core. The pixel size of the projected images of both channels was set to be 1/4 of . Regions close to the quasar core are blanked out due to residuals in the wing-subtraction. Mid-infrared counterparts of the main optical knots, WK7.8 and WK8.9 (Schwartz et al., 2000), which are also the main X-ray features, are clearly visible in both channels, located west of the core. The two optical knots are marginally separated in the infrared images. In the image, WK8.9 appears to be brighter than WK7.8, as in the optical. In the X-ray, WK8.9 is brighter than WK7.8 but the fluxes are more similar (Chartas et al., 2000). No significant infrared emission can be seen at WK5.7, WK9.7 ( times fainter than WK8.9 in the optical), or farther components after a bending point at west of the quasar.
Photometry was performed with diameter apertures enclosing both WK7.8 and WK8.9, which finds and for 3.6 and , respectively. The errors include the uncertainties associated with PRF removal, adopting 10% of the quasar’s wing intensity at the location being considered. Note that we measure the sum of infrared flux from the two optical knots. The infrared-to-optical slope111We define , with (for ) and . We take and (Schwartz et al., 2000). is , significantly steeper than the spectral index at either radio or X-ray wavelengths, i.e., and (Chartas et al., 2000).
Although the separation of the two knots is only , we can derive a rough flux ratio between WK7.8 and WK8.9 at the band, thanks to the high significance and better PRF in this band. The flux from WK8.9 is higher by a factor of than WK7.8, in agreement with a factor of in the optical.
We can place upper limits on the IR fluxes from a “quiet” region preceding the nonthermal condensations WK7.8–8.9. For a white box in Fig. 1 that encloses WK5.7, and (at a level) are obtained. The flux uncertainty is computed as , where is the “noise pixels” taken from Fazio et al. (2004) and presents the background noise in which PRF-removal uncertainty is also formally included. We use these flux limits later in §3.2.
3. Discussion
3.1. SED of Knot WK7.8
The mid-infrared fluxes that we have measured fill central points in the SED of the jet knots and, therefore, set an important constraint on models of the broadband emission. In Fig. 2, we show the SED for knot WK7.8, the first bright knot which has been frequently modeled in the literature. The knot is unresolved both in the radio image (ATCA) and the HST image (Schwartz et al., 2000). Also the corresponding knot is visible in the deconvolved Chandra X-ray image (Chartas et al., 2000). The emissions in these bands most likely emerge from the same physical volume. (In contrast, knot WK8.9 appears elongated along the jet in the optical, and so may involve multiple knots.) Setting a flux ratio in the infrared between WK7.8 and WK8.9 to be 1.4 based on the optical (see above), we associate flux densities of (at ) and (at ) with knot WK7.8.
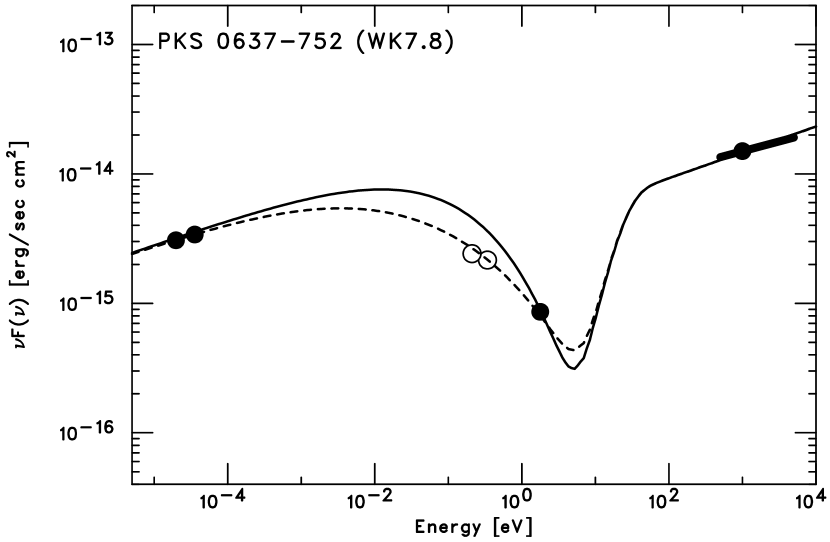
The radio-to-optical spectrum is now arguably attributable to synchrotron radiation, because extrapolation of the radio spectrum can smoothly connect with the infrared and optical fluxes assuming normal steepening due to radiative cooling. Specifically, we first assume that the energy distribution of the electrons (in the jet co-moving frame) follows for , where is the normalization, denotes the Lorentz factor of relativistic electrons, and to match the radio slope (). To reproduce the optical flux, we obtain , where and are the characteristic Doppler factor222 The Doppler factor is defined as where the velocity of the jet, the bulk Lorentz factor of the jet, and is the observing angle with respect to the jet direction. and co-moving magnetic field strength (the solid line in Fig. 2). The low energy cutoff is arbitrary as long as .
This simple model for the synchrotron component overpredicts the mid-infrared flux by a factor of . To account for this discrepancy, we modified the form of the electron distribution to with , which is a smooth broken power law with an exponential cutoff, taking account of possible synchrotron and IC (in the Thomson regime) cooling. Fitting the SED with this model, we obtain and (the dashed line in Fig. 2).
Here we also model the X-ray spectrum, for illustrative purpose, by the IC/CMB model (Tavecchio et al., 2000), namely by the model invoking relativistically-amplified IC scattering on CMB radiation, with the Doppler factor of [corresponding to case (b) in §3.2] and . In order to produce the X-ray flux and at the same time to suppress the optical flux by the IC process, we obtain a tight constraint, . Note that the IC/CMB model for the X-rays generally requires large power carried by nonthermal relativistic electrons, , where is the adopted radius of the knot and is the energy density of nonthermal electrons in the jet frame, which can be written as with the number density of nonthermal electrons . For example, one needs in the case of the parameter set (b) in §3.2 (, , and ).
The detected mid-infrared fluxes well constrain the highest energy part of the electron distribution, roughly . In addition, as we show below, the non-detection of infrared light from the jet preceding WK7.8 strongly constrains the lowest energy () electrons, which have yet to be accelerated.
3.2. Bulk Compton Radiation
The relativistically-amplified IC/CMB scenario raises the interesting possibility that an infrared bump may appear as a result of “bulk Comptonization” (hereafter BC), namely Comptonization of the CMB photons by “cold” () electrons or positrons in the ultrarelativistic jet stream (Sikora et al., 1997; Georganopoulos et al., 2005). The BC bump is expected to have a blackbody-like spectrum peaking at the energy , independent of redshift, where is the mean energy of the CMB radiation at . For , the bump appears at the infrared wavelength . The isotropic BC luminosity from relativistic jet containing cold electrons, assuming a cylindrical geometry of radius and length , is given by Georganopoulos et al. (2005):
| (1) |
where is the Thomson cross section, , and is the jet power carried by cold electrons that upscatter CMB radiation into the infrared, defined as with the number density of cold electrons in the jet frame, .
Along a “quiet” stream between the core and the first bright knot WK7.8, it is expected that unseen cold particles are propagating and generating BC radiation. In Fig. 3, we present BC spectra calculated for the quiet portion of the jet, assuming for illustrative purpose that . The length of this region is set to be appropriate for the white box in Fig. 1, where the flux upper limits were derived in §2. We consider the three characteristic cases as follows: (a) , , (b) , , (c) , . These parameters are chosen for the consistency with the VSOP and VLBI observations, which found superluminal motions on milliarcsecond scale ( pc distances from the core) with a mean apparent speed of , indicating (Lovell et al., 2000). The viewing angles are set by the well-known relation (see Urry & Padovani, 1995) with , which yields two solutions for given . For , the smaller angle solution requires an unlikely long jet, exceeding a de-projected total length of 2.2 Mpc, and therefore is omitted. From Fig. 3, one can constrain by comparing the calculated BC spectra to the flux upper limits obtained from the IRAC data. The results are summarized in Table 1.
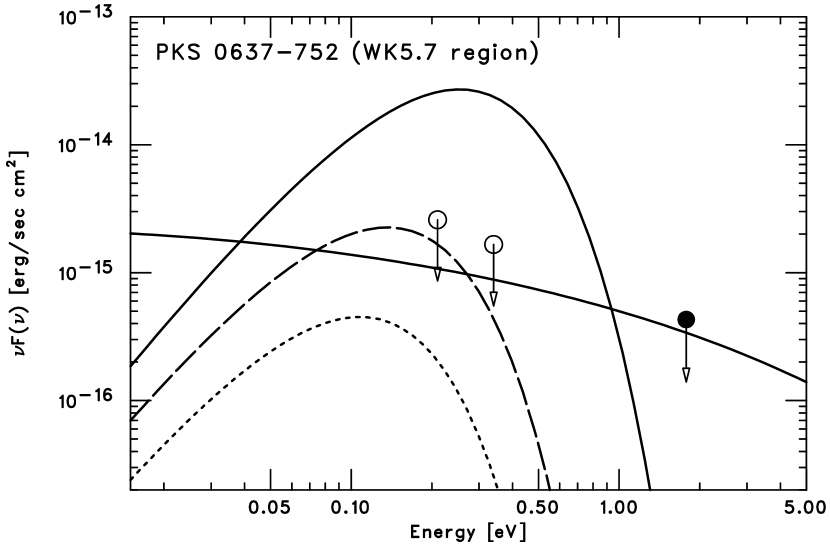
In Table 1, the jet power in nonthermal electrons, , is given based on the IC/CMB modeling of knot WK7.8 (with ), together with the lower limits on . The ratio of the energy densities of nonthermal electrons and magnetic fields is also shown. It appears that case (c) has uncomfortably large and because of small (see also Dermer & Atoyan, 2004).
| Case | ||||||||
|---|---|---|---|---|---|---|---|---|
| (deg) | ||||||||
| (a) | 12 | 15.6 | ||||||
| (b) | 12 | 8.4 | ||||||
| (c) | 15 | 5.3 |
The limits on impose meaningful constraints on the jet models. If the jet is dynamically dominated by pairs, one can assume that the energy flux of nonthermal electrons at the knot is stored in cold pairs before the first knot, therefore (i.e. ). However, we obtain for all cases (see Table 1). Our estimates of cannot be noticeably reduced by increasing (through the relation ) as is set by the X-ray spectrum. Also, changing in a plausible range both for and 15 does not affect our conclusion in this regard. Therefore, as long as the IC/CMB scenario is correct, our result argues against pure jet models.
Interestingly, on sub-pc scales in radio loud quasars, a similar conclusion has been reached by Sikora & Madejski (2000) that jet composition with pure pairs can be excluded by the absence of BC radiation at X-ray energies due to Comptonization of UV photons. The present work is the first time that jet composition on scales of many kiloparsecs has been constrained in this way.
The number density of cold electrons relative to that of nonthermal electrons can be constrained as (see Table 1), through the relation and . We note that these limits are difficult to explain within the standard picture of particle acceleration, namely diffusive shock acceleration, in which it is generally expected that only a small fraction of the cold electrons can be accelerated to nonthermal energies, and consequently . One may need to invoke alternative models regarding the X-ray emission mechanism (namely IC/CMB) and/or the acceleration mechanism.
A possible caveat is that the above discussion relies on the simplified picture that the power transported by the jet is constant. If the ejection of power at the base of the jet is discontinuous, the emission knots may represent “power peaks” and the average jet power could be smaller than the value of we calculated. It should also be noted that in our calculations of the BC spectra, we have assumed monoenergetic cold electrons of . If instead a certain fraction of pairs is “hot” with of a few, the BC spectrum can be different from our calculation, extending to optical energies. Even so, because of the lower limit on the optical flux, the limits on would be similar to, or tighter than, what we obtained above.
References
- Aharonian (2002) Aharonian, F. A. 2002, MNRAS, 332, 215
- Atoyan & Dermer (2004) Atoyan, A. M., & Dermer, C. D. 2004, ApJ, 613, 151
- Celotti, Ghisellini, & Chiaberge (2001) Celotti, A., Ghisellini, G., & Chiaberge, M. 2001, MNRAS, 321, L1
- Chartas et al. (2000) Chartas, G., et al. 2000, ApJ, 542, 655
- Dermer & Atoyan (2002) Dermer, C. D., & Atoyan, A. M. 2002, ApJ, 568, L81
- Dermer & Atoyan (2004) Dermer, C. D., & Atoyan, A. M. 2004, ApJ, 611, L9
- Fazio et al. (2004) Fazio, G., et al. 2004, ApJS, 154, 10
- Georganopoulos et al. (2005) Georganopoulos, M., Kazanas, D., Perlman, E., & Stecker, F. W. 2005, ApJ, 625, 656
- Kataoka & Stawarz (2005) Kataoka, J., & Stawarz, Ł. 2005, ApJ, 622, 797
- Lovell et al. (2000) Lovell, J. E. J., et al. 2000, in Astrophysical Phenomena Revealed by Space VLBI, ed. H. Hirabayashi, P. G. Edwards, & D. W. Murphy (Sagamihara: ISAS), 215
- Marshall et al. (2005) Marshall, H. L., et al. 2005, ApJS, 156, 13
- Sambruna et al. (2004) Sambruna, R. M., Gambill, J. K., Maraschi, L., et al. 2004, ApJ, 608, 698
- Savage, Browne, & Bolton (1976) Savage, A., Browne, I. W. A., & Bolton, J. G. 1976, MNRAS, 177, 77P
- Schwartz et al. (2000) Schwartz, D. A., et al. 2000, ApJ, 540, L69
- Sikora & Madejski (2000) Sikora, M., & Madejski, G. 2000, ApJ, 534, 109
- Sikora et al. (1997) Sikora, M., Madejski, G., Moderski, R., & Poutanen, J. 1997, ApJ, 484, 108
- Stawarz & Ostrowski (2002) Stawarz, Ł., & Ostrowski, M. 2002, ApJ, 578, 763
- Tavecchio et al. (2000) Tavecchio, F., Maraschi, L., Sambruna, R. M., Urry, C. M. 2000, ApJ, 544, L23
- Urry & Padovani (1995) Urry, C. M., & Padovani, P. 1995, PASP, 107, 803