On the X-ray Properties of OH Megamaser Sources: Chandra Snapshot Observations
Abstract
We present Chandra snapshot observations for a sample of 7 sources selected from the Arecibo OH megamaser (OHM) survey at and with far-infrared luminosities in excess of 1011 . In contrast with the known H2O megamasers, which are mostly associated with powerful Active Galactic Nuclei (AGN), the situation is far less clear for OHMs, which have been poorly studied in the X-ray band thus far. All of the observed sources are X-ray weak, with only one OHM, IRAS FSC 035210028 (), being detected by Chandra (with 5 counts). The results from this pilot program indicate that the X-ray emission, with luminosities of less than erg s-1, is consistent with that from star formation (as also suggested in some cases by the optical spectra) and low-luminosity AGN emission. If an AGN is present, its contribution to the broad-band emission of OHM galaxies is likely modest. Under reasonable assumptions about the intrinsic X-ray spectral shape, the observed count distribution from stacking analysis suggests absorption of cm-2.
keywords:
galaxies: active — galaxies: interactions — galaxies: nuclei — galaxies: starburst — X-rays: galaxies1 Introduction
Extragalactic hydroxyl (OH) megamaser (OHM) emission has been studied since the early eighties when it was discovered in Arp 220 (Baan, Wood & Haschick 1982). To be produced, OHM activity requires (1) high molecular density ( cm-3; Baan 1991), (2) a “pump” to invert the hyperfine population of the OH ground state, and (3) a source of 18 cm continuum emission to stimulate maser emission (Burdyuzha & Komberg 1990), whose main lines are at 1667 MHz and 1665 MHz and have luminosities =101-4 . The galaxy merger environment is able to supply all of these requirements: the merger/interaction concentrates molecular gas in the merger nuclei, creates strong far-infrared (FIR; 8–1000 m) dust emission from reprocessed starburst and active galactic nucleus (AGN) activity, and produces radio continuum emission. The FIR radiation field and/or collisional shocks in the molecular gas can invert the OH population and thus allow maser emission.
Not surprisingly, all known OHMs have been observed in luminous infrared galaxies (LIRGs; ), often favouring the most FIR luminous (e.g., Baan 1991; Baan, Salzer & LeWinter 1998; Darling & Giovanelli 2002a, hereafter DG02a; Lo 2005), the ultraluminous infrared galaxies (ULIRGs; ). The high FIR luminosities of ULIRGs are commonly thought to arise from dust absorption and FIR re-emission of an intense but obscured starburst and/or AGN radiation field. While it was known early on that ULIRGs nearly always show evidence for interactions (i.e., collisions/mergers; e.g., Sanders & Mirabel 1996; Clements et al. 1996; Borne et al. 2000; Farrah et al. 2001, 2003), many investigators have debated the luminosity dependence of the fraction of interacting systems among the ULIRG population and the possibility that these sources may represent the transition stage between galaxy mergers and quasars (e.g., Farrah et al. 2001; Tacconi et al. 2002; see also Yun et al. 2004).
OHM studies provide powerful diagnostics of the physical conditions in the innermost regions of luminous FIR galaxies. There is evidence that the OH emission is often produced by an ensemble of many masing regions in the nuclear regions of (U)LIRGs on scales of a few hundred parsecs or less (Diamond et al. 1999). VLBI observations of a few nearby OHMs have demonstrated that OH maser emission can arise in circumnuclear discs or tori such as for III Zw 35 (Pihlström et al. 2001) or Mrk 231 (Klöckner, Baan & Garrett 2003), or, as for Arp 220 (Rovilos et al. 2003), the emission can show a complicated, irregular morphology and velocity structure. Blueshifted/redshifted line components in several OHMs (Baan, Haschick & Henkel 1989; Pihlström et al. 2005) have been interpreted as due to bulk outflows/inflows of molecular gas; this is expected given the tidal streaming and starburst-driven winds associated with major mergers. It is noteworthy that most VLBI studies of OHMs show unresolved maser spots of surprising velocity width (tens of km s-1), often attributed to turbulence and suggestive that compact OHM emission may not be pumped by the FIR radiation field alone (e.g. Lonsdale et al. 1998). A notable exception is the infrared quasar Mrk 231, which lacks a compact maser component contrary to expectation (Lonsdale et al. 2003; Klöckner, Baan & Garrett 2003). The relationship of OHMs to starbursts versus AGN thus remains murky: all manner of masing is seen coupled with all manner of optical classifications. To obtain deeper insight into the OHM phenomenon, we require a minimal-obscuration means to quantify the role of AGN versus starburst in masing regions. The radio-FIR relation hints at some difference between masing and non-masing (U)LIRGs (DG02a), but there is a degeneracy between starbursts and AGN in this relation.
| Src. Name | Optical | X-ray Obs. | Exp. Time | Reference | ||
|---|---|---|---|---|---|---|
| IRAS FSC | Date | (ks) | (Arecibo Survey) | |||
| 015622528 | 0.1658 | 01 59 02.61 | 25 42 35.4 | 2003 Nov. 08–09 | 4.00 | (1) |
| 025242046 | 0.1815 | 02 55 17.09 | 20 58 56.5 | 2003 Nov. 08 | 4.31 | (1) |
| 035210028 | 0.1522 | 03 54 42.21 | 00 37 03.8 | 2002 Dec. 25 | 9.78 | (1) |
| 082012801 | 0.1680 | 08 23 12.62 | 27 51 39.6 | 2003 Nov. 20 | 4.41 | (2) |
| 082790956 | 0.2085 | 08 30 39.38 | 09 46 36.1 | 2004 Jan. 13 | 4.38 | (2) |
| 095311430 | 0.2151 | 09 55 50.11 | 14 16 07.9 | 2003 Dec. 09 | 4.03 | (2) |
| 095390857 | 0.1290 | 09 56 34.30 | 08 43 06.1 | 2004 Jan. 06 | 4.81 | (2) |
Notes — The optical positions have been derived from the Digital Palomar Sky Survey (DPOSS2) -band images using SExtractor (Bertin & Arnouts 1996). References — (1) Darling & Giovanelli 2002a (DG02a); (2) Darling & Giovanelli 2001 (DG01).
In contrast with H2O megamasers, which are likely pumped by an
AGN X-ray radiation field (e.g., Baan 1997; Braatz, Wilson
& Henkel 1997; Henkel et al. 1998, 2005; Townsend et al. 2001;
Maloney 2002; Braatz et al. 2003, 2004),
the AGN content of OHMs has not been investigated with a minimal-obscuration
probe of AGN activity, aside from radio continuum
observations of radio-loud AGN that lie well off of the radio-FIR relation.
A previous optical study of OH maser sources (most of which were OHMs)
found comparable fractions of AGN- and starburst-dominated galaxies (Baan et
al. 1998) and a non-negligible fraction of composite spectra (i.e., showing
evidence of both AGN and starburst activity) in the OH maser population.
Because of their penetrating nature, X-rays represent an efficient tool
to provide constraints on the engine powering OHMs. Furthermore, X-rays
typically provide maximal contrast between the AGN emission and that of
the host galaxy and/or starburst component (e.g., Vignati et al. 1999).
Hereafter we adopt =75 km s-1 Mpc-1 in a -cosmology
(=0.3 and =0.7, Spergel et al. 2003).
2 Sample selection and source properties
The goal of the present paper is to provide basic constraints on the X-ray emission of OHM galaxies using Chandra snapshot observations. Past studies have shown evidence for a correlation between the OH line width and the X-ray luminosity in the soft band (Kandalyan 2003) using a compilation of OH masers from the literature (mostly from Baan et al. 1998) detected by ROSAT. This was interpreted as suggesting that X-ray heating of molecular gas provides additional collisional excitation to the maser emission, although further studies are required to investigate this issue. We note, however, that the compilation of OHMs chosen by Kandalyan (2003) is heterogeneous, since it was not drawn from a well defined sample. For these reasons, we prefer to focus, in this pilot Chandra program, on the sample of OHMs selected from the Arecibo Observatory OH megamaser survey which is a flux-limited survey designed to quantify the relationships between merging galaxies and the OHMs that they produce, with the goal of using OHMs as luminous tracers of mergers (and, possibly, of star formation; Townsend et al. 2001) at high redshifts (Darling & Giovanelli 2000, 2001, 2002b, hereafter DG00, DG01, and DG02b, respectively). This survey has been conducted over about one-quarter of the sky to a distance limit of roughly 1 Gpc. Candidates for observations with the Arecibo Observatory were selected from the PSCz (Saunders et al. 2000), which is a flux-limited (IRAS Jy) redshift survey of 15,000 IRAS galaxies over 84 per cent of the sky. The Arecibo survey detected 50 new OHMs in the redshift range 0.11–0.27 (DG02a,b), thus doubling the sample of known OHMs and increasing the sample sevenfold. Thanks to this survey, it is now evident that the fraction of OHMs in (U)LIRGs is an increasing function of : about one-third of the “warmest” (i.e., with higher dust temperatures) ULIRGs are characterized by OH megamasers (DG02a).
The OHM galaxies proposed for observation with Chandra have been chosen using the catalog published by DG01 available at the time of Chandra Cycle 5 proposals (6 of the 7 OHMs described in the following); our targets are among the highest luminosity members ( ; 30–40 per cent of the OHM population in the Arecibo survey) of the maser population (filled circles in Fig. 1).
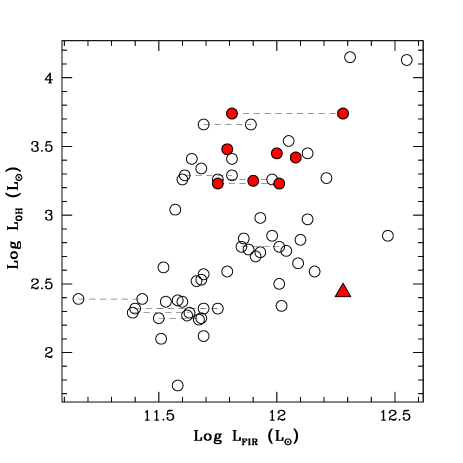
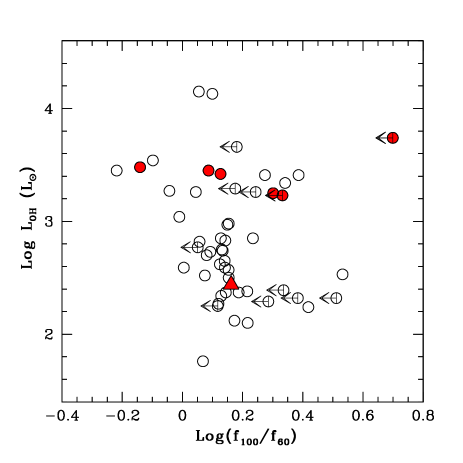
They also constitute a complete sample, since they were targeted in order of right ascension. One additional OHM, characterized by lower OH luminosity (filled triangle in Fig. 1), has been included using an archival Chandra observation. It is worth noting that our OHMs lie at higher redshifts than most of the OHMs with X-ray detections in the literature (e.g., Arp 220 at , Mrk 231 at , etc.). On the basis of the merger/interaction scenario for OHMs discussed in 1, the present sample, with all of the 7 OHMs being characterized by double nuclei111We note that, given the presence of double nuclei, the optical positions reported in Table 1 are intermediate between the two nuclei; in these cases, both nuclei fall in the same 2′′-radius aperture used for X-ray manual photometry (see 3). For IRAS FSC 015622528, we report the position of the optically most luminous nucleus, given the association of the OH and radio emissions with this nucleus. and/or tidal tails (Darling et al., in preparation), can be considered representative of the OH megamaser population overall. Furthermore, their IR colour () distribution shows no significant evidence for any observational bias toward “warm” (i.e., lower values, possibly related to a contribution from an active nucleus) or “cold” galaxies (see Fig. 2).
2.1 Notes on individual sources and optical spectra
In the following, we report on the OH line and optical properties of the 7 OHM galaxies with Chandra observations. A detailed description of their optical spectra is presented in Darling et al. (in preparation).
-
015622528: this source shows the presence of two nuclei (one much brighter than the other) in the optical (with a separation of 6.3′′, i.e., 17.9 kpc), suggestive of a multiple merger. The Eastern component has a starburst classification, while for the Western component there is not enough signal for a spectral classification (see Table 2 for references).
-
025242046: this object has the most unusual spectrum of the Arecibo OHM survey, showing multiple strong narrow components in both OH lines. The optical morphology is elliptical-like with a single tidal tail (Darling et al., in preparation), while the optical spectrum is typical of a starburst galaxy.
-
035210028: this source is comprised of a close pair; both components, separated by 1.3′′ (corresponding to 3.4 kpc), are visible in the Sloan Digital Sky Survey (SDSS) but not in the DPOSS2. This object has been classified as a starburst according to the ISO spectrum (Lutz, Veilleux & Genzel 1999) and a low-ionisation nuclear emission-line region galaxy (LINER) according to the optical spectrum (Nagar et al. 2003).
-
082012801: the HST image shows two nuclei (with a separation of 1.1′′, corresponding to 3.2 kpc), having a starburst classification, and a tidal tail, suggesting an advanced merger (DG01). The NVSS flux density reported in DG01 is associated with a source at a distance of 23′′. Nagar et al. (2003) reported a flux-density upper limit of 0.8 mJy at 15 GHz, roughly corresponding to a 1.4–15 GHz spectral slope of 0.75.
-
082790956: the optical image of this source (classified as a LINER) shows the presence of 3 tidal tails (Darling et al., in preparation).
-
095311430: this galaxy is an interacting system whose components are blended in the images from the Automatic Plate Measuring (APM) facility; the 2MASS position is on the Western component (having a Seyfert 2 spectrum), while the FIRST position is on the Eastern component (characterized by a starburst spectrum; Darling et al., in preparation).
-
095390857: the optical image shows the presence of tidal tails and a single nucleus, classified as a LINER (Veilleux, Kim & Sanders 1999) or Seyfert 2 (Darling et al., in preparation). The two classifications were performed in an identical manner. In both cases, the [O iii]/H ratio lies very close to the (somewhat arbitrary) dividing line between LINERs and Seyfert 2s, and the measured line ratios obtained by both groups agree to within the measurement uncertainties.
Table 2: Multi-wavelength properties of the Arecibo sample of OHMs observed by Chandra. Source Class. Ref. APM IRAS FIRST NVSS (1) (2) (3) (4) (5) (6) (7) (8) (9) (10) (11) (12) (13) (14) (15) (16) (17) 015622528 0.1658 7.46 15.58 17.23 0.809 1.623 11.90 3.25 5.9 STB (1) 025242046 0.1815 11.3 18.08 20.02 0.957 11.81–12.28 3.74 2.6 STB (1) 035210028 0.1522 12.6 18.44 0.233 2.638 3.833 12.28 2.44 6.1 3.9 STB/L (1,2,3,4) 082012801 0.1680 3.59 17.12 18.39 1.171 1.429 12.00 3.45 4.74 STB (4,5) 082790956 0.2085 3.80 18.08 20.04 0.586 11.75–12.01 3.23 2.84 3.7 L (1) 095311430 0.2151 3.07 17.25 19.27 1.040 12.08 3.42 3.23 2.5 S2/L (1) 095390857 0.1290 3.08 17.74 19.62 1.438 1.044 11.79 3.48 5.32 8.50 S2/L (1,3) Luminosities are computed using H0=75 km s-1 Mpc-1, =0.3 and =0.7.
Also in the SDSS Data Release 3 catalog (DR3; Abazajian et al. 2005).
The Eastern nucleus is classified as a starburst, while the Western nucleus is classified as a Seyfert 2 (see text for details).
(1) IRAS FSC Name; (2) redshift; (3) Galactic column density from Dickey & Lockman (1990), in units of cm-2; (4–5) - and -band magnitudes from APM; (6–9) IRAS flux densities, in units of Jy; (10) of the FIR luminosity (in units of ) computed according to =, where is the luminosity distance in Mpc (see Fullmer & Lonsdale 1989); when is an upper limit, the permitted range of is reported (see 2.2 of DG02b); (11) of the OH luminosity, in units of ; (12) integrated 1.4 GHz flux density from FIRST (Becker, White & Helfand 1995); (13) 1.4 GHz flux density from NVSS (Condon et al. 1998); (14) Galactic absorption-corrected flux in the observed 0.5–8 keV band, in units of erg cm-2 s-1; (15) 2–10 keV rest-frame luminosity corrected for the effects of Galactic absorption and computed from the full-band flux (or upper limit) assuming , in units of erg s-1; (16) spectroscopic classification: STB=starburst; L=LINER; S2=Seyfert 2; (17) reference for the spectroscopic classification.
List of references — (1) Darling et al., in preparation; (2) Lutz, Veilleux & Genzel 1999; (3) Veilleux, Kim & Sanders 1999; (4) Nagar et al. 2003; (5) Kim, Veilleux & Sanders 1998.Nagar et al. (2003) reported a flux density of 1.2 mJy at 15 GHz, corresponding to a 1.4–15 GHz spectral slope of 0.6–0.8.
3 X-ray observations and data reduction
Six out of the 7 OHMs presented here were targeted by Chandra during Cycle 5. IRAS FSC 035210028, found at the aim point of a Chandra archival observation, was observed in Cycle 4. This source was targeted in a Chandra program aimed at observing a sample of ULIRGs (see Teng et al. 2005); we are confident that the inclusion of this object does not bias our “original” sample in terms of AGN content (see 4). The observation log is shown in Table 1.
All of the sources were observed with the Advanced CCD Imaging Spectrometer (ACIS; Garmire et al. 2003) with the S3 CCD at the aimpoint. Standard data reduction was adopted (see 2 of Vignali et al. 2005 for a detailed description) using the Chandra Interactive Analysis of Observations (ciao) Version 3.2 software. Source detection was carried out with wavdetect (Freeman et al. 2002) using a false-positive probability threshold of 10-6. We searched for Chandra sources within 0.8′′ of the optical position. IRAS FSC 035210028 is the only detected source (filled triangle in Fig. 1), with 5 counts in the observed 0.5–8 keV band; we note that this is also the source with the highest exposure by Chandra (see Table 1). Given the adopted threshold and the small number of pixels being searched due to the known source positions and the sub-arcsec on-axis angular resolution of Chandra, the probability that this detection is spurious is extremely low (). All of the remaining sources (shown as filled circles in Fig. 1) were not detected also using higher (i.e., less conservative) threshold values (up to 10-4).
Table 3 summarizes the X-ray photometric results in the soft band (0.5–2 keV), the hard band (2–8 keV), and the full band (0.5–8 keV) using circular apertures centred on the optical source position and an extraction radius of 2′′. Although two X-ray photons falling in adjacent pixels can be considered in some circumstances a detection (given the low background level of Chandra observations; see, e.g., Vignali et al. 2005), we prefer to follow a more conservative approach and report these sources (2 in the present sample; see Table 3) as X-ray undetected.
| X-ray Counts | CR | |||
|---|---|---|---|---|
| Source | (0.5–2 keV) | (2–8 keV) | (0.5–8 keV) | (0.5–8 keV) |
| 015622528 | ||||
| 025242046 | ||||
| 035210028 | 3.0 | 4.9 | 0.50 | |
| 082012801 | ||||
| 082790956 | ||||
| 095311430 | ||||
| 095390857 | ||||
The two X-ray counts are contiguous.
Errors on the X-ray counts were computed according to Gehrels (1986). The upper limits are at the 95% confidence level and were computed according to Kraft, Burrows & Nousek (1991). For the sake of clarity, upper limits of 3.0, 4.8, and 6.4 indicate that 0, 1, and 2 X-ray counts, respectively, have been found within an extraction region of radius 2′′ centred on the position of the OHM source (considering the background within this source extraction region to be negligible). Count rates (CR) are in units of counts s-1.
The final catalog of OHMs from the Arecibo survey (DG02b) was also cross correlated with the ROSAT and XMM-Newton archives; we obtained no further X-ray detections. X-ray constraints from ROSAT observations (available for 9 OHMs) are generally loose because of the large off-axis angles of the sources and the shallow exposures of the pointed PSPC and HRI observations; hence these constraints will not be used in this paper. One OHM was targeted by XMM-Newton (IRAS FSC 132180552 at , with net exposures of 8.6–9.7 ks in the EPIC MOS/pn cameras) but only an upper limit, consistent with the values we obtained for our sources (see 4 and Table 2), was derived (Bianchi et al. 2005). Recently, it has been suggested that this source, characterized by an extremely red infrared continuum (Low et al. 1989) and a blueshifted component in the [O iii] line (e.g., Zheng et al. 2002), might harbour a Compton-thick AGN (i.e., with cm-2), surrounded by a strong starburst (see 4.4 and Fig. 6 of Bianchi et al. 2005). We also note that IRAS FSC 132180552 has the warmest colour in Fig. 2 (i.e., it is the left-most object in the plot), suggestive of an AGN contribution at IR wavelengths.
4 What are X-rays telling us about the nature of the OH megamasers?
The broad-band properties of the OHM sample targeted by Chandra are reported in Table 2. Both the photon index and X-ray luminosity can provide constraints on the nature of the high-energy emission from OHM galaxies. However, such constraints, with the current data, are basic due to the low counting statistics. All of the X-ray sources have rest-frame 2–10 keV luminosities at most of 1042 erg s-1 (see Table 2), which is consistent with both star formation (e.g., Zezas, Alonso-Herrero & Ward 2001; Alexander et al. 2002) and low-luminosity AGN (LLAGN) activity (e.g., Terashima et al. 2002; Terashima & Wilson 2003). The possibility that the observed X-ray emission is largely due to star formation finds support from Fig. 3, where the FIR luminosity is plotted vs. the 0.5–8 keV luminosity. Our sources are located in the left-most part of the diagram, where either starbursts (e.g., Arp 220) or starburst-dominated (i.e., with little apparent contribution from the AGN to the bolometric emission; see Alexander et al. 2005a) sub-mm sources typically lie.
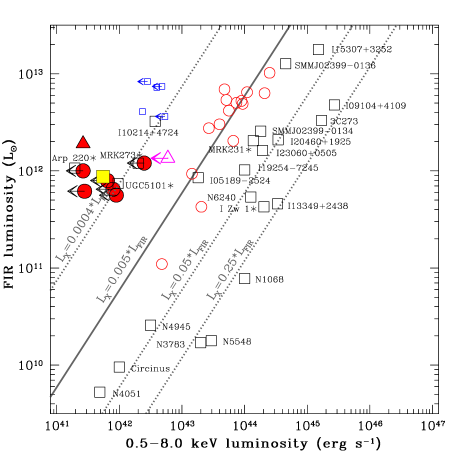
However, some X-ray obscured AGN whose broad-band emission is dominated by star formation are also present in this region; a fraction of these sources are lower redshift OHM sources (e.g., Mrk 273 and UGC 5101); the possibility that our sources could contain absorbed AGN will be discussed in detail using X-ray stacking analysis (see 4.1).
Optical/near-infrared (NIR) spectroscopy (see ) indicates that 50 per cent of our sources show the typical signatures of starburst galaxies, 25 per cent have a LINER classification, and 25 per cent a Seyfert 2 classification (according to the classification reported in Darling et al., in preparation; see also column (16) in Table 2); IRAS FSC 095311430 is counted twice because both nuclei were spectroscopically identified (see Darling et al., in preparation). We note, however, that the optical classification of these sources is difficult: when more than one nucleus is present, unless the projected physical separation of the nuclei is larger than the resolution of the spectrograph, optical spectra will be a blend of nuclei, dominated by the optically dominant (i.e., the least obscured and/or most optically luminous in emission lines) nucleus. However, OHMs seem to favour the dustiest environments and may select the optically “subordinate” nucleus. Therefore, there may be little correlation between OHM properties and optical spectral type. Furthermore, we note that optical and NIR studies are sometimes not adequate to unveil the engine of the X-ray emission. An emblematic, though perhaps extreme, case of different classification at different wavelengths is provided by the ULIRG NGC 6240, which is classified as a starburst in the NIR (Genzel et al. 1998), a LINER in the optical (Veilleux et al. 1995) and a Compton-thick AGN in the hard X-ray band (Vignati et al. 1999; also see Komossa et al. 2003). Some further cases similar to that of NGC 6240 are presented by Maiolino et al. (2003).
Finally, it is interesting to note that the X-ray luminosity and the X-ray-to-FIR luminosity ratio of the only X-ray detected OHM in the present sample do not appear to be different from those of the other sources; given the number of observed counts (see Table 3), the detection of this source has been possible because of the exposure time which is double that of the other OHMs.
4.1 X-ray stacking analysis
We can place tighter constraints on the average X-ray properties of the OHMs under investigation by “stacking” their counts. Our sources have 8 counts in the 0.5–2 keV band and 7 counts in the 2–8 keV band. Monte Carlo simulations in regions close to our targets (see Vignali et al. 2005 for details about the adopted procedure) indicate that the background in all of the 7 fields does not contribute more than 0.14 and 0.31 counts in the soft and hard bands, respectively; therefore we are confident we obtain secure detections in both bands by stacking the counts from the 7 OHMs.222The Poisson probability of obtaining 8 (7) counts or more when 0.14 (0.31) counts are expected is (). The ratio of the observed hard vs. soft-band source counts (0.85) suggests that our sources have, on average, a photon index flatter () than =1.8–2.1, which is typically used for AGN and starburst galaxies at hard X-ray energies (e.g., Piconcelli et al. 2005; Ptak et al. 1999).333We note, however, that a large population of neutron star high-mass X-ray binaries, whose presence is expected in cases of galaxies undergoing intense star formation, can produce a flat ( 0.5–1) photon index; see Colbert et al. (2004). If the hardness of our sources is due to the presence of intrinsic absorption, the implied average column density is 1.5 cm-2 (ranging between 5.8 cm-2 and 2.6 cm-2) at the average redshift of . The corresponding absorption-corrected rest-frame 2–10 keV luminosity would be in the range 1–3 erg s-1. Intrinsically flatter X-ray slopes would produce lower column densities (by 20 per cent, if instead of 2.0 is adopted), while the presence of an additional soft X-ray component (e.g., thermal emission from the starburst) would produce the opposite effect.
Figure 3 shows that, if an active nucleus is present in the OHMs under investigation, its contribution to their broad-band emission is probably modest, unless the AGN is Compton-thick. In the Compton-thick case, the X-ray emission in the Chandra band would be the small (presumably a few per cent; see, e.g., Comastri 2004; Guainazzi, Matt & Perola 2005) scattered/reflected fraction of the nuclear X-ray emission, which would be a few erg s-1 (i.e., at most in the Seyfert regime). The reprocessing of the X-ray and ultraviolet emissions at longer wavelengths would still be insufficient to produce the observed FIR luminosity without requiring a dominant contribution from star formation. We note that some sources from the literature sample are characterized by Compton-thick absorption (e.g., Mrk 231, Gallagher et al. 2002, 2005, Braito et al. 2004; UGC 5101, Maiolino et al. 2003).
Although the presence of obscuration is uncertain and needs to be confirmed by deeper observations with Chandra for an extended sample of OHMs and, possibly, with XMM-Newton for the most “promising” sources, the column density allowed by the current data is consistent with the X-ray absorption observed in many H2O megamasers. These sources, however, are mostly associated with X-ray bright ( 1042-43 erg s-1) and obscured ( cm-2) Seyfert 2 galaxies (e.g., Maloney 2002; Braatz et al. 2003), where the amplifying water vapor molecules are most likely pumped by collisional processes resulting from X-ray heating in parsec-scale molecular tori with densities of 107-8 cm-3 (e.g., Neufeld, Maloney & Conger 1994). Column densities of 1022 cm-2 are not uncommon in local (U)LIRGs (e.g., Risaliti et al. 2000) and LLAGN (e.g., Terashima et al. 2002; Terashima & Wilson 2003). Given the presence of double nuclei and/or indications of past mergers in the OHMs of our sample, it is possible that the starburst itself can produce the obscuration, as suggested by some authors (e.g., Fabian et al. 1998; Ohsuga & Unemura 2001; Wada & Norman 2002).
4.2 X-ray observations of “bona-fide” OHMs from the literature
We obtained further constraints on the X-ray emission from OHM galaxies using the sample of 54 “bona-fide” OH masers [both kilo- ( ) and mega-] from the literature (mostly from Baan et al. 1998), listed in Tables 7 and 8 of DG02a. We caution the reader against over-interpretation of the results we present in this section: this sample is not well defined, lacks either published OH spectra or measurements of the 1667 MHz OH line in about 50 per cent of the cases, and includes some suspect OH detections, as pointed out by DG02a.
Twenty-four OH masers have accessible pointed X-ray observations in the ROSAT, Chandra, and XMM-Newton archives (for one additional source, the XMM-Newton data are not public yet); all of these galaxies are OHMs. Seventeen sources are X-ray detected; the high detection rate ( 70 per cent) is due to the fact that most of these sources were targeted by the sensitive X-ray instruments on-board Chandra and XMM-Newton, while the X-ray non-detections are mostly due to ROSAT observations where the sources are located at large off-axis angles. For most of the sources with sensitive observations, X-ray information is available from published work (Gallagher et al. 2002, 2005; Xia et al. 2002; Maiolino et al. 2003; Ptak et al. 2003; Franceschini et al. 2003, hereafter F03; Satyapal, Sambruna & Dudik 2004; Ballo et al. 2004; Braito et al. 2004; Imanishi & Terashima 2004; Iwasawa et al. 2005); for a couple of sources, Chandra data have been retrieved from the archive and analysed using standard procedures.
We find that AGN emission (with intrinsic X-ray luminosities above erg s-1) is present in eight OHMs. Four of these OHMs are likely characterized by Compton-thick absorption (UGC 05101, Maiolino et al. 2003; NGC 3690 in the galaxy pair Arp 299 system, Della Ceca et al. 2002, Ballo et al. 2004; NGC 4418, Maiolino et al. 2003; Mrk 231, Gallagher et al. 2002, 2005; Braito et al. 2004). However, Compton-thick absorption cannot be ruled out in some low signal-to-noise ratio sources and in Arp 220 (Iwasawa et al. 2001, 2005).
To provide a more appropriate comparison with our Chandra targets, from the subsample of literature OHM with X-ray coverage, we selected those within the same redshift interval, the same range, or the same range as our seven OHMs observed by Chandra. The paucity of objects in the same redshift range (two, with only one X-ray detection) does not allow for any reasonable comparison with our sample; however, it highlights the relevance of the present work, where the redshift range of OHMs with X-ray constraints has been extended significantly. If we select the literature OHMs using the same interval of OH or FIR luminosities as our targets, we find a larger number of objects (12 and nine, respectively). AGN emission is clearly present in three objects (one Compton-thick, Mrk 231, and the other two Compton-thin, Mrk 273 and PKS B1345145), corresponding to 25–33 per cent of the chosen subsamples. LLAGN could still be present in some of the remaining sources, although the X-ray emission from these objects can be well explained by a thermal gaseous component from a starburst plus a hard, moderately absorbed power-law component due to the unresolved binary population (e.g., F03; Teng et al. 2005).
As a further test, we compared the X-ray spectral results for our seven OHMs (see 4.1) with those obtained by F03 with XMM-Newton for their five “bona-fide” lower redshift OHMs without a dominant AGN component (i.e., excluding Mrk 231). We found that our stacked spectrum is generally harder than the X-ray spectra of the F03 OHMs. This result can be ascribed to the different spatial resolutions of the Chandra ACIS and XMM-Newton EPIC cameras and different source-extraction regions. To test this possibility, we used a sample of three starburst galaxies observed by Chandra (Ptak et al. 2003) and XMM-Newton (F03). The soft thermal component appears spatially more extended than the hard component, i.e., it likely provides a stronger contribution to the broad-band X-ray spectrum if large source-extraction regions are chosen (as in the case of XMM-Newton spectra, extracted from circular regions of radius 20′′). Motivated by these considerations, we rescaled the source-extraction regions of our OHMs to match those adopted by F03 (taking into account the different redshift range of the two samples), obtaining a somewhat softer X-ray spectrum (), consistent with F03 results.
In the light of the results obtained from the study of the literature OHMs and keeping in mind all the caveats described above, starburst emission with moderate absorption probably within the binary population is likely to explain the average X-ray properties of our seven OHMs (4.1).
5 Summary
We have analysed Chandra snapshot observations for a sample of 7 galaxies selected from the Arecibo OHM survey at and with FIR luminosities in excess of 1011 . The principal results of this work are
All of the observed sources are X-ray weak; only one OHM, IRAS FSC 035210028 () , was detected by Chandra, with 5 counts in the 0.5–8 keV band.
The X-ray emission is consistent with that from star formation (as also suggested by the comparison with most of the literature OHMs with X-ray constraints) and LLAGN; however, if an AGN is present, its contribution to the broad-band emission of OHM galaxies is probably modest.
Under reasonable assumptions about the intrinsic X-ray spectral shape, the observed count distribution from stacking analysis suggests absorption of cm-2.
Acknowledgments
We acknowledge financial support from MIUR (COFIN grant 03-02-23; CV and AC), Chandra X-ray Center grant G04-5104X (CV and WNB), and NASA LTSA grant NAG5-13035 (WNB). The authors thank D. Alexander for providing us with the data shown in Fig. 3, S. Bianchi and G. Matt for sharing information on the OHM observed by XMM-Newton before publication, C. Gruppioni for useful discussions, A. Tarchi for a careful reading of the manuscript, and the referee for his/her useful comments.
References
- [] Abazajian K. et al., 2005, AJ, 129, 1755
- [] Alexander D.M., Aussel H., Bauer F.E., Brandt W.N., Hornschemeier A.E., Vignali C., Garmire G.P., Schneider D.P., 2002, ApJ, 568, L85
- [] Alexander D.M. et al., 2003, AJ, 125, 383
- [] Alexander D.M., Bauer F.E., Chapman S.C., Smail I., Blain A.W., Brandt W.N., Ivison R.J., 2005a, ApJ, in press (astro-ph/0506608)
- [] Alexander D.M., Smail I., Bauer F.E., Chapman S.C., Blain A.W., Brandt W.N., Ivison R.J., 2005b, Nature, 434, 738
- [] Baan W.A., Wood P.A.D., Haschick A.D., 1982, ApJ, 260, L49
- [] Baan W.A., Haschick A.D., Henkel C., 1989, ApJ, 346, 680
- [] Baan W.A., 1991, in Haschick A., Ho P., eds, ASP Conf. Ser. Vol. 16, Atoms, Ions, and Molecules: New Results in Spectral Line Astrophysics”, Astron. Soc. Pac., San Francisco, p. 45
- [] Baan W.A., 1997, Nature, 386, 445
- [] Baan W.A., Salzer J.J., LeWinter R.D., 1998, ApJ, 509, 645
- [] Ballo L., Braito V., Della Ceca R., Maraschi L., Tavecchio F., Dadina M., 2004, ApJ, 600, 634
- [] Becker R.H., White R.L., Helfand D.J., 1995, ApJ, 450, 559
- [] Bertin E., Arnouts S., 1996, A&AS, 117, 393
- [] Bianchi S., Guainazzi M., Matt G., Chiaberge M., Iwasawa K., Fiore F., Maiolino R., 2005, MNRAS, in press (astro-ph/0507323)
- [] Borne K.D., Bushouse H., Lucas R.A., Colina L., 2000, ApJ, 529, L77
- [] Braatz J.A., Wilson A.S., Henkel C., 1997, ApJS, 110, 321
- [] Braatz J.A., Wilson A.S., Henkel C., Gough R., Sinclair M., 2003, ApJS, 146, 249
- [] Braatz J.A., Henkel C., Greenhill L.J., Moran J.M., Wilson A.S., 2004, ApJ, 617, L29
- [] Braito V. et al., 2004, A&A, 420, 79
- [] Burdyuzha V.V., Komberg B.V., 1990, A&A, 234, 40
- [] Clements D.L., Sutherland W.J., McMahon R.G., Saunders W., 1996, MNRAS, 279, 477
- [] Colbert E.J.M., Heckman T.M., Ptak A.F., Strickland D.K., Weaver K.A., 2004, ApJ, 602, 231
- [] Comastri A., 2004, in Barger A.J., eds, Supermassive Black Holes in the Distant Universe. Kluwer Academic Publishers, Dordrecht, The Netherlands, p. 245
- [] Condon J.J., Cotton W.D., Greisen E.W., Yin Q.F., Perley R.A., Taylor G.B., Broderick J.J., 1998, AJ, 115, 1693
- [] Darling J., Giovanelli R., 2000, AJ, 119, 3003 (DG00)
- [] Darling J., Giovanelli R., 2001, AJ, 121, 1278 (DG01)
- [] Darling J., Giovanelli R., 2002a, AJ, 124, 100 (DG02a)
- [] Darling J., Giovanelli R., 2002b, ApJ, 572, 810 (DG02b)
- [] Darling J. et al., in preparation
- [] Della Ceca R. et al. 2002, ApJ, 581, L9
- [] Diamond P.J., Lonsdale C.J., Lonsdale C.J., Smith H.E., 1999, ApJ, 511, 178
- [] Dickey J.M., Lockman F.J., 1990, ARA&A, 28, 215
- [] Fabian A.C., Barcons X., Almaini O., Iwasawa K., 1998, MNRAS, 297, L11
- [] Farrah D. et al., 2001, MNRAS, 326, 1333
- [] Farrah D., Afonso J., Efstathiou A., Rowan-Robinson M., Fox M., Clements D., 2003, MNRAS, 343, 585
- [] Franceschini A. et al., 2003, MNRAS, 343, 1181 (F03)
- [] Freeman P.E., Kashyap V., Rosner R., Lamb D.Q., 2002, ApJS, 138, 185
- [] Fullmer L., Lonsdale C.J., 1989, Catalogued Galaxies and Quasars Observed in the IRAS Survey, Version 2, Pasadena (JPL)
- [] Gallagher S.C., Brandt W.N., Chartas G., Garmire G.P., Sambruna R.M., 2002, ApJ, 569, 655
- [] Gallagher S.C., Schmidt G.D., Smith P.S., Brandt W.N., Chartas G., Hylton S., Hines D.C., Brotherton M.S., 2005, ApJ, in press (astro-ph/0506616)
- [] Garmire G.P., Bautz M.W., Ford P.G., Nousek J.A., Ricker G.R., 2003, Proc. SPIE, 4851, 28
- [] Gehrels N., 1986, ApJ, 303, 336
- [] Genzel R. et al., 1998, ApJ, 498, 579
- [] Guainazzi M., Matt G., Perola G.C., 2005, A&A, in press (astro-ph/0508265)
- [] Henkel C., Wang Y.P., Falcke H., Wilson A.S., Braatz J.A., 1998, A&A, 335, 463
- [] Henkel C., Peck A.B., Tarchi A., Nagar N.M., Braatz J.A., Castangia P., Moscadelli L., 2005, A&A, 436, 75
- [] Kandalyan R.A., 2003, A&A, 404, 513
- [] Kim D.-C., Veilleux S., Sanders D.B., 1998, ApJ, 508, 627
- [] Klöckner H.-R., Baan W.A., Garrett M.A., 2003, Nature, 421, 821
- [] Klöckner H.-R., Baan W.A., 2004, A&A, 419, 887
- [] Komossa S., Burwitz V., Hasinger G., Predehl P., Kaastra J.S., Ikebe Y., 2003, ApJ, 582, L15
- [] Kraft R.P., Burrows D.N., Nousek J.A., 1991, ApJ, 374, 344
- [] Imanishi M., Terashima Y., 2004, AJ, 127, 758
- [] Iwasawa K., Matt G., Guainazzi M., Fabian A.C., 2001, MNRAS, 326, 894
- [] Iwasawa K., Sanders D.B., Evans A.S., Trentham N., Miniutti G., Spoon H.W.W., 2005, MNRAS, 357, 565
- [] Lo K.Y, 2005, ARA&A, 43, in press
- [] Lonsdale C.J., Diamond P.J., Smith H.E., Lonsdale C.J., 1998, ApJ, 493, L13
- [] Lonsdale C.J., Lonsdale C.J., Smith H.E., Diamond P. J., 2003, ApJ, 592, 804
- [] Low F.J., Cutri R.M., Kleinmann S.G., Huchra J.P., 1989, ApJ, 340, L1
- [] Lutz D., Veilleux S., Genzel R., 1999, ApJ, 517, L13
- [] Maiolino R. et al., 2003, MNRAS, 344, L59
- [] Maloney P.R., 2002, PASA, 19, 401
- [] Nagar N.M., Wilson A.S., Falcke H., Veilleux S., Maiolino R., 2003, A&A, 409, 115
- [] Neufeld D.A., Maloney P.R., Conger S., 1994, ApJ, 436, L127
- [] Ohsuga K., Umemura M., 2001, ApJ, 559, 157
- [] Piconcelli E., Jimenez-Bailón E., Guainazzi M., Schartel N., Rodríguez-Pascual P.M., Santos-Lleó M., 2005, A&A, 432, 15
- [] Pihlström Y.M., Conway J.E., Booth R.S., Diamond P.J., Polatidis A.G., 2001, A&A, 377, 413
- [] Pihlström Y.M., Baan W.A., Darling J., Klöckner H.-R., ApJ, 618, 705 2005, ApJ, 618, 705
- [] Ptak A., Serlemitsos P., Yaqoob T., Mushotzky R., 1999, ApJS, 120, 179
- [] Ptak A., Heckman T., Levenson N.A., Weaver K., Strickland D., 2003, ApJ, 592, 782
- [] Risaliti G., Gilli R., Maiolino R., Salvati M., 2000, A&A, 357, 13
- [] Rovilos E., Diamond P.J., Lonsdale C.J., Lonsdale C.J., Smith H.E., 2003, MNRAS, 342, 373
- [] Sanders D.B., Mirabel I.F., 1996, ARA&A, 34, 749
- [] Satyapal S., Sambruna R.M., Dudik R.P., 2004, A&A, 414, 825
- [] Saunders W. et al., 2000, MNRAS, 317, 55
- [] Spergel D.N. et al., 2003, ApJS, 148, 175
- [] Tacconi L.J., Genzel R., Lutz D., Rigopoulou D., Baker A.J., Iserlohe C., Tecza M., 2002, ApJ, 580, 73
- [] Teng S.H., Wilson A.S., Veilleux S., Young A.J., Sanders D.B., Nagar N.M., 2005, ApJ, in press (astro-ph/0508112)
- [] Terashima Y., Iyomoto N., Ho L.C., Ptak A.F., 2002, ApJS, 139, 1
- [] Terashima Y., Wilson A.S., 2003, ApJ, 583, 145
- [] Townsend R.H.D., Ivison R.J., Smail I., Blain A.W., Frayer D.T., 2001, MNRAS, 328, L17
- [] Veilleux S., Kim D.-C., Sanders D.B., Mazzarella J.M., Soifer B.T., 1995, ApJS, 98, 171
- [] Veilleux S., Kim D.-C., Sanders D.B., 1999, ApJ, 522, 113
- [] Vignali C., Brandt W.N., Schneider D.P., Kaspi S., 2005, AJ, 129, 2519
- [] Vignati P. et al., 1999, A&A, 349, L57
- [] Wada K., Norman C.A., 2002, ApJ, 566, L21
- [] Xia X.Y., Xue S.J., Mao S., Boller T., Deng Z.G., Wu H., 2002, ApJ, 564, 196
- [] Yun M.S., Reddy N.A., Scoville N.Z., Frayer D.T., Robson E.I., Tilanus R.P.J., 2004, ApJ, 601, 723
- [] Zezas A., Alonso-Herrero A., Ward M.J., 2001, Ap&SS, 276, 601
- [] Zheng X.Z., Xia X.Y., Mao S., Wu H., Deng Z.G., 2002, AJ, 124, 18