11email: blopez@am.ub.es 22institutetext: Thüringer Landessternwarte, Sternwarte 5, D-07778 Tautenburg, Germany
22email: jochen@tls-tautenburg.de 33institutetext: Max-Planck-Institut für Astronomie, Königstuhl 17, D-69117 Heidelberg, Germany
33email: mundt@mpia-hd.mpg.de
Very low-mass members of the Lupus 3 cloud ††thanks: Based on observations collected at the European Southern Observatory, La Silla, Chile ††thanks: This publication makes use of data products from the Two Micron All Sky Survey (2MASS), a joint product of the University of Massachussets and the Infrared Processing and Analysis centre/California Institute of Technology, funded by the US National Aeronautics and Space Administration and the US National Science Foundation.
We report on a multi-band survey for very low-mass stars and brown dwarfs in the Lupus 3 cloud with the Wide Field Imager (WFI) at the ESO/MPG 2.2 m telescope on La Silla Observatory (Chile). Our multiband optical photometry is combined with available 2MASS photometry to identify 19 new young stars and 3 brown dwarf candidates as probable members of this star forming region. Our objects are mostly clustered around the cloud core. Stars and brown dwarfs have similar levels of H emission, probably a signature of accretion. One object, a brown dwarf candidate, exhibits a near-infrared excess, which may indicate the presence of a disk, but its H emission cannot be confirmed due to its faintness in the optical passbands. We also find two visual pairs of probable Lupus 3 members that may be wide binaries.
Key Words.:
stars: low-mass, brown dwarfs – stars: pre-main sequence – stars: formation – stars: luminosity function, mass function – stars: circumstellar matter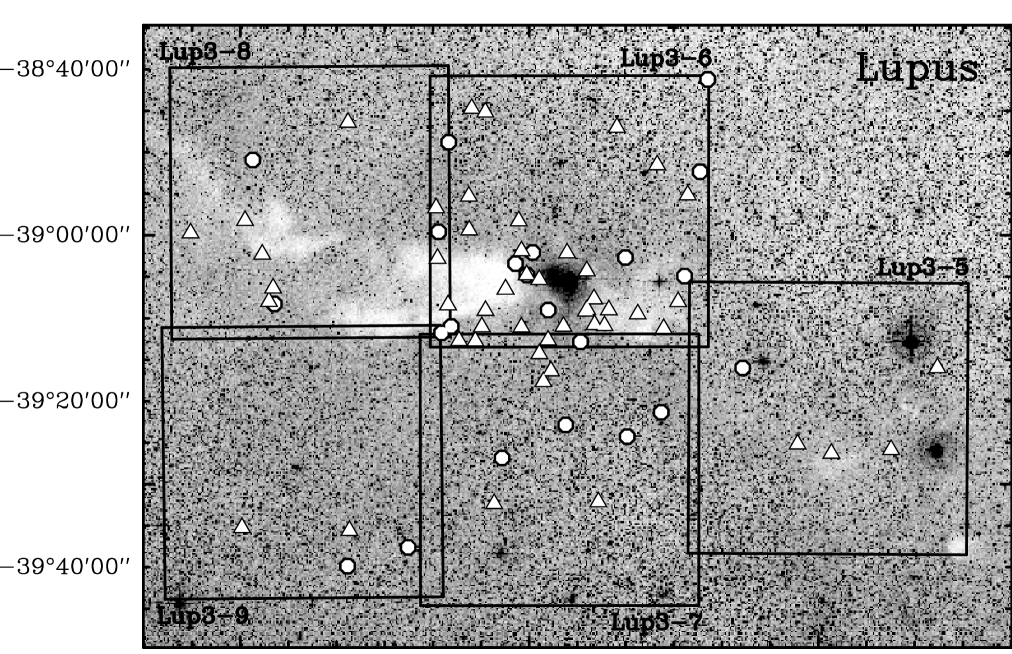
1 Introduction
In the last years our understanding of the process of brown dwarf formation has considerably improved. Observations seem not to support the possibility that these objects form in circumstellar disks, like planets. They instead suggest that circum(sub)stellar disks, accretion and mass loss may be common phenomena in the substellar mass regime (e.g. Muench et al. muench01 (2001); Natta et al. natta02 (2002); Fernández & Comerón fernandez01 (2001); Comerón et al. comeron03 (2003); Mohanty et al. mohanty03 (2003); Luhman et al. luhman03 (2003); Scholz & Eislöffel scholz04 (2004)). Hence, since young brown dwarfs appear to have similar properties to low-mass pre-main sequence stars, they may be produced by a similar mechanism.
Still, some questions remain open. Theoretical models considering the simple collapse of molecular clouds usually fail to reproduce the observed numbers of substellar objects. It is not clear how the accretion process stops before the central object becomes massive enough to start the hydrogen burning. Moreover, the observed star-brown dwarf and brown dwarf-brown dwarf binary frequencies are difficult to explain with a simple extrapolation of the low-mass star formation models (e.g. Close et al. close03 (2003); Bouy et al. bouy03 (2003)).
It has been suggested that the characteristics of the environment may play an important role in the formation of brown dwarfs. For instance, Lucas & Roche (lucas00 (2000)) argue that winds from the massive stars in Orion might have evaporated the gaseous envelopes of the nearby star forming cores, preventing them from growing over the hydrogen burning mass limit. This would also explain why few brown dwarfs are known in the Taurus star forming region, which does not contain such massive stars (Briceño et al. briceno98 (1998); Martín et al. martin01 (2001)). In Chamaeleon~I, though, we do not find any clear relationship between the brown dwarfs and the intermediate mass stars in the cloud, because they are also found near a cloud core devoid of optical objects (López Martí et al. 2004, hereafter Paper (1)). The possibility of formation of free-floating substellar objects by photo-erosion of protostellar cores has been studied by Whitworth & Zinnecker (whitworth04 (2004)), who conclude that this mechanism should be very efficient in producing large numbers of brown dwarfs, operating over a wide range of conditions. However, it requires a relatively massive initial core to form a single low-mass object.
Reipurth & Clarke (reipurth01 (2001)) proposed that brown dwarfs are stellar embryos ejected from multiple systems by dynamical interactions. This hypothesis is supported by several numerical simulations (e.g. Bate et al. bate02 (2002); Delgado Donate et al. dd03 (2003)). In a recent paper, Kroupa & Bouvier (kroupa03 (2003)) use available observational results and theoretical considerations to favour the ejection scenario as the probable origin of the different brown dwarf populations of Taurus and Orion. However, their analysis yields a number of brown dwarfs per star that is lower than inferred by independent measurements of the substellar mass function in the Galactic field.
To distinguish between these suggested brown dwarf formation scenarios it is crucial to obtain unbiased estimates of the substellar mass function from observations of statistically complete and homogeneous populations of very low-mass stars and brown dwarfs in various regions. Star forming regions are of particular importance since their youth ensures that their members have not yet suffered from strong dynamical evolution of the entire region.
The Lupus dark cloud complex consists of five molecular clouds, named Lupus 1 to 5 (Tachihara et al. tachihara96 (1996)), seen as streams or dust lanes in optical and near-infrared images. At least 65 T Tauri stars are known within the complex (e.g Schwartz schwartz77 (1977); Krautter krautter91 (1991); Hughes et al. hughes94 (1994)), most of them concentrated in the Lupus~3 cloud. Two A-type stars, HR~5999 and HR~6000, are seen towards the centre of this cloud. Their membership of the region is controversial, though, because the measured distance to these stars is in disagreement with other distance estimates to the complex (e.g. Crawford crawford00 (2000)).
A peculiarity of Lupus is that the distribution of spectral types for the stars in these clouds is dominated by mid M-type objects, in contrast to other star forming regions like Taurus-Auriga, which contain many late K-type T Tauri stars, as noted by many authors (e.g. Appenzeller et al. appenzeller83 (1983); Hughes et al. hughes94 (1994); Wichmann et al. wichmann97 (1997)). For this reason, Lupus appears as a very promising region to search for young brown dwarfs. Recently, Comerón et al. (comeron03 (2003)) reported a bona-fide brown dwarf, Par~Lup3-1, from a small H survey around the stars HR 5999 and HR 6000. A recent survey in the near-infrared by Nakajima et al. (nakajima00 (2000)) has also provided some brown dwarf candidates.
In this paper we present the results from our multiband survey for brown dwarfs in the Lupus 3 cloud. The method followed is the same as in our previous survey in Chamaeleon I (Paper (1)). The current paper is structured as follows: Our observations are described in Sect. 2. The candidate selection and brown dwarf identification are explained in Sect. 3. In Sect. 4 we analyse the observed spatial distribution of our objects and the frequency of binaries. Their H emission properties are discussed in Sect. 5. Finally, Sect. 6 summarises our conclusions.
2 Observations
| Date | Field | (2000) | (2000) |
|---|---|---|---|
| 28 May 1999 | Lup3-6 | 16h 08m 36.5s | -38∘ 57′ 367 |
| 30 May 1999 | Lup3-7 | 16h 08m 26.3s | -39∘ 28′ 471 |
| 30 May 1999 | Lup3-8 | 16h 11m 01.2s | -38∘ 56′ 279 |
| 3 Jun 1999 | Lup3-5 | 16h 05m 40.6s | -39∘ 22′ 322 |
| 3 Jun 1999 | Lup3-9 | 16h 11m 07.8s | -39∘ 27′ 376 |
An area of about 1.6 was observed in the Lupus 3 cloud with the Wide Field Imager (WFI) at the ESO/MPG 2.2 m telescope on La Silla Observatory (Chile). The surveyed area corresponds to five WFI fields, each of in size (see Fig. 1). Four of the fields (Lup3-6, 7, 8 and 9) define a rectangle centred on the cloud core, seen as an elongated dust lane in our images. The two A-stars HR 5999 and HR 6000 are placed in the southern part of the field Lup3-6. The Lup3-5 field lies towards the south-west of this area, also following the orientation of the core. Table 1 contains the coordinates of the WFI field centres and the date of observation for each field. The observations were carried out in the same three nights as our analogous survey in Chamaeleon I (Paper (1)).
We observed in two broad-band filters, R and I, in a narrow-band filter centred in the H emission line (H/7), and in two medium-band filters, M855 (855/20) and M915 (915/28). The last two allow for a photometric spectral type classification (see Sect. 3.2 below). For each field and filter, except for H, three images with different exposure times were taken (see Table 2). In the case of H, we took only two different exposures per field.
Data reduction, object search, and photometry were performed within the IRAF environment111IRAF is distributed by the National Optical Astronomy Observatory (NOAO), operated by the Association of Universities for Research in Astronomy, Inc. under contract to the US National Science Foundation. in the way explained in Paper (1). After the standard reduction (bias subtraction and flatfield division), all images were divided through an illumination mask to correct for an irregular illumination pattern. For the reddest filters (I, M855, and M915), it was also necessary to subtract a fringe mask to correct for the strong fringing pattern. For each filter, both masks were created by combination of the science exposures as explained by Scholz & Eislöffel (scholz04 (2004)).222An alternative method to correct the WFI illumination gradient using a second-order polynomial has been proposed by Koch et al. (koch04 (2004)).
We ran SExtractor (Bertin & Arnouts bertin96 (1996)) to produce an object catalogue of each surveyed field. For the photometry, the DAOPHOT package was used (Stetson stetson87 (1987)). PSF photometry was performed in order to also measure close pairs of objects. The broad-band photometry was calibrated with Landolt (landolt92 (1992)) standard stars. The extinction coefficients from the fit of these stars for the R and I bands were also used to perform a correction for atmospheric extinction of the H and the M855 and M915 photometry, respectively. No set of standard stars is available for our narrow and medium-band filters. For a better understanding of the emission properties, the H instrumental magnitudes were then shifted so that the main locus of the objects in each surveyed field corresponds to H–R in a (H, H–R) colour-magnitude diagram (see Sect. 3). The mean error in this shift is of less than 0.01 mag for the fields Lup3-6, Lup3-7 and Lup3-8, and of about 0.05 mag in the fields Lup3-5 and Lup3-9. This value is comparable to the mean photometric error (see below). We estimate that our survey is complete down to R20 mag and I19 mag.
As discussed by Alcalá et al. (alcala02 (2002)), the WFI chip-to-chip photometric variations can be as high as 3% in the broad-band filters and 5% in medium-band filters. This is the main error source in our photometric calibration, since only a global fit for all the chips could be performed with the Landolt standard stars. Moreover, a systematic offset was found between images with different exposure times, in the sense of the resulting luminosities being brighter (typically by about 0.05 mag) for longer exposure times. The origin of this offset is so far unknown. To minimise this systematic error, we determined the offsets between the three different integration times, and then shifted the short and long integration times to the system of the medium integration.
The errors in the completeness range are in general not larger than 5%. A more detailed discussion of the calibration procedure and the sources of the photometric errors can be found in Paper (1).
Due to problems with the shutter, several Lup3-7 and Lup3-9 images (including the long and intermediate I-band exposures, necessary for the object selection) exhibit some darker regions at the field edges. Objects in these regions will not be considered in the following analysis.
3 Brown dwarf candidates
3.1 Candidate selection
In Paper 1, candidate members of Chamaeleon I were selected around an empirical isochrone defined by the previously known brown dwarfs and very low-mass stars in the cloud in a (I, R–I) colour-magnitude diagram. In Lupus 3, however, there is no sample of known brown dwarfs that could be used for this purpose. Hughes et al. (hughes94 (1994)) provide broad-band photometry of a sample of known T Tauri stars in the cloud, but most of these bright objects are saturated in our images. Therefore, we had to rely on the theoretical models in this case. Candidate members of Lupus 3 were thus selected around an isochrone from the models of Chabrier et al. (chabrier00 (2000)). To do this, we needed an estimation of both the extinction and the distance to this star forming region.
Hughes et al. (hughes94 (1994)) estimated the individual extinction values towards the Lupus stars in their study. We used these data to derive an average extinction of AV=0.86 in our surveyed region. With this value, and using the following relations:
| (1) |
| (2) |
derived from the extinction law of Rieke & Lebofsky (rieke85 (1985)), an average colour excess of
| (3) |
was computed for the Lupus objects. It must be noted here that Rieke & Lebofsky’s work uses the Johnson R and I filters, while the system used in this paper is closer to the Cousins one. However, tests using the extinction law of Mathis (mathis90 (1990)) showed that the sample of selected objects would not be affected by the use of one or the other extinction law.
There has been some debate about the actual distance to the Lupus clouds. Values between 130 and 220 pc can be found in the literature (see e.g. Crawford crawford00 (2000) for a discussion). Since our extinction estimate is based on the work by Hughes et al. (hughes94 (1994)), we will consider, for consistency, the distance given by these authors, 14020 pc. Within the quoted errors, this value is consistent with most of the more recent measurements (see e.g. Crawford crawford00 (2000); Comerón et al. comeron03 (2003)). However, as discussed later in this paper, this might be an underestimation of the true distance to Lupus 3 (see Sect. 3.2 below).
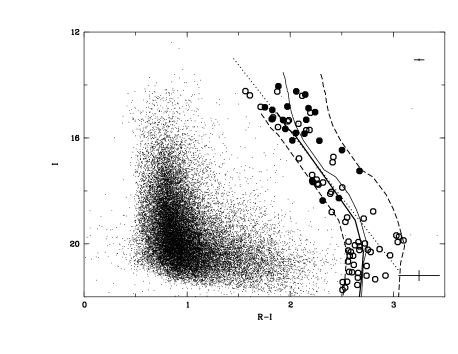
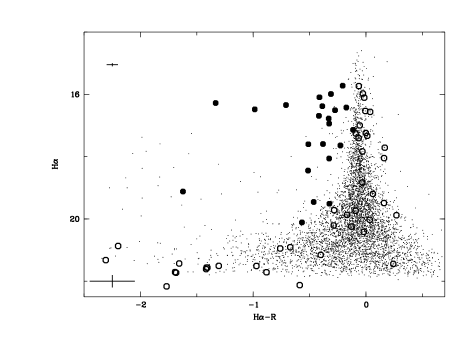
Fig. 2 shows the (I, R–I) colour-magnitude diagram for our surveyed field in Lupus 3. The solid lines are a 1 Myr and a 5 Myr isochrone from the Chabrier et al. (2000) models, shifted to the estimated distance and extinction of the cloud. These isochrones span the age range of the Lupus stars. The dashed lines indicate the position of the isochrones according to the upper and lower limits for the extinction derived in the above calculation. A large number of objects are found between these two lines. Note that there are very few objects to the right of this area; the density of objects is also clearly diminished left of our search area with respect to the main locus of objects seen in the field. Hence, our extinction estimate appears as a reasonable approximation.
In the Lup3-5 field, objects on top of the third CCD chip have bad flux measurements in the long R exposure due to a badly subtracted background. The consequence was that these objects had too faint R magnitudes and thus appeared very red in the (I, R–I) diagram and very blue in the (H, H–R) diagram. Visual inspection showed, however, that these objects were similarly bright in R and I, and thus very unlikely cloud members. Therefore, they were rejected from our candidate list, and are not included in the colour-magnitude diagrams of Figs. 2, 3 and 4. Excluding these objects, we have 85 candidates.
We can compare the diagram in Fig. 2 with the (I, R–I) colour-magnitude diagram for Chamaeleon I (Fig. 2 in Paper (1)). The dotted line in Fig. 2 indicates the position of the empirical isochrone used for candidate selection in Paper (1). Not unexpectedly, given that both regions are at similar distances, this line is almost coincident with the 1 Myr isochrone, except for the faintest objects, for which the R–I colour saturates according to the theoretical models. However, as discussed in detail in Paper (1), the uncertainties in the colours for the faintest objects are large, due both to the photometric errors and to the lack of standard stars that are red enough for a good photometry calibration in this range. This fact may have implications for the contamination with background objects among our faintest candidates, as discussed below.
All the found objects are fainter than I14 mag. According to the Chabrier et al. (chabrier00 (2000)) models, this magnitude roughly corresponds to the stellar/substellar boundary (M0.075 M⊙) at the assumed age (2 Myr, see e.g. Wichmann et al. wichmann97 (1997)) and distance of Lupus 3 (140 pc). The effective temperature given by these models for objects with this mass at this age is around 2900-3000 K, corresponding to spectral types around M6 according to the scale of Luhman (luhman99 (1999)). Thus, if these candidates are indeed members of the star forming region, they must lie close or beyond the star/brown dwarf transition.
Since Lupus 3 is a nearby dark cloud, we do not expect, in principle, a high contamination from foreground and background objects. Simulations of the Galaxy population using the Besançon models (Robin & Crezé robin86 (1986); Robin et al. robin03 (2003)) towards the direction of the Lupus complex yield between 6 and 15 objects in the region of interest of the (I, R–I) colour-magnitude diagram. Taking the most conservative result, we would expect that only around 15% of our candidates should be non-members of the star forming region. However, the colour uncertainties for our faintest objects mentioned above very probably increase this percentage at the lower magnitude limit of our survey. Given the large errors for the faintest objects, we stopped our candidate selection at I mag in Fig. 2. Since the Chabrier et al. (chabrier00 (2000)) models place the planetary mass limit at around this value for our estimated age, distance, and extinction, we do not expect to have planetary mass objects among our candidates.
To confirm the youth of our objects, we tested their H emission. As shown in Paper (1), there is a relation between the H–R colour index and the logarithm of the equivalent width of the H emission line, EW(H): In general, the bluer (i.e., more negative) the H–R colour, the stronger the H emission. Observations of previously known brown dwarf candidates in Chamaeleon I showed that objects with H equivalent widths of 11Å already present H–R colours bluer than the main locus of objects in the field (see Paper (1) for details).
Fig. 3 shows the (H, H–R) colour-magnitude diagram for our Lupus survey. Many of the brightest objects exhibit clear H emission, i.e. negative values of the H–R colour index. Some objects are clear non-emitters, having positive values of the H–R colour index. A number of the faintest candidates also seem to have H emission, but this is very uncertain due to the large photometric errors; therefore, except for an object with an apparent near-infrared excess (see Sect. 3.3 below), they were not further considered. Moreover, twenty-two of the faintest objects are not detected in our H images; hence, they do not appear in Fig. 3. Since nothing can be said about their emitting properties, these 22 faintest objects were also excluded from our study.
For the brightest objects in Fig. 3, we applied the same criterion as Lamm et al. (lamm05 (2004)), retaining the objects with
| (4) |
as probable cloud members. We discarded all the faintest candidates (H20.5 mag), because the large errors at the lower part of the colour-magnitude diagram do not allow us to discriminate between emitters and non-emitters.
Our final sample contains 22 stars and brown dwarf candidates. Note that more than 65% of the objects detected in our H images do not seem to have H emission according to this criterion. Such a low fraction of objects with H emission is not surprising. In NGC~2264, which has an age (1-3 Myr) very similar to Lupus 3, Lamm et al. (lamm05 (2004)) found only 18% of strong H emitters among their low-mass stars with masses On the other hand, some objects might have H emission levels too low to be reliably detected with our data. Moreover, not all young objects show H emission. The scarcity of H emitters among very low-mass stars in other star forming regions suggests that many of the remaining objects from our initial candidate sample belong to the star forming region. Hence, future observations are likely to increase the number of very low-mass members in Lupus 3.
3.2 Spectral types
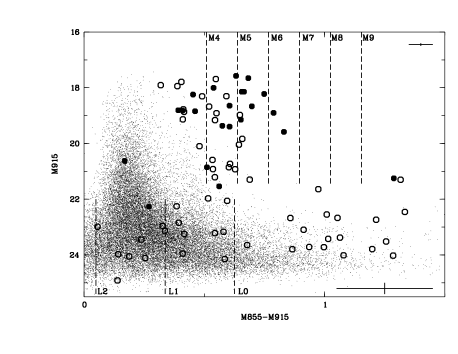
Our medium-band filter M855 lies in a spectral region including the TiO and VO absorption bands used to classify M-type objects (see Kirkpatrick et al. kirkpatrick91 (1991)). The filter M915 covers a pseudocontinuum region in these late-type objects. In Paper (1), we showed that there is a relation between the M855–M915 colour index and the M-subspectral type using synthetic photometry from the models of Baraffe et al. (baraffe98 (1998)). In the range M4-M9, a linear fit is a good approximation of this relation. The corresponding correlation coefficients were determined using photometry of known objects of late spectral type. On the other hand, for spectral types earlier than M4 the M855–M915 colour saturates, because the TiO and VO features are not prominent or not present at all in the spectra. A second correlation, of opposite sign, was found for spectral types L0-L2, due to the progressive disappearance of the TiO and VO from the spectra. In this case, however, the uncertainties are larger than for late M-type objects, given that extincted early M-type objects would be placed in the same region of the colour-magnitude diagram.
This method enabled us to derive spectral types for our brown dwarf candidates from their position in a (M915, M855–M915) colour-magnitude diagram. We estimated an error of 1-2 subclasses in this calibration. A detailed discussion of this photometric spectral type classification, its error sources, and its limitations can be found in Paper (1).
Fig. 4 shows the corresponding (M915, M855–M915) colour-magnitude diagram. The vertical lines indicate our scale for the spectral type determination. It is evident from this figure that most of our objects have spectral types M4-M5, thus lying above, but close to, the substellar boundary. A few objects have spectral types M6 or later, being brown dwarfs or brown dwarf candidates. A “turning back” towards the left, which could be indicative of the beginning of the L spectral sequence, is seen for the faintest objects. This change of tendency happens at a similar M915 magnitude as in the case of Chamaeleon I (Fig. 8 in Paper 1), as expected if both clouds have similar age, distance, and average extinction.
About one half of the fainter candidates are found at the lower left part of the diagram, in the main locus of the objects seen in the surveyed field. In this group, only Lup 654 and Lup 706 seem to have H emission. The other two or three objects in the lower part of the diagram do not show clear H emission in Fig. 3. Except for Lup 642, which shows a near-infrared excess and apparently no extinction (see below), they could not be confirmed as cloud members, and are thus rejected.
The WFI photometry results, spectral types, and classification for our 22 new Lupus 3 members are summarized in Table 3. As in Paper (1), all objects with spectral types earlier than M5.5 (16 objects) are classified as very low-mass stars. Four objects lie in the transition from stars to brown dwarfs with spectral types between M6 and M6.5. Three objects Lup 642, Lup 654, and Lup 706, have estimated spectral types later than M6.5. Although they are considered brown dwarf candidates in the subsequent discussion, it must be kept in mind that their spectral types (all later than M9) are very uncertain.
Note that the largest group of objects corresponds to spectral type M5, as expected from the characteristics of the Lupus region. As mentioned in Section 1, the Lupus 3 cloud is particularly rich in mid M-type objects. It is remarkable, though, that the new members in Table 3 are in general fainter than expected for their estimated spectral types: As stated in the previous section, with the assumed distance and extinction, an object with I14 mag should be of spectral type M6 according to the theoretical models. However, for such objects (see e.g. Lup 915 in Table 3) we derive a spectral type M4, about 2 subclasses earlier than the theoretical prediction, although still marginally coincident with the expectations (we estimate an error of about 2 subclasses in our classification).
The discrepancy between the luminosities predicted by the theoretical models and our results cannot be explained by the photometric errors alone. It may be a consequence of the underestimation of the average extinction in the cloud (see Sect. 3.1). To obtain the measured magnitudes, AV should be about 4.5 mag, a value not unusual in star forming regions. This would also affect our derived spectral types, because the objects would appear redder and fainter, and hence of later spectral type, in our colour-magnitude diagram (see discussion in Paper (1)). However, most of our objects do not seem to be highly extincted (see Sect. 3.3). It may also be that the distance to Lupus 3 has been underestimated. At 200 pc and with the extinction estimate from Sect. 3, a M4 object would have I13 mag, which is closer to our measured values. Indeed, comparison of the predictions of the Lyon models (Baraffe et al. baraffe98 (1998)) with the photometry and spectral types of the mid M-type stars studied by Hughes et al. (hughes94 (1994)), whose distance value has been taken in this work, seems to indicate that, if the extinctions given by these authors are correct, the objects are too faint for their spectral types. For instance, Sz~112, a M4 star with an estimated extinction of A0.85 mag, very close to our assumed average value, has according to Hughes et al. (hughes94 (1994)) an I-magnitude of 13. This also hints to a wrong distance estimate.
A further possibility would be that these objects appear underluminous for their spectral types due to surrounding dust or accretion. Such objects have been reported in other star forming regions (e.g. Fernández & Comerón fernandez01 (2001); Luhman et al. luhman03 (2003)). Although it seems unlikely that most of our Lupus members are affected by such underluminousity, only reported for a minority of objects so far, the possibility cannot be completely excluded without a safer distance and age determination.
There are not many previous optical surveys in Lupus 3 that are deep enough to be compared with our study. We recovered one object from the list provided by Hughes et al. (hughes94 (1994)), Sz~113 (Lup 609s). Our derived spectral type for this object (M5) is later but still consistent, within our estimated errors, with the classification of these authors (M4). On the other hand, Comerón et al. (comeron03 (2003)) estimate an even later spectral type (M6) for the same object. They suggest that the discrepancy between their result and that of Hughes et al. is due to the different spectral ranges used to perform the classification. In view of this, we decided to keep our derived spectral type for this object. The classifications by other authors are given in a footnote to Table 3. Other objects from Hughes et al. (hughes94 (1994)) seen in our images are too bright and hence saturated.
Comerón et al. (comeron03 (2003)) reported on four new Lupus 3 members identified in a spectroscopic survey of a small area around HR 5999 and HR 6000. Of them, one (Par-Lup3-2) is not present in our images because it falls in an interchip gap. The other three have R–I colours that place them at the edges of our selection band in Fig. 2. While Par-Lup3-4 has a relatively blue R–I colour that may be caused by its very high H emission, Par-Lup3-1 and Par-Lup3-3 are placed to the red of our objects in the (I, R–I) colour-magnitude diagram. Since these objects are all placed in a small area around the stars HR 5999 and HR 6000, in a region of high extinction in the Lupus 3 cloud, this might indicate that we are missing highly extincted objects with our selection criteria. However, as commented in Section 3.1, there are not many objects towards the right of our selection band, so this loss should not be very significant. Moreover, objects with very red R–I colours (3 mag) are more likely to be background stars seen through the dark cloud.
| Name | (2000) | (2000) | R | I | H | M855 | M915 | SpTc | Classification |
|---|---|---|---|---|---|---|---|---|---|
| mag | mag | mag | mag | mag | |||||
| Lup~504 | 16 06 47.0 | -39 16 15.8 | 16.77 | 14.94 | 16.38 | 18.54 | 18.00 | M4 | star |
| Lup~604s | 16 08 00.2 | -39 02 59.7 | 16.51 | 14.36 | 16.09 | 18.34 | 17.65 | M5.5 | star |
| Lup~608s | 16 09 08.5 | -39 03 43.8 | 16.30 | 14.24 | 15.99 | 18.21 | 17.57 | M5 | star |
| Lup~609sd | 16 08 57.8 | -39 02 23.6 | 17.05 | 14.88 | 16.34 | 18.81 | 18.14 | M5e | star |
| Lup~605 | 16 07 14.0 | -38 52 37.9 | 18.96 | 16.46 | 18.45 | 20.41 | 19.58 | M6.5 | trans. obj. |
| Lup~607 | 16 08 28.1 | -39 13 09.6 | 18.39 | 16.10 | 18.06 | 19.94 | 19.36 | M5 | star |
| Lup~617 | 16 08 48.2 | -39 09 20.1 | 17.27 | 15.02 | 16.94 | 18.97 | 18.22 | M6 | trans. obj. |
| Lup~642f | 16 09 01.5 | -39 05 06.1 | 22.6: | 19.9; | 21.7: | 23.0: | 23.0; | L2 | BD cand. |
| Lup~648 | 16 09 48.6 | -39 11 17.6 | 17.11 | 15.28 | 16.69 | 19.25 | 18.64 | M5g | star |
| Lup~650 | 16 09 49.8 | -38 49 04.5 | 19.84 | 17.62 | 19.5; | 21.36 | 20.85 | M4 | star |
| Lup~652 | 16 07 09.5 | -38 41 30.3 | 20.7; | 18.36 | 20.1: | 22.1; | 21.54 | M4.5 | star |
| Lup~654 | 16 07 23.4 | -39 05 13.2 | 19.92 | 17.25 | 19.5; | 22.5; | 22.3; | L1 | BD cand. |
| Lup~710s | 16 09 17.1 | -39 27 09.4 | 17.98 | 15.84 | 17.60 | 19.80 | 19.15 | M5 | star |
| Lup~713s | 16 07 37.7 | -39 21 38.8 | 17.61 | 15.66 | 16.28 | 19.69 | 18.90 | M6 | trans. obj. |
| Lup~706 | 16 08 37.3 | -39 23 10.8 | 20.7; | 18.27 | 19.1; | 22.5; | 21.24 | L0 | BD cand. |
| Lup~707 | 16 08 28.1 | -39 13 09.7 | 18.11 | 16.09 | 17.60 | 20.00 | 19.39 | M5 | star |
| Lup~714 | 16 07 58.9 | -39 24 34.9 | 16.78 | 14.81 | 16.51 | 18.80 | 18.14 | M5 | star |
| Lup~802s | 16 11 51.2 | -38 51 04.2 | 17.11 | 15.29 | 16.78 | 19.30 | 18.84 | M4 | star |
| Lup~810s | 16 09 54.6 | -39 12 03.4 | 16.60 | 14.84 | 16.42 | 19.20 | 18.81 | M4 | star |
| Lup~818s | 16 09 56.3 | -38 59 52.1 | 17.42 | 15.25 | 16.60 | 19.34 | 18.57 | M6 | trans. obj. |
| Lup~831s | 16 11 38.6 | -39 08 27.1 | 17.25 | 15.32 | 17.14 | 19.23 | 18.82 | M4 | star |
| Lup~914 | 16 10 16.1 | -39 37 53.4 | 17.87 | 15.81 | 17.64 | 20.79 | 20.62 | M4 | star |
| Lup~915 | 16 10 54.1 | -39 40 07.0 | 15.93 | 14.05 | 15.72 | 18.70 | 18.24 | M4 | star |
-
a
H, M855, and M915 magnitudes are instrumental magnitudes.
-
b
Photometric errors: blank: 0.05 mag; semicolon: 0.1 mag; colon: 0.2 mag
-
c
Errors in the spectral types: M4-M6: 2 subclasses; M6.5-M9: 1 subclass
-
d
This object is identified with Sz 113 (Schwartz schwartz77 (1977))
- e
-
f
Near-infrared selected (see text).
-
g
Ambiguous spectral type (see text).
3.3 Infrared detections
| Name | J | H | K | 2MASS Name |
|---|---|---|---|---|
| mag | mag | mag | ||
| Lup 604s | 12.145 | 11.452 | 11.071 | 16080017-3902595 |
| Lup 608s | 12.202 | 11.642 | 11.358 | 16090850-3903430 |
| Lup 609s | 12.465 | 11.724 | 11.257 | 16085780-3902227 |
| Lup 605 | 14.207 | 13.569 | 13.201 | 16071400-3852375 |
| Lup 617 | 12.870 | 12.257 | 11.965 | 16084817-3909197 |
| Lup 642 | 15.381 | 15.536 | 14.162 | 16090155-3905055 |
| Lup 710s | 13.548 | 13.044 | 12.661 | 16091713-3927096 |
| Lup 713s | 13.240 | 12.566 | 12.130 | 16073773-3921388 |
| Lup 706 | 15.174 | 14.240 | 13.829 | 16083733-3923109 |
| Lup 714 | 12.576 | 11.922 | 11.590 | 16075888-3924347 |
| Lup 802s | 13.252 | 12.561 | 12.254 | 16115116-3851047 |
| Lup 810s | 12.837 | 11.683 | 11.263 | 16095449-3912035 |
| Lup 818s | 13.006 | 12.392 | 11.991 | 16095628-3859518 |
| Lup 831s | 12.507 | 11.192 | 10.689 | 16113859-3908273 |
We made use of the database of the 2MASS survey333Available online at the URL of the NASA-IPAC Infrared Science Archive (IRSA): http://irsa.ipac.caltech.edu/ to look for near-infrared counterparts of the 102 objects (with and without H emission) in our initial candidate list. In this way, we intended not only to further confirm the youth of our 36 H emitters, but also to eventually identify new candidate cloud members. We found 40 positive detections, of which 27 are objects without detectable H emission from their H–R colours. All 2MASS sources are placed at distances not larger than about 1 from the given positions for our objects, hence the cross-identifications are very reliable in all cases.
Table 4 summarizes the photometry of the new Lupus 3 members from Table 3 that were detected by 2MASS. The photometric errors are in general around 0.02-0.03 in all three bands. In total, about 50% of the stars and all the transition objects from Table 3 are detected by 2MASS. Two of the brown dwarf candidates are also found.
Above I19 mag, more than 70% of the objects were detected by 2MASS, the missing objects in this range being all placed in the outer parts of the cloud. This is not unexpected, because in those regions the K magnitude for a given I magnitude should be fainter due to lower reddening. Most of the WFI candidates not detected in the infrared belong to the faintest optical sources; hence, they probably lie below the 2MASS detection threshold.
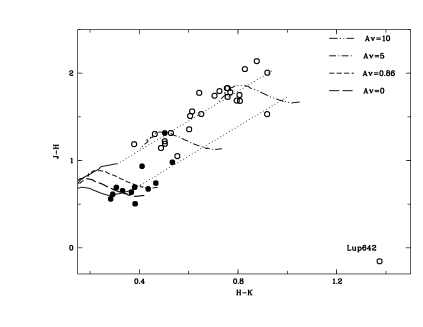
Fig. 5 shows the (, ) colour-colour diagram for our 2MASS objects. Objects with and without H emission are marked with different symbols. The solid lines indicate the position of the main sequence stars according to Bessell & Brett (bessell88 (1988)). The positions of a 1 Myr isochrone from the Baraffe et al. (baraffe98 (1998)) models for several values of extinction are also indicated.
A degeneracy in the near-infrared colours exists between main sequence late-type dwarfs and giants and pre-main sequence low-mass stars. On the other hand, no matter whether they are true Lupus members or not, the objects in Fig. 5 are not equally extincted. All the objects without H emission have moderate to high values of AV (5 mag). Most of them are found along the reddening line for giants (upper dotted line); hence, given the lack of H emission, they are probably obscured stars seen through or at the edges of the dark cloud. In contrast, most of the H emitters are found at low or zero values of extinction, consistent with our selection criterion from Fig. 2. Three objects with H emission are placed at values of AV between 2 and 5 mag.
Only one object, Lup 642, seems to have a near-infrared excess according to the colour-colour diagram in Fig. 5. This detection suggests its belonging to the Lupus 3 cloud, despite not having clear H emission. However, this object lies very near a previously known Lupus T Tauri star (see Sect. 4.2), also detected by 2MASS, and its near-infrared photometry might be contaminated by this brighter source.
No other object from our initial sample shows excess emission in the near-infrared. Such an excess is commonly detected in young objects and has its origin in a circum(sub)stellar disk. It must be noted, however, that the non-detection of a near-infrared excess does not automatically exclude an object from having a disk. We will discuss this fact later in Sect. 5.
4 Spatial distribution
4.1 Observed distribution
Fig. 1 shows the positions of our new very low-mass members of the Lupus 3 cloud (dots) and of the objects without H emission from our initial selection (triangles). Most of the objects are found within or at the boundaries of the cloud core (seen as an elongated dust lane in the image), particularly near the apparent location of the two intermediate-mass stars HR 5999 and HR 6000.
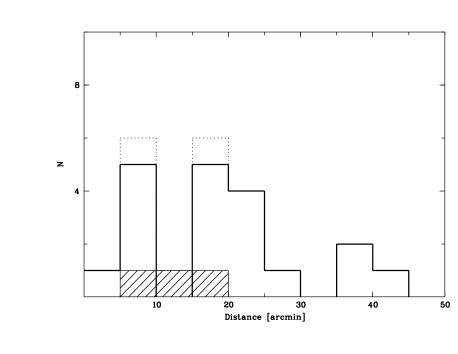
In analogy to the analysis performed for Chamaeleon I, we have counted the number of objects at different distance bins from the intermediate-mass stars; the histograms derived from these counts are shown in Fig. 6. Two maxima are found at 5-10 and 15-20 from the intermediate mass stars, corresponding to the cluster of very low-mass objects seen around HR 5999 and HR 6000 in Fig. 1. The three brown dwarf candidates are all placed within this distance. Further away, the numbers of stars decrease. We remark that the bins include all objects at a given distance in all directions. Inspection of Fig. 1 shows that, in fact, the objects further than about 15-20 are not concentred in one particular area. At shorter distances, however, most of the objects are seen along the dark ridge, a region of higher density in the cloud (see e.g. Tachihara et al. tachihara96 (1996)). Note also that there might be some incompleteness in the first bin (distances 0-5), because very close faint objects might be blended by the brighter intermediate-mass stars.
Although some objects are found far from the cloud core, it is clear from Figs. 1 and 6 that most of the Lupus members, and particularly the brown dwarf candidates, are still very close to their birth site. This distribution does not seem to support the ejection model of Reipurth & Clarke (2001) unless, as argued by Kroupa & Bouvier (kroupa03 (2003)), dynamical interactions between members are able to keep the ejected brown dwarfs within the cluster. Kroupa & Bouvier (kroupa03 (2003)) successfully explain why a large number of these objects are found in the star-rich Orion clusters, but not in the more sparse Taurus-Auriga star forming region. However, Lupus (and also Chamaeleon I) is an intermediate case between these two. Detailed calculations for this region should be performed before stating whether dynamical interactions could have retained the ejected brown dwarfs also in this cloud.
The association with the intermediate mass stars might be accidental, since their belonging to the cloud is not clear: Several distance measurements yield a value of about 190-220 pc for these stars (see Wichmann et al. wichmann98 (1998); Crawford crawford00 (2000), and references therein), inconsistent with other estimations of the distance to the Lupus clouds (between 140 and 160 pc). On the other hand, in Paper (1) no clear relationship could be established between the very low-mass objects and the intermediate mass stars in Chamaeleon I; the former were found near the dark cloud cores, independently of the presence of higher mass stars in these cores.
4.2 Wide binaries
To check the existence of multiple systems among our objects, we first derived the average surface density in our surveyed area. Then we computed the minimum distance at which an object should have a neighbour if the distribution were completely uniform. In this way, we estimated a maximum separation of about 55 (about 770 AU for a distance of 140 pc) to look for binary candidates.
Despite their clustering around the cloud cores, few visual pairs are found among our probable Lupus members. Only two objects, the transition object Lup 818s (M6) and the faint brown dwarf candidate Lup 642, are seen near a previously known Lupus star: The former lies at about 4 (560 AU) of Sz~119, while the latter is found at about 6 (840 AU) of Sz~114. The visual binary frequency of Lupus 3 is thus very similar to that of Chamaeleon I, where also only a few possible systems were seen (Paper (1)).
Only precise proper motion and radial velocity measurements showing common space motion may enable us to decide if these pairs are true physical binaries. It is remarkable, though, that in both Lupus 3 and Chamaeleon I the binary candidates have a separation very close to the upper limit separation estimated for each cloud.444Note that in Chamaeleon I this cutoff was larger, 12, due to its lower object density. This might indicate that there is no real physical connection between the two members of these visual pairs.
5 H emission

As explained in Sect. 3, the value of the H–R colour index is related to the equivalent width of the H line and hence, to the intensity of the H emission. The distribution of the H–R colour with the spectral type is shown in Fig. 7. The data seem to indicate an increase of the H emission with later spectral type, but the lack of objects of late M spectral type does not allow a definitive conclusion. Even if this were the case, we caution that the apparent higher emission might just be the effect of a lower continuum. Moreover, the two possible L-type objects have very different values of the H–R colour index, which could be an indication of contamination with earlier type, highly extincted objects. Even with these uncertainties, it is remarkable that no decrease of the emission (and thus probably also the accretion rate, as discussed below) is seen across the substellar boundary.
This can be better analysed by directly considering the H flux and/or luminosity of our objects. Following Paper (1), we computed a pseudoflux F̃Hα as:
| (5) |
where denotes the H (instrumental) magnitude, and F0 is a hypothetical H absolute flux. We remark that this is a flux derived from the magnitude measured in our H band, and not the flux in the H spectral emission line, which can only be determined with spectroscopy. From this quantity F̃Hα, a H “pseudoluminosity” L̃Hα was computed using the distance estimate of 140 pc.
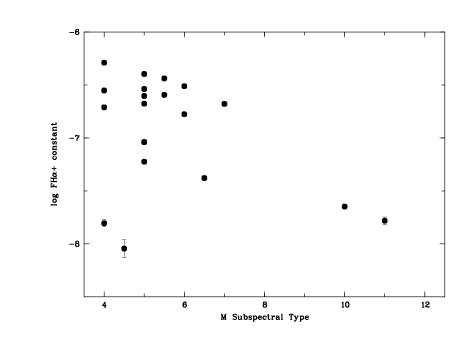
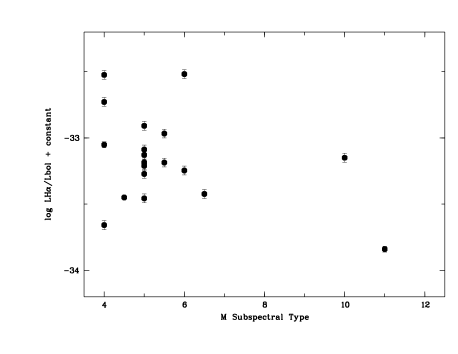
The upper panel in Fig. 8 shows the H pseudoflux as a function of the spectral type for our Lupus objects. The data apparently indicate a decrease of log F̃Hα with later spectral type. This is probably just the expression of the progressive faintness of our objects. Indeed, if we plot L̃Lbol instead, which should not be dependent on the distance or radius of the objects, no significant decrease of the emission with the spectral type is seen any longer (see lower panel in Fig. 8). An analogous behaviour was observed also in the Chamaeleon I cloud (cf. Fig. 14 in Paper 1). To obtain the bolometric luminosities, we have followed the method outlined by Comerón et al. (comeron00 (2000)), using a distance value of 140 pc and R–I intrinsic colours from Kenyon & Hartmann (kenyon95 (1995)) and Zapatero Osorio et al. (zo97 (1997)).
Since the Lupus members have H emission properties similar to the Chamaeleon I objects, this emission must have a similar origin in both clouds. In the case of Chamaeleon I, the strongest emitters were shown to have a reported mid-infrared excess; hence, their H emission is most likely due to accretion from a circum(sub)stellar disk. It seems thus plausible that also the Lupus objects are accreting from a disk. It is remarkable in this context that only one of our objects detected by 2MASS may have a near-infrared excess, a common indication of the presence of a disk around a pre-main sequence star. Nonetheless, several recent works (e.g. Comerón et al. comeron00 (2000); Natta & Testi natta01 (2001); Natta et al. natta02 (2002); Paper (1)) show that clear near-infrared excess is not always detected in objects with such cool photospheres. Hence, observations in the mid- and far-infrared might reveal disks around the Lupus objects.
If confirmed as an intrinsic property of the objects (and not caused by a wrong distance or age estimation), a further indication of ongoing accretion would come from the apparent underluminosity of our new Lupus members (Sect. 3.2). Underluminous objects have been reported by other authors (e.g. Fernández & Comerón fernandez01 (2001); Luhman et al. luhman03 (2003); Comerón et al. comeron03 (2003)). They typically show indications of accretion (and sometimes also mass loss) in their spectra, particularly a prominent H emission line. Comerón et al. (comeron03 (2003)) discuss several possible origins for this apparent underluminosity, such as light scattering by a circum(sub)stellar disk seen edge-on or extinction through a dusty envelope. They finally suggest that the evolution of these objects may be critically affected by the accretion process, thus making them appear fainter than the predictions of the theoretical models, which are based on too simplified assumptions. Clearly, spectroscopy of our Lupus objects will be very useful to clarify their nature.
Outflows or chromospheric magnetic activity may also contribute to the observed amount of H emission from our objects. It is not possible, however, to disentangle the mechanisms possibly responsible for this emission with the available data.
6 Conclusions
We have performed a survey for very low-mass objects in the Lupus 3 dark cloud. In an area of about 1.6 we found 19 new stellar and 3 brown dwarf candidate members.
Like in Chamaeleon I, the Lupus low-mass objects are mostly located near the cloud core, with no evident signs of luminosity segregation. There is no obvious decrease of the H emission for the objects with the latest spectral types. The emission properties of the new Lupus members resemble those of the Chamaeleon I members. This indicates a similar origin, most probably accretion. However, in our analysis of the 2MASS data we find only one object which could have a near-infrared excess. Nonetheless, given that circum(sub)stellar disks are not always revealed by near-infrared photometry, we expect that many of our objects with H emission (if not all of them) may turn out to have disks in future mid- and far-infrared surveys.
The most important caveats in our study are, on one side, the uncertainties in the distance and extinction of the Lupus 3 members, and, on the other, the uncertainties in our photometric spectral type classification, especially for the faintest objects in our sample, that might be affected by extinction. We particularly remark that in general our objects appear too faint for their estimated spectral type according to the theoretical models. While the most probable reason for this discrepancy is a wrong distance estimate, we cannot rule out that the underluminosity is intrinsic to the objects and caused by the presence of circumstellar disks seen edge-on. It is thus mandatory to perform spectroscopy to better constrain the true nature of our candidates and to further study their properties.
Acknowledgements.
We acknowledge much support from I. Baraffe and F. Allard, providing us with synthetic photometry from their brown dwarf models. We kindly thank C. Bailer-Jones for his help with the field selection, and A. Scholz and F. Figueras for useful discussions. J. E. also thanks E. Pompei and the 2p2-team for their support during the observations. We made use of the SIMBAD database, operated at the Centre de Données astronomiques de Strasbourg (CDS) in Strasbourg (France), and of the NASA/IPAC Infrared Science Archive, which is operated by the Jet Propulsion Laboratory, California Institute of Technology, under contract with the US National Aeronautics and Space Administration. This work was supported by the German Deutsche Forschungsgemeinschaft (DFG), projects EI 409/7-1 and EI 409/7-2.References
- (1) Alcalá, J. M., Radovich, M., Silvotti, R. et al. 2002, Proc. SPIE, 4836, 406
- (2) Appenzeller, I., Jankovics, I., & Krautter, J. 1983, A&AS 53, 291
- (3) Baraffe, I., Chabrier, G., Allard, F., & Hauschildt, P. H. 1998, A&A 337, 403
- (4) Bate, M. R., Bonnell, I. A. & Bromm, V. 2002, MNRAS 332, L65
- (5) Béjar, V. J. S., Martín, E. L., Zapatero Osorio, M. R., et al. 2001, ApJ 556, 830
- (6) Bertin, E. & Arnouts, S. 1996, A&AS 117, 393
- (7) Bessell, M. S. & Brett, J. M. 1988, PASP 100, 1134
- (8) Bouy, H., Brandner, W., Martín, E. L. et al. 2003, AJ 126, 1526
- (9) Briceño, C., Hartmann, L., Stauffer, J., & Martín, E. 1998, AJ 115, 2074
- (10) Chabrier, G., Baraffe, I., Allard, F., & Hauschildt, P. 2000, ApJ 542, 464
- (11) Close, L M., Siegler, N., Freed, M. & Biller, B. 2003, ApJ 587, 407
- (12) Comerón, F., Neuhäuser, R. & Kaas, A. A. 2000, A&A 359, 269
- (13) Comerón, F., Fernández, M., Baraffe, I. et al. 2003, A&A 406, 1001
- (14) Crawford, I. A. 2000, MNRAS 317, 996
- (15) Delgado Donate, E., Clarke, C. J. & Bate, M. R. 2003, MNRAS 342, 926
- (16) Fernández, M. & Comerón, F. 2001, A&A 380, 264
- (17) Hughes, J. D., Hartigan, P., Krautter, J. & Kelemen, J. 1994, AJ 108, 1071
- (18) Kenyon, S. J. & Hartmann, L. 1995, ApJS 101, 117
- (19) Kirkpatrick, J. D., Henry, T. J. & McCarthy, D. W. 1991, ApJS 77, 417
- (20) Koch, A., Grebel, E. K., Odenkirchen, M. & Caldwell, J. A. R. 2004, The Messenger 115, 37
- (21) Krautter, J. 1991, in: Reipurth, B. (Ed.), ESO Scientific Report No.11, Low Mass Star Formation in Southern Molecular Clouds, 127
- (22) Kroupa, P. & Bouvier, J. 2003, MNRAS 346, 369
- (23) Lamm, M. H., Mundt, R., Bailer-Jones, C. A. L. & Herbst, W., A&A 430, 1005
- (24) Landolt, A. U. 1992, AJ 104, 340
- Paper (1) López Martí, B., Eislöffel, J., Scholz, A. & Mundt, R. 2004, A&A 416, 555 (Paper 1)
- (26) Lucas, P. W. & Roche, P. F. 2000, MNRAS 314, 858.
- (27) Lucas, P. W., Roche, P. F., Allard, F., & Hauschildt, P. H. 2001, MNRAS 326, 695
- (28) Luhman, K. L. 1999, ApJ 525, 466
- (29) Luhman, K. L., Briceño, C., Stauffer, J. R. et al. 2003, ApJ 590, 348
- (30) Martín, E. L., Dougados, C., Magnier, E., et al. 2001, ApJ 561, L195
- (31) Mathis, J. S. 1990, ARA&A 28, 37
- (32) Mohanty, S., Jayawardhana, R. & Barrado y Navascués, D. 2003, ApJ 593, L109
- (33) Moraux, E., Bouvier, J., Stauffer, J. R. & Cuillandre, J.-C. 2003, A&A 400, 891
- (34) Muench, A. A., Alves, J., Lada, C. J., & Lada, E. A. 2001, ApJ 558, L51
- (35) Nakajima, Y., Tamura, M., Oasa, Y. & Nakajima, T. 2000, ApJ 119, 873
- (36) Natta, A. & Testi, L. 2001, A&A 376, L22
- (37) Natta, A., Testi, L., Comerón, F. et al. 2002, A&A 393, 597
- (38) Reipurth, B. & Clarke, C. 2001, AJ 122, 432
- (39) Rieke, G. K. & Lebofsky, M. J. 1985, ApJ 288, 618
- (40) Robin, A. & Crezé, M. 1986, A&A 157, 71
- (41) Robin, A., Reylé, C., Derrière, S. & Picaud, S. 2003, A&A 409, 523
- (42) Scholz, A. & Eislöffel, J. 2004, A&A 429, 1007
- (43) Schwartz, R. D. 1977, ApJS 35, 161
- (44) Stauffer, J. R., Barrado y Navascués, D., Bouvier, J. et al. 1999, ApJ 527, 219
- (45) Stetson, P. B. 1987, PASP 99, 191
- (46) Tachihara, K., Dobashi, K., Mizuno, A. et al. 1996, PASJ 48, 489
- (47) Whitworth, A. P. & Zinnecker, H. 2004, A&A 427, 299
- (48) Wichmann, R., Krautter, J., Covino, E., et al. 1997, A&A 320, 185
- (49) Wichmann, R., Bastian, U., Krautter, J. et al. 1998, MNRAS 301, L39
- (50) Zapatero Osorio, M. R., Martín, E. L., & Rebolo, R. 1997, A&A 323, 105