Evidence for surface cooling emission in the XMM-Newton spectrum of the X-ray pulsar PSR B2334+61
Abstract
We report on the first XMM-Newton observation of the Vela-like pulsar PSR B2334+61. Spectral analysis reveals soft X-ray emission, with the bulk of the photons emitted at energies below keV. We find that the spectrum has a thermal origin and is well-fitted with either a blackbody or a magnetized, pure H atmospheric model. In the latter case, for a neutron star with a radius of km and a magnetic field of G, the best-fit gives an hydrogen column density cm-2 and an effective temperature K, as measured at Earth. A comparison of the surface temperature of PSR B2334+61 obtained from this fit with cooling curves favor a medium mass neutron star with or , depending on two different models of proton superfluidity in the interior. We do not detect any pulsed emission from the source, and determine an upper limit of 5% for the modulation amplitude of the emission on the pulsar’s radio frequency.
1 Introduction
Young pulsars, neutron stars in supernova remnants (SNRs) and cooling neutron stars make up a subset of rotation-powered radio pulsars that can be observable at shorter wavelengths. Measurements of the high energy radiation are crucial as they provide important insights into the emission processes and the neutron star physics.
Through observation and theoretical modeling it is generally accepted that a combination of emission mechanisms are responsible for the detected X-ray flux from rotation-powered pulsars (for a review see e.g. Becker & Pavlov, 2001; Becker & Aschenbach, 2002). Soft thermal radiation is produced by cooling of the surface of the neutron star (cf. Greenstein & Hartke, 1983; Romani, 1987; Pavlov et al., 1995), while the acceleration of particles in the neutron star magnetosphere generates non-thermal radiation (cf. Michel, 1991; Beskin, Gurevich & Istomin, 1993, and references therein). A harder thermal component can be produced by hot spots at the polar regions (Kundt & Schaaf, 1993; Zavlin, Shibanov & Pavlov, 1995), and the presence of a synchrotron nebula may contribute another source of non-thermal radiation (cf. Arons & Tavani, 1993).
The dominant emission mechanism is related to the age of the pulsar (see e.g. Becker et al., 1996; Pavlov et al., 2002). In pulsars older than yr standard cooling scenarios predict that the temperature of the neutron star surface will be too low to generate detectable thermal X-ray emission (Nomoto & Tsuruta, 1987). However, the source may be observable if reheating via rotational energy loss or heating of the polar caps takes place (Brinkman, Ögelman & Aschenbach, 1985). The middle-aged pulsars ( yr) exhibit spectra that can be described by thermal emission from the surface of the neutron star. In some cases a power-law component is also detected (e.g. Becker & Aschenbach, 2002; Pavlov et al., 2002). In pulsars younger than yr the strong magnetospheric emission prevails over the weaker thermal radiation. By comparing measurements of the soft X-ray flux emitted from the neutron star surface with thermal evolution calculations it is possible to investigate the physical processes that occur in the interiors of these objects (Schaab et al., 1999).
Although many rotation-powered pulsars have now been observed in X-rays, when one considers the number of known radio pulsars, the sample of sources detected at X-ray energies is still small. The prospects of detecting a greater number of these objects is however improving with missions like XMM-Newton and Chandra. It is now possible, even for faint and distant objects like the one presented in this paper, to discriminate whether the dominant mechanism is thermal or non-thermal which in turn permits the first estimates of temperature and/or power law index. In particular, the detection of emission due to cooling is essential to determine where the pulsar lies on the thermal/evolutionary diagram, with the main objective being able to constrain observationally the equation of state of matter at supra-nuclear densities. Currently, there are very few sources for which this is possible, therefore any new source that can be added to the parameter space is important.
One such object that should fall into the category of pulsars for which the cooling neutron star is the dominant source of emission is PSR B2334+61. This Vela-like pulsar is located at a distance of kpc (Cordes & Lazio, 2002). Analysis by Kulkarni et al. (1993) implies that the pulsar is associated with the SNR G114.3, making the source one of the oldest (spin-down age of yr) that is still linked to a SNR. Hence, PSR B2334+61 is a key object to study with relation to the thermal/evolutionary parameter space. The spin-down rate ( s s-1) of the 495 ms pulsar indicates that the magnetic field of PSR B2334+61 is G. PSR B2334+61 was originally detected in a short (8 ks) ROSAT pointing (Becker et al., 1993, 1996) but the low statistics prevented a comprehensive investigation of the spectral properties of the source or a meaningful temporal analysis. Here we report on the first XMM-Newton observation of PSR B2334+61.
2 Observations and data reduction
PSR B2334+61 was observed with XMM-Newton on 2004 February 12. For the spectral and timing analysis we used data from the European Photon Imaging Camera (EPIC) instruments: the EPIC MOS detector (Turner et al., 2001) and the EPIC-PN detector (Strüder et al., 2001). Both MOS instruments and the PN were configured in full frame mode and we used the thin filter. The MOS1 and MOS2 observations had total exposure times of 47.5 ks. The EPIC-PN buffer was filled during the observation resulting in an exposure time of 45.8 ks. We reduced the EPIC data with the XMM-Newton Science Analysis System (SAS version 6.0.0).
In order to maximize the signal-to-noise ratio for our XMM-Newton observation, we filtered the data to include only single, double, triple and quadruple photon events for the MOS, and only single and double photon events for the PN. We included photons with energies only in the range keV.
To verify that there is no contribution to the measured emission from the remnant, we compared the radial profile of the pulsar emission with the XMM-Newton point-spread function for EPIC-PN at 1.5 keV, which we generated using the King profile parameters included in the XMM-Newton calibration file ”XRT3_XPSF_0006.CCF.plt” 111See http://xmm.vilspa.esa.es/docs/documents/CAL-SRN-0100-0-0.ps.gz for more information. We find that the emission we detect from PSR B2334+61 is consistent with that from a point source.
Data have been extracted using a circular region of radius , centered on the radio pulsar’s position. We obtained 600 counts from MOS1, 616 from MOS2, and 2384 from PN. By using a region of equal size offset from the pulsar’s position, we found that the background contributes 439 counts in MOS1, 449 in MOS2, and 1846 in PN. We detect X-rays from PSR B2334+61 at a level of in MOS1, in MOS2, and in PN. The extraction radius we used encircles 85% of the energy from the source in MOS and 83% in PN. The measured fluxes reported in Table 1 have been corrected accordingly.
3 Spectral Analysis
In order to perform the spectral analysis, we extracted the pulsar spectrum from the MOS1, MOS2 and PN event files. Data were filtered to exclude events that may be incorrect, for example those next to the edges of the CCDs and next to bad pixels. The three spectra were regrouped by requiring at least 50 counts per spectral bin. For each spectrum we created a photon redistribution matrix (RMF) and ancillary region file (ARF). The subsequent spectral fitting and analysis was performed using XSPEC, version 11.3.1.
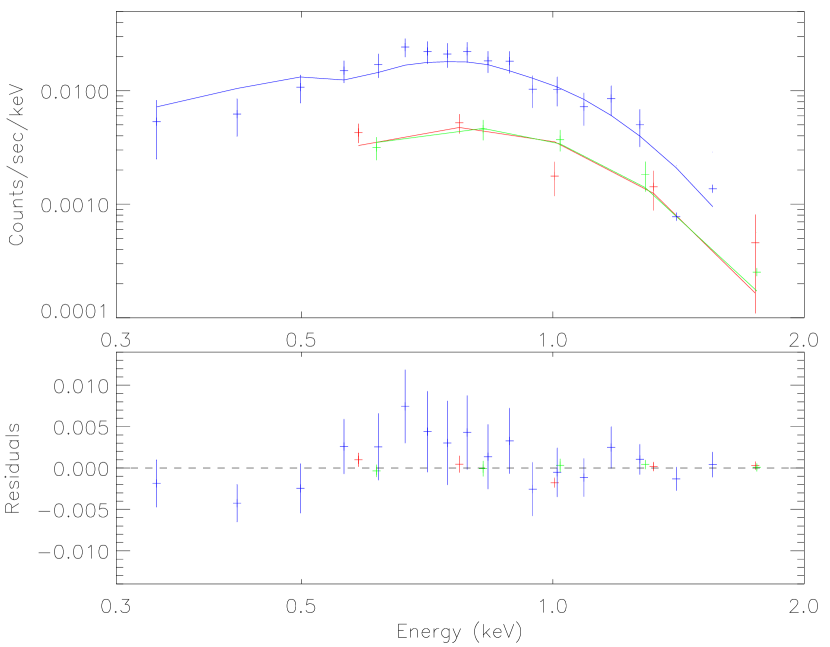
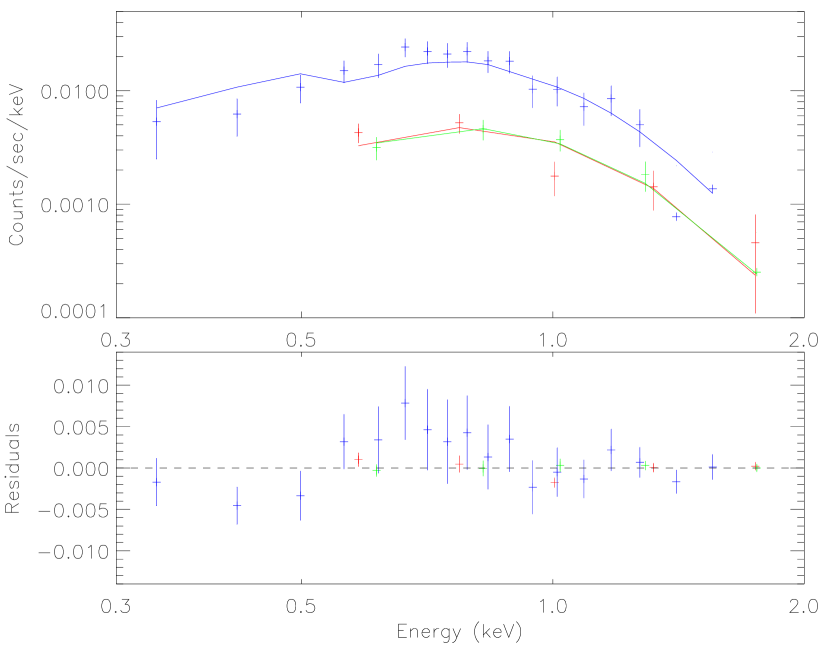
Since essentially no emission is detected at energies keV, we modeled the MOS spectra over keV and the PN spectrum over keV (taking into account the calibration uncertainties for the MOS at low energies). We fitted the combined MOS and PN spectra using different models: initially a power-law, a blackbody and a combination of both, each modified by photoelectric absorption (wabs in XSPEC). The best-fit results are summarized in Table 1. The values indicate that the spectrum is better represented by a thermal (blackbody) model, rather than by an absorbed power-law. The additional power law component in the third (and fifth) fit is poorly constrained, and not required: by applying an -test, we find an -statistic of 1.6 and probability of 0.2. The best-fit blackbody fit gives cm-2 and K (where is the blackbody temperature measured ad Earth222We note that can be obtained by red-shifting at Earth the effective temperature measured at the neutron star surface, , through the relation . is one of the best-fitting parameters of the NSA model.; see Figure 1, first and second panels). We notice that, consistently, this value for the hydrogen column density is lower than the Galactic one in the source direction, which is cm-2, while the same argument can only be applied marginally (within the lower limit of the error bars) to the value of inferred from the power-law fit. The radius of the emitting region, as derived from the blackbody fit using the Cordes & Lazio (2002) distance, is km.
In order to attempt a different representation of the thermal emission detected from PSR B2334+61, we used a magnetized, pure H atmospheric model (nsa in XSPEC, for details see Pavlov et al. 1995), by fixing the magnetic field at G, the value inferred from the radio timing measurements of the source. The neutron star mass and radius (measured at the source) were fixed at and km, respectively, although the spectral fit is not particularly sensitive to these parameters (see §5 for an a posteriori estimate of the mass). We found that this model also provides an excellent representation of the pulsar spectrum, and the best-fit parameters are cm-2 and K, where is the effective temperature as measured at Earth2 (see Table 1). However, this fit gives a pulsar distance of kpc, lower than that inferred from the value of the electron density ( kpc, Cordes & Lazio 2002). Although the pulsar distance and radius are poorly constrained by our data, we find that a better agreement can be reached by using the same atmospheric model and fixing the neutron star radius at a slightly larger value of km. In this case, we find cm-2 and K (see Table 1 and Figure 1, third and fourth panels). The distance resulting from this fit is kpc, which is consistent with the electron density distance. Finally, we verified that even when the thermal component is modeled by a neutron star atmosphere, an additional power law is not required (last fit in Table 1).
We note that the residuals from the model fits shown in Figure 1 are relatively large at keV. To try and reduce the residuals we fitted the data using the previous models, each modified by an absorption, namely phabs or tbabs in XSPEC. We find that the resulting fits are not improved with respect to our previous results.
4 Timing Analysis
For the timing analysis we only used PN data, extracted by applying the filtering criteria and extraction region previously described in §2; the filtered file was then barycentrically corrected. In order to search for an X-ray modulation at the PSR B2334+61 spin period, we first determined a predicted pulse period at the epoch of our XMM-Newton observations, assuming a linear spin-down rate and using the radio measurements (Dewey et al., 1985; Hobbs et al., 2004). We calculate s ( Hz) at the midpoint of our observation (MJD 53,047.6). As glitches and/or deviations from a linear spin-down may alter the period evolution, we then searched for a pulsed signal over a wider frequency range centered on Hz. We searched for pulsed emission using two methods. In the first method we implement the test (Buccheri et al., 1983), with the number of harmonics being varied from 1 to 5. In the second method we calculate the Rayleigh statistic (de Jager, 1991; Mardia, 1972) and then calculate the maximum likelihood periodogram (MLP, Zane et al. 2002) using the statistic (Cash, 1979) to determine significant periodicities in the data sets.
We do not find any significant peak near to the predicted frequency with either method, either using the whole keV energy band or restricting the search to the keV band. By folding the light curve of PSR B2334+61 on the radio frequency and fitting it with a sinusoid, we determine an upper limit for the pulsation of 5% in modulation amplitude (defined as where and are the maximum and minimum of the pulse light curve).
5 Discussion
We have presented the results from the first XMM-Newton observation of PSR B2334+61. The source has been positively detected in all EPIC instruments, although the X-ray emission is very faint and the spectrum does not have a high enough signal-to-noise to make a detailed multi-component fit. However, single component fits allowed us to discriminate between a thermal (blackbody-like) or non-thermal (power law-like) nature of the dominant emission mechanism. We find that the spectrum is well represented by either thermal blackbody-like emission from a small emitting area (e.g. a hot polar cap) of size km or emission from a pure H atmosphere of a neutron star with km and magnetic field G. The EPIC flux, measured in the keV band, is erg cm-2 s-1 and erg cm-2 s-1, in the two cases respectively. Both values are slightly higher than that previously inferred by Becker et al. (1996), erg cm-2 s-1, although we note that due to their limited counts ROSAT data could only be analyzed by making an assumption a priori on the spectral shape. In both cases, the value of is consistently lower than the total galactic one in the pulsar direction. A fit with a power-law model alone is statistically worse, and we find little evidence for the presence of a non-thermal component in the spectrum in addition to the thermal one. The upper limit for the flux contribution from the power-law in the energy range keV to the blackbody fit is 3%, and to the magnetized atmospheric model fit is %. We do not detect X-ray pulsations corresponding to the radio signal, to a limit of 5% in modulation amplitude.
Although both thermal fits are conceivable options, we tend to prefer the atmospheric model representation based on physical grounds. In this case, magnetic effects for a field strength of order G (which is the value inferred from measurements of the source spin period and period derivative in the radio band) are consistently accounted for in the radiative transfer computation. Moreover, a value for the radius of km is in agreement with the prediction of several neutron star equations of state (Lattimer & Prakash, 2001) and we found that this parameter can be successfully adjusted to make the distance inferred from the spectral fit consistent with that obtained from the electron density value of this pulsar.
To date, thermal emission has been detected in only very few radio pulsars: PSR B0656+14 (Possenti et al. 1996), PSR B1055-52 (Pavlov et al. 2002), PSR J0437-4715 (Zavlin et al. 2002), PSR J0538+2817 (McGowan et al. 2003), Geminga (Halpern & Wang 1997), Vela (Pavlov et al. 2001), and PSR B1706-44 (Gotthelf et al. 2002, McGowan et al. 2004). In the case of the first three objects the thermal emission detected above keV is more likely to originate from a hot-polar cap. These sources are in fact old pulsars, at a more advanced stage of their cooling history and their surface emission should peak at much lower (UV) energies. This idea was strengthened by the detection of a further thermal component below keV (Pavlov et al. 2002) in the spectrum of the brightest of them, PSR B0656+14. The Vela pulsar and PSR B1706-44 are younger ( yrs) and are the only radio active sources for which the thermal component observed in the soft X-rays is well explained by a magnetized cooling atmosphere (Pavlov et al. 2001, McGowan et al. 2004). When this model is assumed instead of a blackbody, the inferred radius is in agreement with a neutron star equation of state. The only other neutron stars whose thermal component is better described by an atmospheric model, and for which this interpretation resolves all the inconsistencies which follow from the blackbody interpretation, are the radio-silent neutron stars 1E 1207-52 (Zavlin et al. 1998) and RX J0822-4300 (Zavlin et al. 1999).
The XMM-Newton observation reported here allows us to add another entry to the list. If indeed the X-ray emission detected from PSR B2334+61 is originating in the cooling atmosphere of the neutron star, our estimate of the effective temperature allows us to localize the object in the neutron stars thermal evolutionary diagram.
Our knowledge of neutron star interiors is still uncertain and accurate measurements of the neutron star surface temperature are particularly important to constrain the cooling models and provide information on the physics of the neutron star. Roughly speaking, theoretical models predict a two-fold behavior of the cooling curves depending on the star mass. In low-mass neutron stars neutrino emission is mainly due to a modified Urca process and nucleon-nucleon bremsstrahlung. These are relatively weak mechanisms and produce slow cooling. In stars of higher mass the neutrino emission is enhanced by a direct Urca process (or other mechanisms in exotic matter), therefore these stars cool down much faster (fast cooling regime). To date (see Yakovlev et al. 2002 for a discussion) it has been realized that simple models which do not account for proton and neutron superfluidity fail in explaining the surface temperatures observed in many sources, unless objects such as e.g. Vela, Geminga, RX J1856-3754 do have exactly the critical mass that bounds the transition between the very different slow cooling and fast cooling regimes. This unlikely fine-tuning is not required if the effects of nucleon superfluidity are accounted for. In particular, models with proton superfluidity included predict an intermediate region between fast cooling and slow cooling curves, which is expected to be populated by medium mass neutron stars (roughly with between 1.4 and 1.65 ). Although the full picture only holds if, at the same time, neutron superfluidity is assumed to be rather weak, it is still interesting that many neutron stars (as 1E 1207-52, Vela, RX J1856-3754, PSR 0656+14) have a surface temperature which falls in such a transition region (Yakovlev et al., 2002). In turn, this means that measuring the surface temperature allows us to “weigh” neutron stars (Kaminker et al., 2001). As we can see from the first two panels of Figure 2 in Yakovlev et al. (2002), assuming an age of , the surface temperature of PSR B2334+61 derived from the blackbody fit is even higher than the upper cooling curves i.e. those corresponding to the slow cooling regime. However, the surface temperature obtained by fitting with the magnetized model and km falls well within the above mentioned transition region of medium mass neutron stars. The mass of PSR B2334+61 should then be or , depending on the kind of proton superfluidity assumed in the model (1p and 2p respectively). Indeed, the measured properties of PSR B2334+61 reported here are in remarkable agreement with that measured for PSR B1706-44 (McGowan et al., 2004).
As mentioned in the introduction, we are now in the position to make the first experimental studies of surface temperatures of isolated neutron stars. However, although most of our insight of neutron star temperatures and interior rely on them, at present these studies have to be considered as pioneering. Only a few sources are currently available for this kind of exercise, so every newly discovered candidate is important. At present, X-ray spectra of thermal emission from NSs are fitted with either a blackbody or magnetic atmosphere models. Although the latter definitely represent a substantial improvement, inasmuch they include most of the relevant physics, a large amount of work remains to be done before they can be claimed to be fully satisfactory. The same is true for the cooling curves: progress has been made in improving these models but they can not yet be considered as completely realistic. Besides other effects, we make the caveat that both spectra and cooling curves are computed assuming 1-dimensional transfer of radiation/heat in a single effective temperature, a single magnetic field zone and neglect all effects of more realistic neutron star thermal and magnetic surface distributions (see Zane & Turolla 2005, Page et al. 2004, Blaschke et al. 2004). However, what values to include for these parameters is not necessarily obvious as it is not completely clear what the NS surface temperature distribution is even in the case of a simple dipolar magnetic field (see Geppert, Küker & Page 2004). We also note that interpreting the temperatures obtained from the spectral fits in the context of theoretical cooling curves relies on the true age of the pulsar being the same as the characteristic spin-down age, which may not be valid. Our results for PSR B2334+61 provide information that helps to constrain the current models and will enable more realistic models to be produced in the future.
References
- Arons & Tavani (1993) Arons, J., Tavani, M. 1993, ApJ, 403, 249
- Becker et al. (1993) Becker, W., Trümper, J., Ögelman, H. 1993, IAUC 5805, 3
- Becker et al. (1996) Becker, W., Brazier, K. T. S., Trümper, J. 1996, A&A, 306, 464
- Becker & Pavlov (2001) Becker, W., Pavlov, G. 2001, in The Century of Space Science, ed. J. Bleeker, J. Geiss, & M. Huber (Dordrecht: Kluwer), 721
- Becker & Aschenbach (2002) Becker, W., Aschenbach, B. 2002, in Proc. 270 WE-Heraeus Seminar, Neutron Stars, Pulsars, and Supernova Remnants, ed. W. Becker, H. Lesh, & J. Trümper (Garching bei München: MPI), 273
- Beskin, Gurevich & Istomin (1993) Beskin, V. S., Gurevich A. V., Istomin Ya. N. 1993, Physics of the Pulsar Magnetosphere, Cambridge University Press, Cambridge
- Blaschke et al. (2004) Blaschke, d., Grigorian, H., Voskresensky, D.N. 2004, A&A, 424, 979
- Brinkman, Ögelman & Aschenbach (1985) Brinkman, W., Ögelman, H., Aschenbach, B. 1985, SSRv, 40, 527
- Buccheri et al. (1983) Buccheri, R., et al. 1983, A&A, 128, 245
- Cash (1979) Cash, W. 1979, ApJ, 228, 939
- Cordes & Lazio (2002) Cordes, J. M., Lazio, T. J. W. 2002, (astro-ph/0207156)
- de Jager (1991) de Jager, O. C. 1991, ApJ, 378, 286
- Dewey et al. (1985) Dewey, R. J., Taylor, J. H., Weisberg, J. M., Stokes, G. H. 1985, ApJ, 294, L25
- Geppert, Küker & Page (2004) Geppert U., Küker M., Page D. 2004, A&A, 426, 267
- Gotthelf et al. (2002) Gotthelf, E. V., Halpern, J. P., & Dodson, R. 2002, ApJ, 567, 125
- Greenstein & Hartke (1983) Greenstein, G., Hartke, G. J. 1983, ApJ, 271, 283
- Halpern & Wang (1997) Halpern, J. P., & Wang, F. Y-H. 1997, ApJ, 477, 905
- Hobbs et al. (2004) Hobbs, G., Lyne, A. G., Kramer, M., Martin, C. E., Jordan, C. A. 2004, MNRAS, 353, 1311
- Kaminker et al. (2001) Kaminker, A. D., Haensel, P., & Yakovlev, D. G. 2001, A&A, 373, L17
- Kulkarni et al. (1993) Kulkarni, S. R., Predehl, P., Hasinger, G., Aschenbach, B. 1993, Nature, 362, 135
- Kundt & Schaaf (1993) Kundt, W., Schaaf, R. 1993, Ap & SpSc, 200, 251
- Lattimer & Prakash (2001) Lattimer, J. M., & Prakash, M. 2001, ApJ, 550, 426
- Mardia (1972) Mardia, K. V. 1972, Statistics of Directional Data (London: Academic)
- McGowan et al. (2003) McGowan, K. E., Kennea, J. A., Zane, S., Córdova, F. A., Cropper, M., Ho, C., Sasseen, T., Vestrand, W. T. 2003, ApJ, 591, 380
- McGowan et al. (2004) McGowan, K. E., Zane, S., Cropper, M., Kennea, J. A., Córdova, F. A., Ho, C., Sasseen, T., Vestrand, W. T. 2004, ApJ, 600, 343
- Michel (1991) Michel, F. C. 1991, Theory of Neutron Star Magnetospheres, University of Chicago Press, Chicago, IL
- Nomoto & Tsuruta (1987) Nomoto, K., Tsuruta, S. 1987, ApJ, 312, 711
- Page et al. (2004) Page, D., Lattimer, J.M., Prakash, M., Steiner, A.W. 2004, ApJS, 155, 623
- Pavlov et al. (1995) Pavlov, G. G., Shibanov, Y. A., Zavlin, V. E., Meyer, R. D. 1995, in The Lives of Neutron Stars eds A. Alpar, U. Kilizóglu & J. van Paradijs, Kluwer Academic Publishers, p. 71
- Pavlov et al. (2001) Pavlov, G.G., Zavlin, V.E., Sanwal, D., et al. 2001, ApJ, 552, L129
- Pavlov et al. (2002) Pavlov, G. G., Zavlin, V. E., & Sanwal, D. 2002, in Proc. 270 WE-Heraeus Seminar, Neutron Stars, Pulsars, and Supernova Remnants, ed. W. Becker, H. Lesh, & J. Trümper (Garching bei München: MPI), 273
- Possenti et al. (1996) Possenti, A., Mereghetti, S., & Colpi, M. 1996, A&A, 313, 565
- Romani (1987) Romani, R. W. 1987, ApJ, 313, 718
- Schaab et al. (1999) Schaab, Ch., Sedrakian, A., Weber, F., Weigel, M. K. 1999, A&A, 346, 465
- Strüder et al. (2001) Strüder, L., et al. 2001, A&A, 365, L18
- Turner et al. (2001) Turner, M. J. L., et al. 2001, A&A, 365, L27
- Yakovlev et al. (2002) Yakovlev, D. G., Gnedin, O. Y., Kaminker, A.D., et al. 2002, (astro-ph/0306143)
- Zane et al. (2002) Zane, S., et al. 2002, MNRAS, 334, 345
- Zane & Turolla (2005) Zane, S., Turolla, R. 2005, Advances in Space Research, Vol. 35, Issue 6, p. 1162-1165, (astro-ph/0501094)
- Zavlin, Shibanov & Pavlov (1995) Zavlin, V. E., Shibanov, Yu., Pavlov, G. G. 1995, Astron. Letters, 21
- Zavlin et al. (1998) Zavlin, V. E., Pavlov, G. G., & Trümper, J. 1998, A&A, 331, 821
- Zavlin et al. (1999) Zavlin, V. E., Trümper, J., & Pavlov, G. G. 1999, ApJ, 525, 959
- Zavlin et al. (2002) Zavlin, V. E., Pavlov, G. G., Sanwal, D., Manchester, R. N., Trümper, J., Halpern, J. P., Becker, W. 2002, ApJ, 569, 894
| Model | |||||
|---|---|---|---|---|---|
| ( cm-2) | ( K) | (erg cm-2s-1) | |||
| PL | |||||
| BB | |||||
| BB+PL | |||||
| NSAa | |||||
| NSAb | |||||
| NSAb+PL |
Note. — Uncertainties are all at 90% confidence. Models used: “PL” indicates an absorbed power law with photon index ; “BB” indicates an absorbed blackbody emitting at a temperature ; “NSA” indicates an absorbed, magnetized, pure H atmospheric model with G and effective temperature , as measured at Earth (Pavlov et al., 1995). For the NSA model we fixed the neutron star mass at , and the radius at 10 km (NSAa) or 13 km (NSAb). The last column is the unabsorbed flux in the keV band.