XMM-Newton view of the ultra-luminous X-ray sources in M 51
Abstract
We present results based on XMM-Newton observation of the nearby spiral galaxy M 51 (NGC 5194 and NGC 5195). We confirm the presence of the seven known ULXs with luminosities exceeding the Eddington luminosity for a black hole, a low luminosity active galactic nucleus with luminosity of , and soft thermal extended emission from NGC 5194 detected with Chandra. In addition, we also detected a new ULX with luminosity . We have studied the spectral and temporal properties of the LLAGN and 8 ULXs in NGC 5194, and an ULX in NGC 5195. Two ULXs in NGC 5194 show evidence for short-term variability, and all but two ULXs vary on long time scales (over a baseline of ), providing strong evidence that these are accreting sources. One ULX in NGC 5194, source 69, shows possible periodic behavior in its X-ray flux. We derive a period of at a confidence level of , based on three cycles. This period is lower than the period of derived from a Chandra observation in 2000. The higher effective area of XMM-Newton enables us to identify multiple components in the spectra of ULXs. Most ULXs require at least two components – a power law and a soft X-ray excess component which is modeled by an optically thin plasma or multicolor disk blackbody (MCD). However, the soft excess emission, inferred from all ULXs except source 69, are unlikely to be physically associated with the ULXs as their strengths are comparable to that of the surrounding diffuse emission. The soft excess emission of source 69 is well described either by a two temperature mekal plasma or a single temperature mekal plasma () and an MCD (). The MCD component suggests a cooler accretion disks compared to that in Galactic X-ray binaries and consistent with that expected for intermediate mass black holes (IMBHs). An iron K line () or K absorption edge at is present in the EPIC PN spectrum of source 26. The spectrum of the ULX in NGC 5195, source 12, is consistent with a simple power law. The LLAGN in NGC 5194 shows an extremely flat hard X-ray power-law (), a narrow iron K line at (), and strong soft X-ray excess emission. The full band spectrum is well described by a two component mekal plasma and reflection from cold material such as putative torus.
Subject headings:
accretion, accretion disks — galaxies: active — galaxies: individual (M 51) — X-rays: binaries — X-rays: galaxies1. Introduction
X-ray emission from spiral galaxies consists of several components including an active nucleus (if present), extra-nuclear point X-ray sources, hot gas, supernova etc. Many spiral galaxies contain a mildly or non-active nucleus and, in this case, the luminosity in the X-ray band is dominated by the emission from a few luminous off-nuclear point sources (Roberts & Warwick 2000). The brightest of these X-ray sources, with luminosities exceeding the Eddington luminosity for a black hole, are defined as the ultra-luminous X-ray sources (ULXs). These objects, which may sometimes individually outshine the rest of the galaxy, were first discovered in Einstein observations (Fabbiano & Trincheri 1987; Fabbiano 1989). Later they were detected in large numbers by ROSAT (Colbert & Mushotzky 1999; Roberts & Warwick 2000; Colbert & Ptak 2002). The first detailed X-ray spectral characteristics of ULXs were revealed by ASCA and demonstrated that most ULXs exhibit multicolor disk blackbody spectra with a ‘high temperature’ similar to that observed from Galactic X-ray binaries in their high state. Some ULXs were also found to vary and make a transition, at lower luminosities, to power-law spectra, similar to the spectral transitions seen in many Galactic XRBs. However, the observed X-ray flux of many ULXs implies (assuming isotropic emission and Eddington-luminosity limited systems) black holes of . These masses are much larger than the measured masses of known Galactic X-ray binaries or black holes (GXRBs or GBHs) and much lower than the measured masses of active galactic nuclei, thus making them candidates for intermediate-mass black holes (IMBHs).
Several models have been proposed to explain the high luminosities of ULXs. These include () accreting IMBHs with sub-Eddington rates (e.g., Colbert & Mushotzky 1999), () XRBs with anisotropic emission (King et al. 2001), () beamed XRBs with relativistic jets directly pointing towards us i. e., scaled down versions of blazars (Mirabel & Rodriguez 1999), and () XRBs with super-Eddington accretion rates (Begelman 2002). A few ULXs have been found to be young supernova (e.g., SN 1979, Immler, Pietsch & Aschenbach 1998) with X-ray emission powered by the interactions of shock waves and the surrounding dense inter stellar medium. Some of the accretion-powered ULXs are also observed to be associated with older supernova remnant-like structures (e.g., IC 342-X1, Roberts et al. 2003). The recent observation of a break at a frequency of in the power density spectrum of the ULX NGC 4559 X-7 suggests a mass of a few thousands solar masses, consistent with the measured thermal temperature of . This observation clearly supports the IMBH scenario for ULXs. It has become increasingly clear that there are two separate populations of ULXs. A large number of ULXs are located in regions of current star formation in star-burst and spiral galaxies (The Antennae, Zezas et al. 2002; NGC 3256, Lira et al. 2002; NGC 4485/90, Roberts et al. 2002; Arp 299, Zezas, Ward, & Murray 2003; M 51, Terashima & Wilson 2004). These ULXs are likely to be associated with young stellar populations. Other ULXs have been observed in early-type elliptical/SO galaxies and are likely to be associated with older stellar populations. A recent study of the ULX population of 82 galaxies by Swartz et al. (2004) suggests that of these sources may be background objects, including in spiral galaxies and in elliptical galaxies.
Chandra has revolutionized the detection of ULXs primarily due to its superior angular resolution (see e. g., Swartz et al. 2004). XMM-Newton, on the other hand, has been probing the detailed characteristics of the ULX populations in nearby galaxies due to its large effective area. XMM-Newton is well suited to study detailed spectral and temporal characteristics of ULXs in nearby galaxies (e.g., Strohmayer & Mushotzky 2003; Cropper et al. 2003; Miller et al. 2004; Dewangan et al. 2004).
M 51, also known as the Whirlpool galaxy, is a face-on spiral galaxy and is located at a distance of 8.4 Mpc (Feldmeier et al. 1997). Optical studies of emission lines classified it as a LINER or a Seyfert 2 galaxy (Stauffer 1982). Furthermore, Ho et al. (1997) suggest the presence of a broad H line. Kohno et al. (1996) found a nuclear molecular disk, and constrained the dynamical mass within 70 pc of the nucleus to be . This indicates that M 51 hosts as massive a black hole as many AGNs.
X-ray observations also strongly suggest the presence of an AGN in M 51. Einstein (Palumbo et al. 1985) and ROSAT (Marston et al. 1995; Ehle et al. 1995) observations constrained the soft X-ray luminosity of the M 51 nucleus to be erg s-1. Ginga scanning observations in 1988 detected bright hard X-ray emission with luminosity of , a photon index of and an intrinsic absorption of cm-2 (Makishima et al. 1990). Such hard nuclear X-ray emission is often considered to be evidence for a low luminosity AGN (LLAGN). ASCA observed M 51 in the hard () X-ray band in 1993, and did not detect such a bright hard component. Instead, a faint hard X-ray continuum with a neutral Fe K line was detected, whose flux was an order of magnitude lower than that measured by Ginga (Terashima et al. 1998). The reason for this large difference in luminosity has recently been clarified by BeppoSAX observations. Fukazawa et al. (2001) find that the nucleus is photoelectrically absorbed below 10 keV but is observed directly above 20 keV, implying an absorbing column of . The 2-10 keV luminosity measured by BeppoSAX was similar to that of ASCA. Fukazawa et al. (2001) attributed the higher Ginga luminosity to variability of the absorbing column.
High angular resolution ROSAT HRI observations also revealed eight X-ray point sources and diffuse soft X-ray emission in M 51. Chandra observed M 51 during June 2000 and June 2001 with ACIS-S. These data have been studied in detail by Terashima & Wilson (2001, 2004). The X-ray image revealed the nucleus, 113 X-ray sources and extended emission which resembled the morphology of both the radio and optical emission line images (Terashima & Wilson 2001). The X-ray image of the nucleus is well represented by a model consisting of soft thermal plasma (), a very hard continuum and an Fe K emission line at 6.45 keV with an equivalent width of greater than 2 keV. The X-ray spectra of the extra-nuclear clouds are well fitted by a thermal plasma model with . The spectral shape and morphology strongly suggest that the clouds are shock-heated by a bipolar outflow from the nucleus. Out of 113 extra-nuclear sources, 9 sources have luminosities exceeding in the 0.5-8 keV band. The number of extra-nuclear sources in M 51 is much higher than in most other normal spiral and elliptical galaxies and is similar to galaxies experiencing star-burst activity. The X-ray spectra of most of the detected sources are consistent with a power-law spectral form with a photon index between 1 and 2, while one source has an extremely hard spectrum and two sources have particularly soft spectra. The X-ray spectra of three of the ULXs are consistent with both a power-law and multi-color blackbody model. One ULX showed a remarkable spectrum with prominent emission lines.
In this paper we present an XMM-Newton EPIC observation of M 51. Utilizing the large collecting area of XMM-Newton, we have studied spectral and temporal properties of nine ULXs and the LLAGN in M 51. The paper is organized as follows. In Sect. 2, we outline the observation and the data selection. In Sect. 3, 4, and 5, we present the spatial, temporal, spectral analysis. Sect. 6 describes properties of the individual ULXs. We discuss the results in Sect. 7, followed by conclusions in Sect. 8.
2. Observations and Data selection
The galaxy M 51 was observed by XMM-Newton observatory (Jansen et al., 2001) on 2003 January 15 for a duration of . The EPIC PN (Strüder et al., 2001) and MOS (Turner et al., 2001) cameras were operated in full-frame mode using the thin filter. The optical monitor (OM) instrument and the reflection grating spectrometers operated simultaneously with the EPIC cameras.
The raw PN and MOS events were processed and filtered using the most recent version of the calibration database and analysis software (SAS v6.0) available in March 2004. Examination of the background light curves extracted from source-free regions showed that our observations was not strongly affected by particle induced flares. Events in known bad pixels were discarded. For the spectral analysis, we used events with patterns 0–4 (single and double) and flag zero for the PN, and patterns 0–12 (similar to ASCA event grades 0–4) and flag zero for the MOS. However, for the temporal analysis, we used all events with pattern 0–12 for both the PN and MOS cameras.
3. Spatial analysis
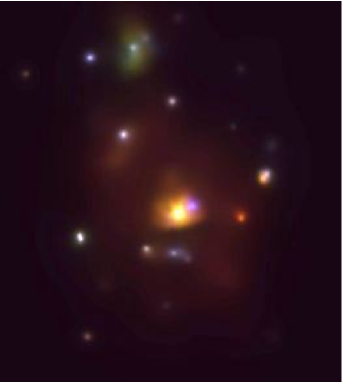
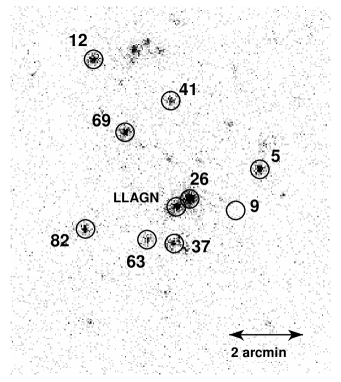
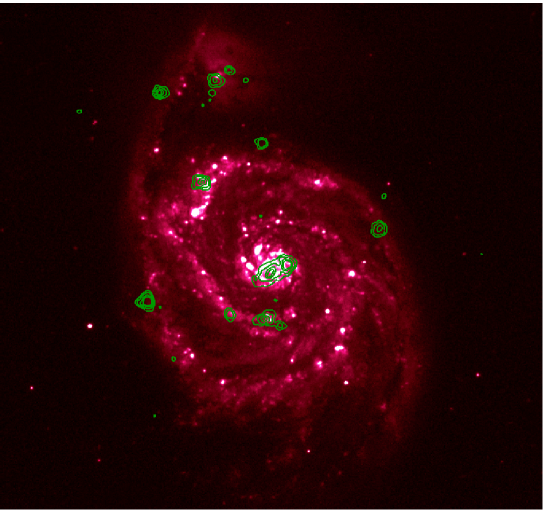
We extracted PN images in the full (), , , and bands. First we adaptively smoothed the full band image using the CIAO task csmooth and created a smoothing kernel. The images in the , and bands were then adaptively smoothed using the kernel created above, and combined to form a three-color image shown in Figure 1 (Left). The color image shows several discrete sources, diffuse soft emission, and the bright nucleus of NGC 5194. Interestingly, the bright nucleus of NGC 5194 actually consists of two hard X-ray sources apart (see below). Also present is the companion galaxy NGC 5195 showing diffuse emission, multiple sources in the central region, and a bright point source to the left of the nucleus. To avoid any possible confusion on multiple source identification numbers arising from multiple X-ray missions, we follow the Chandra source identification numbers as set by Terashima & Wilson (2004). Figure 1 (right) shows the EPIC PN image in the band and the positions of the ULXs studied in this paper have been marked. The ULX source 9 in NGC 5194 is not seen in the hard band image image due to its location in the chip gap and its extreme softness. The source counts and positions listed in Table 1 have been determined by a source detection procedure by utilizing a series of SAS tasks as described by Miyaji et al. (2003). In short, an input image is searched for point-like sources by a simple sliding-cell detection method with local background using eboxdetect. This is followed by a “background map” creation by a spline fit to the source-excluded region using esplinemap. A sliding cell detection is repeated to find excess over this background map (eboxdetect). The final source positions and counts are determined by a multi-source maximum-likelihood fit with the XMM-Newton PSF, using the sources detected in the previous step as the starting points (emldetect). In order to be free from the effects of soft diffuse emission, which could prevent the accurate determination of the background map, the hard-band (2-10 keV) image is used to obtain the source counts, except source 9, which has not been detected in the hard band. In Figure 2, we show the UV image of M 51 taken with the XMM-Newton OM. The image shows beautiful spiral arms, a prominent nucleus, and bright star clusters surrounding the nucleus with either a ring-like morphology or multiple inner spiral arms. One of the spiral arm of NGC 5194 appears to be tidally connected to the companion galaxy NGC 5195. This galaxy shows a bright nucleus with dark dust lanes near the nucleus.
In Fig. 2, we have overlaid the X-ray contours onto the UV image. The contours represent the hard () X-ray sources only. Fig. 2 highlights the two bright hard X-ray sources in the central region of NGC 5194. The two sources are separated by . The fainter of the two X-ray sources coincides with the UV nucleus. The brighter source is an ULX, which is clearly resolved in Chandra images (Terashima & Wilson 2004).
In this paper we study the active nucleus and the point sources with luminosities in the band. There are eight ULXs in addition to the LLAGN in NGC 5194. There is also a well isolated ULX in the companion galaxy NGC 5195. However, the central region of NGC 5195 consists of multiple bright point sources and extended soft emission as seen in the Chandra ACIS-S image (Terashima & Wilson 2004). Due to lower angular resolution of XMM-Newton, it is not possible to extract counts for individual sources in the central region of NGC 5195. Therefore we exclude the bright sources in the central region of NGC 5195 from our analysis. The Chandra source NGC 5194#63 had an X-ray luminosity during the two previous Chandra observations. In this observation this source has a luminosity of in the band and we now include this source in our sample.
4. Temporal analysis
4.1. Short-term variability
We extracted X-ray light curves for the LLAGN and ULXs in M 51 from the EPIC PN data. The extraction regions had radii in the range of and enclosed of the X-ray emission from each source. The smallest circular regions were chosen to avoid contamination from nearby sources. We used time bins of and required that the bins be at least exposed in order to minimize the errors due to the low number of counts from the weak sources. We also extracted individual background light curves for each of the sources using circular regions lying approximately at the same readout distance as that for the source. The source light curves were then corrected for the background contribution using the background light curves and appropriate scaling factors to take into account the different extraction areas.
We fit a constant count rate model to each of the light curves to investigate the possibility of rapid variability. We rebin the light curves, if required, to ensure a minimum of 20 counts per bin to allow the use of fitting statistics. The results for each light curve are listed in Table 2. We find that only two of the sources show significant variability: source 26 (at the confidence level) and source 69 ( confidence level). The light curves of these two sources are plotted in Figure 3.
4.2. Periodicity
Source 69 shows the most significant rapid variability. The light curve shows three tentative peaks at regular intervals. The first Chandra observation of this ULX in June 2000 showed two peaks separated by . These features were interpreted by Liu et al. (2002) as a signal with a period of . We have searched for a similar periodic signal in the XMM-Newton light curves. For this purpose, we combined the PN and MOS light curves, binned to . The initial search for periodicity in the source, as well as the folding of the light curve with respect to the final period obtained was performed with the XRONOS 5.19 package, which is a part of FTOOLS 5.2. The periodogram was obtained using the algorithm of Scargle (1982), following the recipe of normalizing the periodogram power using the total variance of the complete light curve as prescribed by Horne & Baliunas (1986). This algorithm is very robust for detecting periodic signals in light curves with few data points as well as non-uniformly distributed observational data, while providing a ‘false alarm probability’ of the periodicity arising in the light curve from random noise. This probability is obtained using the signal to noise ratio, where the variance of the noise is obtained under the basic assumption that it is a normally distributed random variable. The periodogram is shown in Figure 4 (left). The period obtained was s, with a ’false alarm probability’ of , suggesting that the observed modulation is not generated by the statistical fluctuation of the noise, to a confidence level of . The main source of the noise in the power in the Fourier frequency domain are the inherent statistical fluctuations at scales ks (Figure 4). We have tested for the periodicity on top of a constant count rate. However, in reality, the source probably has a red-noise power spectrum, similar to XRBs. Therefore, the or detection of the period is an upper limit, and the periodicity may or may not be a true signal. Future long baseline X-ray observations will be crucial for the robust detection of the periodicity from this ULX. In Figure 4 (right) we provide the light curve folded with respect to the period of 5925 s, with a bin size of . Evidently, the modulation fraction is in excess of , similar to the estimate of Liu et al. (2002).
4.3. Long-term Variability
We have compared the fluxes derived from the XMM-Newton observation (see below) and earlier two observations with Chandra (Terashima & Wilson 2004) in June 2000 and June 2001. Figure 5 shows the comparison of the fluxes. Cross-calibration results suggest that the fluxes measured with Chandra and XMM-Newton agree at a level better than (Snowden 2002). Thus, all the ULXs, except NGC 5194#41 and NGC 5195#12, show long-term significant variability over a baseline of .
5. Spectral Analysis
For each ULX and the LLAGN, we extracted source and background spectra from the final filtered PN event list using the same extraction regions that we used for the PN light curves. We also extracted the source spectra from the MOS data using source regions similar to that used for the PN. The background MOS spectra for the individual ULXs were extracted using circles in the nearby source-free regions. Appropriate PN and MOS responses and effective area files were created for each source using the SAS tasks rmfgen and arfgen. A grouping of 20 counts per spectral channel resulted in significant degradation in the spectral resolution of the ULX spectra above . Therefore, all the source spectra were grouped to a minimum of 10 counts per spectral channel so that discrete spectral features are not missed. The spectra were analyzed with the XSPEC 11.3 spectral analysis package (Arnaud 1996), and using the C-statistics instead of -statistic which is not useful in the case of low () counts per bin. Unlike the -statistic, the C-statistic does not provide a goodness-of-fit (GOF) criterion. Therefore we simulate 5000 spectra based on the best-fit model derived using the C-statistic, and calculate the percentage of these spectra with the C-statistic less than that for the data. This number provides the GOF, and if this number is , then the model is a good fit to the observed spectrum (similar to the reduced criterion), though obviously we cannot statistically exclude fits for which GOF. The confidence intervals are calculated in the same way as in the case of -statistic. All the errors quoted below were calculated at confidence level for one interesting parameter i.e., .
At first the MOS and PN spectra of a few bright sources were fitted separately to check for the possible uncertainties due to cross-calibration problems. We found generally good agreement between MOS and PN cameras in the bands. Therefore we present the spectral results obtained by fitting the same model jointly to the PN and MOS data while leaving the relative normalizations to vary.
5.1. The low luminosity AGN in NGC 5194
An absorbed power-law model is a poor fit to the PN and MOS spectra of the nucleus of NGC 5194 ( for 409 degrees of freedom (dof), GOF=). To show the significant spectral features, we fitted the absorbed power-law model in the and bands and plotted the ratio of the observed data in the band and the best-fit power-law in Figure 6. A strong soft X-ray excess below and a narrow iron K line at are evident in the spectrum. The X-ray image, shown in Fig. 1, clearly shows presence of extended emission which we interpret as originating from optically thin thermal plasma. Accordingly, we added a mekal component to describe the soft component and a Gaussian line model at . The fit improves significantly ( for 404 dof, ), however, the soft X-ray emission is not well described. There are still line-like residuals below , suggesting either the hot gas responsible for the soft excess emission has a temperature structure and/or its abundance ratio is non-solar. Including an additional mekal component (model 1) further improves the fit ( for 401 dof; ), and removes the soft residuals seen earlier. The best-fit temperatures are and , and the best-fit abundances, relative to solar, are and for the two mekal components. The observed data, the best-fit model and their ratio are plotted in Figure 7. We also tested the possibility of the non-solar abundance ratio by replacing the two mekal component by a vmekal component (model 2) which allows the abundance ratios of individual elements to vary. This model also improved the fit over that involving a single mekal component. The best-fit parameters for both models are listed in Table 3. Model 1 and 2 describe the data statistically equally well (, and for model 1 and 2, respectively). Both models result in an extremely flat hard X-ray slope (), and strong iron K line (EW ) from neutral material.
The flat spectrum and strong iron line strongly suggest that the hard X-ray emission from the LLAGN in NGC 5194 is dominated by reflection from a cold material. Previous BeppoSAX observations of M 51 showed the LLAGN is obviously Thomson thick (; Fukazawa et al. 2001). Therefore, we replaced the simple power-law model with the Compton reflection model pexrav (Magdziarz & Zdziarski 1995). This model calculates the reflected spectrum from a neutral disk exposed to an exponentially cutoff power-law spectrum. Since XMM-Newton does not cover the expected peak (20–40 keV) of the reflection component, it is not possible to tightly constrain all the parameters of the reflection model using this data alone. Instead, we fix the power-law photon index at , cutoff energy of the primary power law at 200 keV, disk inclination at 70 degrees and the abundance of heavy elements at relative to solar value. We also fixed the relative amount of reflection, , corresponding to an isotropic source above a reflecting plane. The only variable parameter of the pexriv model was the normalization of the incident power law. We chose a high inclination angle due to the Thomson-thick nature of the LLAGN. We also set the reflection model to produce the reflection component alone. This corresponds to a situation in which the primary X-ray emission is completely absorbed by a column density in excess of along the line of sight and we observe the X-ray emission scattered by the matter near the nucleus. We also include a narrow Gaussian line model to describe the Fe K emission. Fitting the above model (model 3) resulted in no strong apparent residuals. Model 3 consisting of two mekal components, Compton reflection, and a narrow Gaussian resulted in for 400 dof and . We consider this model to be the best-fit model as it is more physical than th earlier model involving simple power-law. The best-fit mekal temperatures are , . The iron line equivalent width is , similar to that measured from Chandra observations (Levenson et al. 2002). The best-fit parameters are listed in Table 3 (Model 3). The observed flux is in the band, and in the band, which correspond to luminosities in the band, and , respectively.
5.2. ULXs in M 51
We performed joint fits for the PN and MOS spectra of each ULX with the following spectral models: () a power law (PL), () multicolor accretion disk blackbody (MCD), () thermal plasma (mekal), () PL+MCD, () PL+mekal. The models also incorporate photoelectric absorption (wabs with a minimum value of , the Galactic absorption in the direction of M 51; Stark et al. 1992). We assume an abundance of relative to the solar in all the mekal components. The point spread function for the two sources 82 and 37 partially coincide with PN CCD chip gaps and/or bad pixel columns, prompting us to restrict ourselves to using only MOS data for the spectral analysis of these sources. One or more of the above models provided a reasonably good fit to all the ULXs except for sources 9, 26 and 69. The best-fit models and the unfolded X-ray spectra of these ULXs are shown in Figure 8. The best-fit parameters are listed in Table 4. We have also listed the observed flux and luminosity for the PN data in Table 4. The errors on flux were estimated at level based on 1000 sets of parameter values drawn from the distribution that is assumed to be multivariate Gaussian centered on the best-fit parameters with sigmas from the covariance matrix. The fluxes measured with PN and MOS cameras are within the errors quoted in Table 4. The mekal model alone does not provide a good fit to the spectra of all ULXs except source 12, therefore the best-fit parameters are not listed in Table 4.
X-ray spectra of sources 5, 37 and 41 in NGC 5194 are equally well described by a PL+MCD or a PL+mekal model, while source 63 prefers PL+mekal model. Two ULXs source 82 in NGC 5194 and source 12 in NGC 5195 only requires a single spectral component. Source 82 is described by a simple power law and does not statistically require any soft component at a level . Source 12 is well described either by a simple power law or a mekal model. In Table 4, we have listed the reduction in the C-statistic value () for additional parameters for the addition of a soft component (mekal, MCD or both, see below) to the simple power-law model. We have also listed the statistical significance derived from the maximum likelihood ratio (MLR) test. The criterian for selecting the more complex model is significance . As a caveat we note that the MLR test is statistically not robust in cases that involve testing a hypothesis that is on the boundary of the parameter space e.g., the null values of the normalizations of MCD, mekal and Gaussian lines occur in the simple power law model (Protassov et al. 2002). The results of the MLR test presented here should be treated only as indicative.
The spectra of sources 9, 26 and 69 are not satisfactorily described by any of the four models mentioned above. Source 9 is the softest ULX in our sample. Although not a good fit, the PL+MCD model is marginally better than the PL+mekal model for this ULX (see Table 4). Adding a mekal component to the PL+MCD model improves the fit ( for two additional parameters), and results in a good fit ( for 50 dof, ). Replacing the MCD component by another mekal component in the PL+MCD+mekal model slightly worsened the fit ( for 51 dof; ).
The ULX source 26 is located in the region of strong, extended soft X-ray emission. Its X-ray spectrum is not well described either by a simple power law or an optical thin plasma. Similar to the spectral modeling of the LLAGN, we used multiple mekal components to describe the soft emission. Two mekal components are statistically required to explain the soft X-ray excess emission. The addition of the second mekal component is significant at a level ( for two additional parameters). In Figure 9, we show the ratio of the EPIC data and the best-fit model consisting of two mekal components and an absorbed power-law. An iron K line at is clearly seen in the spectrum. The addition of a Gaussian line improves the fit ( for three additional parameters). The best-fit resulted in for 295 dof (). The observed EPIC data, the best-fit model and their ratio are plotted in Figure 10. The best-fit parameters are listed in Table 5.
The above fit clearly shows the presence of a Gaussian line. The best-fit line parameters are , , line flux and , consistent with an iron K line from neutral material. The LLAGN in NGC 5194, a Compton-thick AGN, also shows strong (; see also Levenson et al. 2002). The ULX NGC 5194#26 is separated by only from the LLAGN. The fractional encircled energy for the PN is at a redius of . The location of NGC 5194#26 within the wings of the point spread function and the very strong narrow iron line of LLAGN raise doubt if the iron K emission inferred from the ULX is simply cross-contamination from the LLAGN. To investigate this possibility, we extracted a background spectrum using circular regions with centers at the same distance from the LLAGN as that of NGC 5194#26. The radii of the two circles were chosen to be the same as that of the circular region used to extract the spectrum of NGC 5194#26. We used the PN data only and carried out the spectral analysis in the band. A simple absorbed power-law model provided for 77 dof and . Addition of a Gaussian line improved the fit ( for three additional parameter). The best-fit parameters are , , , , , . Replacing the Gaussian line with an accretion disk line (the diskline model in XSPEC) resulted in for 74 dof. The best-fit parameters are , disk inclination angle, , . The emissivity index, inner and outer radii were kept fixed at , and , respectively, where is the gravitational radius. The addition of the diskline to the simple power law model improved the fit at a significance level of . We also tested if the broad iron line-like feature could be described in terms of an absorption edge. Addition of an edge at to the absorbed power-law model improved the fit ( for 75 dof). The best-fit parameters are , , edge energy and . Thus the EPIC PN spectrum of source 26 is equally well described by an absorbed power law and a broad iron line at or an iron K-edge at . It is still possible that the background correction, we adopted here, may not be accurate due to poor signal-to-noise of the data, the presence of extended X-ray emission and moderate spatial resolution of XMM-Newton. Future long X-ray observations with Chandra and XMM-Newton will help detecting the line and/or edge unambiguously.
Source 69 is located in a region of extended soft X-ray emission in an spiral arm. It is likely that X-ray emission from source 69 is contaminated by the extended emission. Adding another mekal component to the PL+mekal model improved the fit significantly ( for two additional parameters; for 200 dof; ). The best-fit parameters are listed in Table 4. Replacing one of the mekal component by the MCD component slightly worsened the fit ( for dof, ). However, both the fits are acceptable. The spectral data and the best-fit model PL+mekal+mekal are plotted in Figure 8.
We compared the soft excess flux in the band, modeled as mekal component above a power-law, of ULXs with that of the diffuse emission in the surrounding regions. We estimated the flux of the diffuse emission from the count rates measured in annular regions centered at the source positions or nearby circular regions. We used the best-fit mekal temperature, estimated from the PL+mekal model for an ULX, to convert the appropriately scaled count rate of the nearby diffuse emission into the flux in the . For all ULXs except source 69, the nearby diffuse emission is comparable to the soft excess emission, suggesting that the soft excess emission may not be associated with these ULXs . The soft excess emission of source 69 () is about a factor of four stronger than the surrounding diffuse emission in the band. Thus, at least a part of the soft excess emission is intrinsic to the ULX.
5.2.1 The comptonized accretion disk model
The power law and the MCD model used to fit the ULX spectra above are only a mathematical approximation of the real physical spectra and do not provide much physical insight. Therefore, we also tried a spectral model based on ‘real’ physics of an accretion disk-corona system. This model called as the ‘comptonized accretion disk (CMCD)’ has been used to describe the spectra of six bright ULXs (Wang et al. 2004). The CMCD model was constructed by Yao et al. (2003). The model assumes a thermal energy distribution for electrons in a spherical corona around an accretion disk. The parameters of the CMCD model are the radius of the spherical corona (), electron temperature (), coronal optical depth (), the temperature of the inner accretion disk (), and disk inclination angle (). The model is implemented as a standard XSPEC table model (see Yao et al. 2003 and Wang et al. 2004 for more details).
We fitted the CMCD model to the spectra of all the ULXs. It was not possible to constrain the parameters for all but one ULX source 26, due to poor signal-to-noise and/or best-fit parameters outside the tabulated ranges. Due to the contamination of the extended soft X-ray emission, source 26 statistically required two mekal components in addition to an absorbed CMCD model. The addition of the first and second mekal components improved the fit by and , respectively, for three additional parameters in each case. The mekal temperatures are similar to that derived earlier using the combination of two mekal and a power law model. The best-fit parameters are listed in Table 5. For the best-fit CMCD model, the inner disk temperature is . The disk inclination angle is poorly constrained.
6. Individual ULX characteristics
In this section we describe the X-ray properties of individual ULXs.
6.1. NGC 5194 source 5
This source is located in the western outer spiral arm of NGC 5194, coincident with the ROSAT HRI source 4 (Ehle et al. 1995). Chandra resolved this source into two discrete sources NGC 5194#5 (CXOM51 J132939.5+471244) and NGC 5194#6 (CXOM51 J132940.0+471237). NGC 5194#5 is brighter than NGC 5194#6 by factors of and in the and bands, respectively (Terashima & Wilson 2004). Our XMM-Newton spectrum of this source requires a soft X-ray excess component that is equally well described either by an MCD or a mekal component. This soft excess component contributes to the total flux in the . Therefore, the detection of soft X-ray excess emission above the power-law component in the XMM-Newton spectrum could be due to the contamination of the softer NGC 5194#6 and the ULX spectrum is likely to be a simple power-law.
6.2. NGC 5194 source 9
This is the softest ULX in M 51 (see Fig. 1). This source is coincident to the ROSAT HRI source 5 (Ehle et al. 1995) and Chandra source NGC 5194#9 which was a super-soft source (Terashima & Wilson 2004). Chandra detected no photons above from NGC 5194 source 9 and its spectrum was well described by an MCD model with . XMM-Newton EPIC MOS detected this source at and levels above and , respectively. The MOS spectra of this source statistically require three components: a power-law (), an MCD (), and a mekal (). Alternatively, the MOS spectra can also be described by a power law () and two mekal components (, ). The X-ray flux of source 5 was a factor of higher during our XMM-Newton observation than that during the Chandra observations. The soft X-ray excess (MCD + mekal) flux is in the band which is similar to the total flux observed by Chandra in June 2001.
6.3. NGC 5194 source 26
This is the nearest ULX to the LLAGN in NGC 5194. It is located about west of the LLAGN and its soft X-ray emission is heavily contaminated by extended soft emission. This source was not detected in the ROSAT HRI possibly due to the extended soft X-ray emission. This ULX is brighter than the LLAGN in the band (see Fig. 2). Chandra also detected this source as the hardest ULX in M 51 (Terashima & Wilson 2004). In the two Chandra observations, this source showed interesting spectral behavior. The first Chandra observation revealed an absorbed power-law spectrum and emission lines at , , , and , most likely the K lines of Si, Ar, Ca, and Fe, respectively (Terashima & Wilson 2004). In the second Chandra observation, no emission lines were clearly detected although the source was brighter by . The XMM-Newton spectra of this source are well described by an absorbed power-law (, ) and two mekal components (, ). The absorbed power-law is consistent with that observed by the second Chandra observation. The two mekal components represent the contribution of the extended soft emission. We do not detect any emission lines except the iron line or an edge. Future deep X-ray observations will establish if the line is real. The EPIC PN spectrum of source 26, after appropriately correcting for the contribution of extended emission, requires either a moderately broad () iron line or a strong iron K edge at .
6.4. NGC 5194 source 37
This source is coincident with a southern spiral arm of NGC 5194 that displays extended UV emission (see Fig. 2). This source was not detected in the first Chandra observation but was detected in the second observation (Terashima & Wilson 2004). During our XMM-Newton observations, the ULX was brighter than during the second Chandra observation. The Chandra spectrum was described by a simple power law, while the XMM-Newton spectra statistically require a soft component that is equally well described by a mekal or an MCD component, in addition to a power law. The power law is flatter () than that derived from the Chandra data (). It is likely that this discrepancy is attributable to the different number of spectral components used to describe the Chandra and XMM-Newton spectra.
6.5. NGC 5194 source 41
This ULX is closer to the nucleus of NGC 5195 than to the nucleus of NGC 5194 but may be associated with the outer edge of an outermost spiral arm to the north of the nucleus of NGC 5194. This source was also detected in the ROSAT HRI (source 10 in Ehle et al. 1995). Chandra resolved this source into two sources NGC 5194#41 (CXOM51 J132953.7+471436) and NGC 5194#42 (CXOM51 J132953.8+471432). NGC 5194#41 is a factor of more luminous than NGC 5194#42. Remarkably, the XMM-Newton source is fainter by than the Chandra source NGC 5194#41 alone. Chandra spectra of this ULX are consistent with either a power-law or an MCD and no variability between the two observations. XMM-Newton spectra statistically require either an MCD () or a mekal () in addition to a power-law. Since the Chandra source NGC 5194#42 is an absorbed source, the thermal component inferred from the XMM-Newton data is likely a genuine component.
6.6. NGC 5194 source 63
This is faintest ULX in M 51 with a luminosity of . This source was fainter by a factor of in the band during the Chandra observations and was not considered to be a ULX. We consider this source to be a ULX at its increased flux. It is possible that the source is a stellar mass black hole accreting at or near the Eddington rate. The ULX is located to the south-east region coincident with a spiral arm, displaying extended UV emission. The X-ray spectrum of this source shows soft excess emission above a power law () and is statistically better described by a mekal plasma than an MCD. The presence of an extended UV source and optically thin thermal plasma both suggest that this ULX may be associated with a region of strong star-formation or unusually X-ray bright supernova remnant.
6.7. NGC 5194 source 69
This ULX is well known for the tentative detection of a periodicity in its X-ray flux (Liu et al. 2002). It is located in a region of extended soft X-ray emission and strong UV emission in an spiral arm to the north-east of the nucleus. The ULX is closer to the nucleus of NGC 5195 than to the nucleus of NGC 5194 but is clearly associated with NGC 5194. This source was detected in the ROSAT HRI (Ehle et al. 1995). The ULX showed drastic long term X-ray variability, its luminosity declining by a factor of from the first to the second Chandra observation. During our XMM-Newton observation, the ULX had brightened by a factor of in the band. Source 69 also shows variability on short-times scales. The first Chandra observation tentatively detected two peaks separated by . Liu et al. (2002) interpreted these features as a periodicity. The number of counts was too low to detect any such periodicity during the second Chandra observation. During a bright flux state during the XMM-Newton observation, the source again shows three possible peaks separated this time by . We detect a periodic signal at a significance level of with a period of from the EPIC light curves (see section 7.2.4 for further discussion). The XMM-Newton spectrum of this source is well described by either of the following three component models: () a power law () and two mekal components (, ); () a power law (), an MCD (), and a mekal ().
6.8. NGC 5194 source 82
This is the brightest ULX in M 51 with an observed luminosity of in the band. The ULX is coincident with an outer spiral arm east of the nucleus. This source was previously detected with Einstein HRI (Palumbo et al. 1985), ROSAT HRI (source 14 in Ehle et al. 1995), BeppoSAX (Fukazawa et al. 2001), and Chandra (Terashima & Wilson 2004). The source had dimmed in the second Chandra observation but was brighter by in the XMM-Newton observation, a level similar to that seen during the first Chandra observation. Both Chandra and XMM-Newton spectra of this ULX are consistent with an absorbed power law.
6.9. NGC 5195 source 12
This is the only ULX in NGC 5195 that is well separated from the nucleus. The ULX is away to east of the nucleus. The ULX was earlier detected with the ROSAT HRI (source 13 in Ehle et al. 1995). Source 12 is the only ULX in M 51 to have X-ray spectrum that is well described by a single spectral component either a simple power-law () or mekal plasma (). The ULX is not resolved spatially with Chandra. Modeling the spectrum as an optically thin plasma requires an unrealistically high temperature and, as a result, we prefer the non-thermal power-law interpretation despite the equally good spectral fits. The notable lack of an optical/UV counterpart for the source strongly suggests that this source is not a background AGN, particularly given its low intrinsic X-ray absorption ()
7. Discussion
We have performed the temporal and spectral analysis of the LLAGN and nine ULXs in M 51 using a XMM-Newton observation. Below we discuss the main results obtained.
7.1. The LLAGN of NGC 5194
The X-ray spectrum of the LLAGN is a typical of Thomson-thick Seyfert 2 galaxies, namely an extremely flat continuum, a strong and narrow line from neutral iron, and unabsorbed soft X-ray emission. Our spectral modeling shows that the flat continuum can be described as the reflection of the primary power-law () by cold and dense material, assuming the cold material subtends a solid angle to the central source, the luminosity of the primary continuum is then estimated to be in the band. This luminosity is about two orders of magnitude lower than that for Seyfert 1 galaxies, thus confirming the nucleus of NGC 5194 as an LLAGN as already established with previous BeppoSAX and optical observations. Since the LLAGN is nearly Thomson thick, the soft X-ray emission in the spectrum must be associated with the extended soft emission seen in Fig. 1.
7.2. ULXs in M 51
There are nine ultra-luminous X-ray sources in M 51 with the observed luminosity of in the band. Three ULXs, source 9, 41 and 63, with () may actually be stellar mass black holes (). The brightest ULX in M 51, source 82, has a luminosity of , lower than the Eddington luminosity () for a black hole. Thus, all ULXs in M 51 could plausibly be stellar mass black holes at around (or slightly above) the Eddington limit.
The larger collecting area of XMM-Newton compared to Chandra has enabled us to investigate the nature of ULXs in greater detail. While Chandra spectrum of individual ULXs in M 51 is well described by a single spectral component, XMM-Newton spectrum of most ULXs in NGC 5194 require at least two spectral components.
7.2.1 Cool accretion disks
X-ray spectra of two ULXs, sources 9 and 69, require soft components, modeled by either mekal plus MCD or two mekal components. The MCD components suggest inner disk temperatures of (source 9) and (source 69). These temperatures are lower than that found for ULXs studied with ASCA (Makishima et al. 2000) and Galactic X-ray binaries, but are similar to that found for ULXs studied with XMM-Newton (Miller et al. 2003; Miller, Fabian, & Miller 2004; Dewangan et al. 2004). The XMM-Newton observation of M 51 supports the increasing trend that ULXs have cooler accretion disks than GBH binaries. The temperature of the innermost regions of an accretion disk is given by
| (1) |
(see e.g., Makishima et al. 2000). Here is a spectral hardening factor. The factor takes into account the fact that the radius of maximum temperature is larger than the innermost stable orbit, and for a Schwarzschild geometry or for a Kerr geometry. Thus objects with lower MCD temperatures must have either higher black hole masses or lower accretion rates. Assuming a relative accretion rate of , equation 1 implies black hole masses of (source 9) and (source 69).
The results of the CMCD model fit to the spectrum of source 26 suggests that this ULX has cool accretion disk (). Using the normalization and the inclination angle of CMCD model, it is possible to derive a BH mass as detailed in Wang et al. (2004). Using this procedure, we derive a black hole mass of for the ULX sources 26.
7.2.2 ULXs with a power-law spectrum
The X-ray spectrum of two ULXs, source 82 and source 12, can be described by a simple power-law models with a photon indices of and , respectively. Source 12 does not show any signature of emission from an accretion disk. The power-law spectral form of this ULX is similar to that of XRBs in their low state (Terashoma & Wilson 2004) or type 1 AGNs (excluding the narrow-line Seyfert 1 galaxies). If the above analogy is correct, then the ULXs with simple power-law spectrum may imply very high mass ( a few times ) black hole. A power-law spectrum may also result from beamed X-ray emission. The X-ray spectrum of source 82 is very steep and may be similar to that of Galactic XRBs in their very high state (see Terashima & Wilson 2004 and Roberts et al. 2004 for a detailed discussion on the power-law spectral form of ULXs). It is also possible that ULXs with a simple power-law spectrum are background AGNs.
7.2.3 Spectral variability
It is not possible to compare directly the best-fit spectral form derived from the Chandra and XMM-Newton observations due to the different number of spectral components used to fit the spectra. Therefore, we compare the best-fit model derived from the Chandra, usually a single component model, and the corresponding single component model best-fit to the XMM-Newton data. The single component model is not necessarily the best-fit model to the XMM-Newton data. Figure 11 compares the spectral parameters illustrating the spectral variability of ULXs in M 51. The steeper spectrum of source 5 during the XMM-Newton observation may be due to the contribution of the soft source NGC 5194#6 detected with Chandra (see section 6.1). Source 9 shows a very soft X-ray spectrum and is consistent with no spectral shape variability. The detection of the power law component in addition to the soft component in the spectra of source 9 may be due to the larger collecting area of XMM-Newton particularly at higher energies. Sources 26, 37, 63 and 12 do not show significant variability in their spectral shape. Sources 41 and 82 show slightly steeper X-ray spectra compared with the earlier Chandra observation.
Source 69 continues to show drastic spectral and flux variability. The source was in a high/hard state (power law or MCD ) in June 2000 and subsequently made a transition to an extremely soft/low state (power law or MCD ) in June 2001 (Terashima & Wilson 2004). The ULX made another transition back to a state similar to its earlier high/hard state, in January 2003. The spectral transitions of source 69 are completely different from the high/soft to low/hard spectral transitions usually observed from Galactic XRBs but similar to those observed from some ULXs (The Antennae, Fabbiano et al. 2003; Holmberg II X-1, Dewangan et al. 2004; an ULX in NGC 7714, Soria & Motch 2004). The ULXs that show distinct spectral transitions may a comprise a distinct class of ULXs. The physics of these transitions is yet to be understood clearly.
7.2.4 Periodicity
Source 69 is the only ULX in M 51 that shows indications for a possible periodic variations in its X-ray flux. The periods detected from our XMM-Newton observation ( at a level) and the first Chandra observation () are significantly different. The two observations are separated by . The variation in period, if real, clearly argues against orbital periodicity, and suggests the presence of quasi-periodic oscillations. Liu et al. (2002) discussed the possibility that the observed periodicity is due to orbital variations and as noted by Liu et al. (2002), only low mass X-ray binaries (LMXBs) can have orbital periods as small as with high luminosities. In this case Liu et al. (2002) estimate the mass of the donor to be . The spectrum of source 69 derived from the first Chandra observation was found to be consistent with an absorbed multicolor disk model with inner disk temperature of and showed marginal improvement in the fit after including a single temperature blackbody component. Based on these results, Liu et al. (2002) do not rule out the possibility that source 69 is a neutron star. Our XMM-Newton spectra require three components - a power-law (), a mekal () and another mekal () or a cool accretion disk (). The stellar mass black hole systems and high luminosity neutron star binary systems, both have high disk temperatures (). The possible variation in the period, due to a QPO and the X-ray spectrum both are inconsistent with the LMXB picture. Moreover, source 69 resides in a region that is likely to be undergoing active star formation, making it likely that the ULX is a high mass X-ray binary (HMXB). The spectral transition of source 69 from a high-hard to low-soft state also is in disagreement with the behavior of most Galactic LMXBs (Terashima & Wilson 2004).
If we interpret the variation of the apparent periodicity as resulting from QPOs, then QPO frequency of is much lower than QPO observed with RXTE from the Galactic black hole candidate GRS 1915+105, which has a dynamically measured mass of (Morgan, Remillard & Grener 1997). The only ULX known to show QPO is M 82 X-1 (Strohmayer & Mushotzky 2003). Its QPO frequency of is also lower than that of GRS 1915+105 but much larger than the implied frequency for source 69. It is not necessary the case that QPO frequency scales with the mass of the black hole, only twin peak QPOs with a frequency ratio of 3:2 have been established to scale with black hole mass (McClintock & Remillard 2003). The micro-quasar GRS 1915+105 is known to show QPOs at kHz as well as mHz frequencies, the lowest frequency of QPO observed from GRS 1915+105 is (Morgan et al. 1997). Therefore it is not entirely unlikely the possibility of a QPO from source 69. Long observations are required to clarify the presence of periodicity or QPO in this ULX.
8. Conclusions
We have analyzed XMM-Newton EPIC observation of M 51 performed in January 2003. Our main findings are as follows:
-
•
We detected 9 ULXs, an LLAGN and extended soft thermal emission from M 51. One of the sources (source 63) is a new ULX, not identified earlier due to its previously faint flux levels.
-
•
All eight ULXs in NGC 5194 are located in or near spiral arms. Four ULXs are located in the regions of strong UV emission in the spiral arms, suggesting association of these ULXs with current star formation.
-
•
Two ULXs (sources 26 and 69) show evidence for short-term variability. Source 69 is the most rapidly variable ULX in M 51 and shows a possible period of . All the ULXs except NGC 5194#12, show long-term variability by a factors of few to several.
-
•
Most ULXs in M 51 show soft X-ray excess emission, above a hard power law, that is modeled by a mekal plasma and/or an MCD component. However the strength of the soft excess emission inferred from an ULX is comparable to the diffuse emission around individual ULXs excluding source 69. Thus the soft excess emission is unlikely to be physically associated with any of the ULXs except source 69. The soft excess emission from source 69 is about a factor four stronger than the surrounding diffuse emission and is likely intrinsic to the ULX.
-
•
There is an indication of either a moderately broad () iron K line or an iron K absorption edge both due to neutral iron in the spectrum of source 26.
-
•
The X-ray spectrum of LLAGN in NGC 5194 is extremely flat () and shows a strong (EW), narrow, iron line from neutral material. The X-ray emission from the LLAGN in NGC 5194 is dominated by reflection from cold material.
References
- Arnaud et al. (1985) Arnaud, K. A. et al. 1985, MNRAS, 217, 105
- Begelman (2002) Begelman, M. C. 2002, ApJ, 568, L97
- Colbert & Mushotzky (1999) Colbert, E. J. M. & Mushotzky, R. F. 1999, ApJ, 519, 89
- Colbert & Ptak (2002) Colbert, E. J. M. & Ptak, A. F. 2002, ApJS, 143, 25
- Cropper et al. (2004) Cropper, M., Soria, R., Mushotzky, R. F., Wu, K., Markwardt, C. B., & Pakull, M. 2004, MNRAS, 349, 39
- Deutsch et al. (2000) Deutsch, E.W., Margon, B. & Anderson, S.F. 2000, ApJ, 530, L31
- Dewangan, Miyaji, Griffiths, & Lehmann (2004) Dewangan, G. C., Miyaji, T., Griffiths, R. E., & Lehmann, I. 2004, ApJ, 608, L57
- Ehle, Pietsch, & Beck (1995) Ehle, M., Pietsch, W., & Beck, R. 1995, A&A, 295, 289
- Fabbiano & Trinchieri (1987) Fabbiano, G. & Trinchieri, G. 1987, ApJ, 315, 46
- Fabbiano (1989) Fabbiano, G. 1989, ARA&A, 27, 87.
- Fabbiano et al. (2003) Fabbiano, G., King, A. R., Zezas, A., Ponman, T. J., Rots, A., & Schweizer, F. 2003, ApJ, 591, 843
- Feldmeier, Ciardullo, & Jacoby (1997) Feldmeier, J. J., Ciardullo, R., & Jacoby, G. H. 1997, ApJ, 479, 231
- Filippenko & Sargent (1985) Filippenko, A. V. & Sargent, W. L. W. 1985, ApJS, 57, 503
- Fukazawa et al. (2001) Fukazawa, Y., Iyomoto, N., Kubota, A., Matsumoto, Y., & Makishima, K. 2001, A&A, 374, 73
- Ho, Filippenko, Sargent, & Peng (1997) Ho, L. C., Filippenko, A. V., Sargent, W. L. W., & Peng, C. Y. 1997, ApJS, 112, 391
- Horne & Baliunas (1986) Horne, J.H. & Baliunas, S.L. 1986, ApJ, 302, 757
- Immler, Pietsch, & Aschenbach (1998) Immler, S., Pietsch, W., & Aschenbach, B. 1998, A&A, 331, 601
- Jansen et al. (2001) Jansen, F. et al. 2001, A&A, 365, L1
- Jenkins et al. (2004) Jenkins, L. P., Roberts, T. P., Warwick, R. S., Kilgard, R. E., & Ward, M. J. 2004, MNRAS, 349, 404
- King et al. (2001) King, A. R., Davies, M. B., Ward, M. J., Fabbiano, G., & Elvis, M. 2001, ApJ, 552, L109
- Kohno et al. (1996) Kohno, K., Kawabe, R., Tosaki, T., & Okumura, S. K. 1996, ApJ, 461, L29
- Levenson et al. (2002) Levenson, N. A., Krolik, J. H., Życki, P. T., Heckman, T. M., Weaver, K. A., Awaki, H., & Terashima, Y. 2002, ApJ, 573, L81
- Lira et al. (2002) Lira, P., Ward, M., Zezas, A., Alonso-Herrero, A., & Ueno, S. 2002, MNRAS, 330, 259
- Liu et al. (2002) Liu, J., Bregman, J.N., Irwin, J. & Seitzer, P. 2002, ApJ, 581, L93
- Magdziarz & Zdziarski (1995) Magdziarz, P., & Zdziarski, A. A. 1995, MNRAS, 273, 837
- Morgan et al. (1997) Morgan, E. H., Remillard, R. A., & Greiner, J. 1997, ApJ, 482, 993
- Makishima et al. (1990) Makishima, K., Ohashi, T., Kondo, H., Palumbo, G. G. C., & Trinchieri, G. 1990, ApJ, 365, 159
- Makishima et al. (2000) Makishima, K., et al. 2000, ApJ, 535, 632
- Marston et al. (1995) Marston, A. P., Elmegreen, D., Elmegreen, B., Forman, W., Jones, C., & Flanagan, K. 1995, ApJ, 438, 663
- Miller et al. (2003) Miller, J. M., Fabbiano, G., Miller, M. C., & Fabian, A. C. 2003, ApJ, 585, L37
- Miller et al. (2004) Miller, J. M., Fabian, A. C., & Miller, M. C. 2004, ApJ, 607, 931
- Mirabel & Rodríguez (1999) Mirabel, I. F. & Rodríguez, L. F. 1999, ARA&A, 37, 409
- Miyaji et al. (2003) Miyaji, T., Griffiths, R. E., Lumb, D., Sarajedini, V., & Siddiqui, H. 2003, Astronomische Nachrichten, 324, 24
- Palumbo, Fabbiano, Trinchieri, & Fransson (1985) Palumbo, G. G. C., Fabbiano, G., Trinchieri, G., & Fransson, C. 1985, ApJ, 298, 259
- Protassov et al. (2002) Protassov, R., van Dyk, D. A., Connors, A., Kashyap, V. L., & Siemiginowska, A. 2002, ApJ, 571, 545
- Roberts et al. (2004) Roberts, T. P., Warwick, R. S., Ward, M. J., & Goad, M. R. 2004, MNRAS, 349, 1193
- Roberts et al. (2003) Roberts, T. P., Goad, M. R., Ward, M. J., & Warwick, R. S. 2003, MNRAS, 342, 709
- Roberts, Warwick, Ward, & Murray (2002) Roberts, T. P., Warwick, R. S., Ward, M. J., & Murray, S. S. 2002, MNRAS, 337, 677
- Roberts & Warwick (2000) Roberts, T.P. & Warwick, R.S. 2000, MNRAS, 315, 98
- Scargle (1982) Scargle, J.D. 1982, ApJ, 263, 835
- Stark et al. (1992) Stark, A. A., Gammie, C. F., Wilson, R. W., Bally, J., Linke, R. A., Heiles, C., & Hurwitz, M. 1992, ApJS, 79, 77
- Strohmayer & Mushotzky (2003) Strohmayer, T. E. & Mushotzky, R. F. 2003, ApJ, 586, L61
- Strüder et al. (2001) Strüder, L. et al. 2001, A&A, 365, L18
- Swartz, Ghosh, Tennant, & Wu (2004) Swartz, D. A., Ghosh, K. K., Tennant, A. F., & Wu, K. 2004, ArXiv Astrophysics e-prints, astro-ph/0405498
- Snowden (2002) Snowden, S. L., 2002, astro-ph//0203311.
- Soria & Motch (2004) Soria, R., & Motch, C. 2004, A&A, 422, 915
- Stauffer (1982) Stauffer, J. R. 1982, ApJ, 262, 66
- Terashima et al. (1998) Terashima, Y., Ptak, A., Fujimoto, R., Itoh, M., Kunieda, H., Makishima, K., & Serlemitsos, P. J. 1998, ApJ, 496, 210
- Terashima & Wilson (2001) Terashima, Y. & Wilson, A. S. 2001, ApJ, 560, 139
- Terashima & Wilson (2004) Terashima, Y. & Wilson, A. S. 2004, ApJ, 601, 735
- Turner et al. (2001) Turner, M. J. L. et al. 2001, A&A, 365, L27
- Wang et al. (2004) Wang, Q. D., Yao, Y., Fukui, W., Zhang, S. N., & Williams, R. 2004, ApJ, 609, 113
- Yao et al. (2005) Yao, Y., Zhang, S. N., Zhang, X., Feng, Y., & Robinson, C. R. 2005, ApJ, 619, 446
- Zezas, Fabbiano, Rots, & Murray (2002) Zezas, A., Fabbiano, G., Rots, A. H., & Murray, S. S. 2002, ApJ, 577, 710
- Zezas, Ward, & Murray (2003) Zezas, A., Ward, M. J., & Murray, S. S. 2003, ApJ, 594, L31


| Chandra | Host | XMM-Newton | RA (2000) | Decl. (2000) | count rate | ||
|---|---|---|---|---|---|---|---|
| id | galaxy | name | () | ||||
| XMMU | PN | MOS1 | MOS2 | ||||
| LLAGN | NGC 5194 | J132952.9+471140 | 13:29:52.87 | +47:11:40.09 | |||
| 5 | NGC 5194 | J132939.5+471241 | 13:29:39.55 | +47:12:41.09 | |||
| 9aaThese sources fall on the PN chip gaps. The coordinate was derived from the full band image. | NGC 5194 | J132943.4+471134 | 13:29:43.37 | +47:11:34.21 | – | ||
| 26 | NGC 5194 | J132950.7+471153 | 13:29:50.73 | +47:11:52.86 | |||
| 37aaThese sources fall on the PN chip gaps. The coordinate was derived from the full band image. | NGC 5194 | J132953.3+471040 | 13:29:53.26 | +47:10:40.23 | – | ||
| 41 | NGC 5194 | J132953.8+471433 | 13:29:53.77 | +47:14:33.01 | |||
| 63 | NGC 5194 | J132957.6+471047 | 13:29:57.56 | +47:10:46.62 | |||
| 69 | NGC 5194 | J133001.1+471342 | 13:30:01.090 | +47:13:41.47 | |||
| 82aaThese sources fall on the PN chip gaps. The coordinate was derived from the full band image. | NGC 5194 | J133007.4+471104 | 13:30:07.407 | +47:11:03.94 | – | ||
| 12 | NGC 5195 | J133006.1+471540 | 13:30:06.13 | +47:15:40.20 | |||
| statistic | |||
|---|---|---|---|
| Source | count rate | /dof | (var) |
| () | |||
| 5 | 29.29/36 | – | |
| 9 | 42.88/36 | – | |
| 26 | 57.28/36 | ||
| 37 | 41.66/36 | – | |
| 41 | 46.29/36 | – | |
| 63 | 30.77/36 | – | |
| 69 | |||
| 82 | 42.23/36 | – | |
| 12 | 38.19/36 | – | |
| Component | Parameter | model 1aa(f) indicates a fixed parameter. | model 2aa(f) indicates a fixed parameter. | model 3aa(f) indicates a fixed parameter. |
| absorption | (f) | (f) | (f) | |
| mekal | ||||
| Abundance (solar) | – | |||
| O | – | – | ||
| Ne | – | – | ||
| Mg | – | – | ||
| Si | – | – | ||
| S | – | – | ||
| Ar | – | – | ||
| Ca | – | – | ||
| Fe | – | – | ||
| Ni | – | – | ||
| ccIn units of , where is the angular size distance to the source (), is the electron density (), and is the hydrogen density (). | ||||
| mekal | – | |||
| Abundance | – | |||
| ccIn units of , where is the angular size distance to the source (), is the electron density (), and is the hydrogen density (). | – | |||
| Power law | – | |||
| norm | – | |||
| pexrav | – | – | ||
| – | – | |||
| () | – | – | ||
| norm | – | – | ||
| Gaussian | ||||
| () | ||||
| EW () | ||||
| Total | ||||
| Goodness of fit |
| ULX | ModelaaA= PL, B = MCD, C = PL+MCD, D = PL+mekal, E = PL+MCD+mekal, F=PL+mekal + mekal, G=mekal. | NHbbModel 1 is a combination of two mekal, a power-law, a narrow Gaussian multiplied the Galactic absorption model. Model 2 is the same as model 1 except that the two mekal components have been replaced by a vmekal component. Model 3 is the same as model 1 with the power-law replaced by a neutral reflection model pexrav. | ddObserved flux in units of and in the energy band of band. | eeObserved luminosity in units of and in the energy band of band. | GOF | ff is in comparison to the PL (model A). | MLR | ||||
|---|---|---|---|---|---|---|---|---|---|---|---|
| () | () | significance | |||||||||
| 5 | A | – | – | – | – | 234.6/206 | – | – | |||
| B | (f) | – | – | – | – | 400.5/207 | – | – | |||
| C | – | 213.3/204 | |||||||||
| D | (f) | – | 210.5/205 | ||||||||
| 9ccOnly MOS data were used for the spectral fitting. The source photons fall at the chip gap in the PN camera. | A | – | – | – | – | 113.7/54 | – | – | |||
| B | – | – | – | – | 110.7/54 | – | – | ||||
| C | – | 69.5/52 | |||||||||
| D | – | 72.9/53 | |||||||||
| E | 59.8/50 | ||||||||||
| F | (f) | – | , | 67.9/51 | |||||||
| 37ccOnly MOS data were used for the spectral fitting. The source photons fall at the chip gap in the PN camera. | A | (f) | – | – | – | – | 104.9/61 | – | – | ||
| B | (f) | – | – | – | – | 232.8/61 | – | – | |||
| C | – | 68.6/58 | |||||||||
| D | (f) | – | 65.2/59 | ||||||||
| 41 | A | (f) | – | – | – | – | 169.1/129 | – | – | ||
| B | (f) | – | – | – | – | 392.7/129 | – | – | |||
| C | – | 143.8/126 | |||||||||
| D | (f) | – | 146.6/127 | ||||||||
| 63 | A | – | – | – | – | 137.0/101 | – | – | |||
| B | (f) | – | – | – | – | 376.8/102 | – | – | |||
| C | – | 116.3/99 | |||||||||
| D | – | 105.1/100 | |||||||||
| 69 | A | (f) | – | – | – | – | 342.0/204 | – | – | ||
| B | (f) | – | – | – | – | 1091.3/204 | – | – | |||
| C | – | ||||||||||
| D | (f) | – | |||||||||
| E | 200.9/199 | ||||||||||
| F | (f) | – | , | 191.9/200 | |||||||
| 82ccOnly MOS data were used for the spectral fitting. The source photons fall at the chip gap in the PN camera. | A | – | – | – | – | ||||||
| B | (f) | – | – | – | – | – | – | ||||
| C | – | ||||||||||
| D | – | 93.7/98 | |||||||||
| 12 | A | – | – | 88.4/93 | – | – | |||||
| B | (f) | – | – | – | – | 121.5/98 | – | – | |||
| G | (f) | – | – | 87.7/94 | – | – |
| Component | Parameteraa(f) indicates a fixed parameter. | model 1bbTotal absorption column density. The Galactic column is . | model 2bbModel 1 is a combination of two mekal, a power-law, a narrow Gaussian multiplied by an absorption model. Model 2 is same as model 1 except that the power-law has been replaced with the comptonized MCD model. |
|---|---|---|---|
| mekal | |||
| abundance (solar) | |||
| ccIn units of , where is the angular size distance to the source (), is the electron density (), and is the hydrogen density (). | |||
| mekal | |||
| abundance (solar) | |||
| ccIn units of , where is the angular size distance to the source (), is the electron density (), and is the hydrogen density (). | |||
| absorption | () | ||
| power law | – | ||
| – | |||
| Gaussian | |||
| () | |||
| EW () | |||
| CMCD | () | – | |
| () | – | ||
| () | – | ||
| – | |||
| – | |||
| eeCMCD normalization, ). | – | ||
| Total | |||
| 278.5/295 | 275.0/291 | ||
| Goodness of fit |
.