The discovery of two new galaxy–galaxy lenses from the SDSS††thanks: Based upon observations obtained using the Magellan telescopes at the Las Campanas Observatory and the European Southern Observatory (programme IDs: 73.A-0503 and 74.A-0481), Chile.
Abstract
The gravitational lens configuration where a background galaxy is closely aligned with a foreground galaxy, can provide accurate measurement of the dark matter density profile in the foreground galaxy, free of dynamical assumptions. Currently only three such galaxy–galaxy lenses are known where the lensed source has a confirmed redshift and is reasonably bright at optical wavelengths, and therefore suitable for observations with the HST Advanced Camera for Surveys (ACS). Two of these were discovered by noting an anomalous emission line (from the source) in the spectrum of a massive early–type galaxy (the lens). To find further galaxy–galaxy lenses suitable for ACS imaging we have looked for anomalous emission lines in the luminous red galaxy (LRG) subsample of the SDSS DR3 spectroscopic database. Our search methodology has similarities to that applied by Bolton et al. (which has had recent success), but extends the upper redshift limit for lensed sources to . Here we report follow-up imaging and spectroscopic observations of two candidates, confirmed as gravitational lenses by the detection of multiple images in the line of [OII] 3726,3729. In the first system, J145957.1-005522.8, the lens at , consists of two LRGs. The anomalous emission line is confirmed as [OII] by the detection of the corresponding H line, providing a source redshift of . In the second system, J230946.3-003912.9, the lens is a single LRG at , and the source redshift is , confirmed by partially resolving the [OII] doublet.
keywords:
gravitational lensing – surveys – galaxies: fundamental parameters1 Introduction
The analysis of accurate rotation curves of low surface brightness galaxies (e.g. de Blok & Bosma, 2002) has sparked a debate on whether the data are consistent with the mass profiles predicted within the CDM cosmological paradigm. The matter is currently unresolved, and the arguments are centred on the accuracy of the CDM predictions at small radii (Navarro et al. 2004), and the influence of triaxiality on the gas dynamics (Hayashi et al. 2004). As a means of measuring masses of galaxies, strong gravitational lensing, where the source is multiply imaged, is free of the ambiguities of dynamical tracer methods, for example whether the system is axisymmetric, or in dynamical equilibrium. In the majority of cases of strong lensing by galaxies the source is a quasar, and unresolved. In such cases, lensing provides a very accurate measure of the total mass within the Einstein radius, but there are too few constraints to determine the lens mass profile. Rusin, Kochanek & Keeton (2003) analysed 22 multiply-imaged quasars, and showed how it is possible to obtain information on the mass profiles of galaxies from a statistical analysis, by postulating a relation between the mass and light distributions in the galaxies. Another successful approach, developed by Treu & Koopmans (2004, and references therein), is to combine lensing information (image positions) and kinematic information (the velocity dispersion radial profile). To some extent this overcomes the individual weaknesses of lensing studies (only a total mass is measured) and dynamical studies (too many assumptions), for measuring galaxy mass profiles.
Only a few cases of multiple imaging of galaxies by galaxies are known, but they offer the prospect of accurate measurement of galaxy mass profiles free of dynamical assumptions. For quasars, the image fluxes do not provide useful constraints on mass models, because of the possibility they are brightened by microlensing. But for a resolved source, viewed through a dust-free galaxy, every resolution element in the image provides both a flux and a positional constraint. Therefore the best constraints come from high-resolution images of Einstein rings, since this maximises the number of resolution elements. Optimal inversion of the image requires a method which solves simultaneously for the source light profile and the lens mass profile (e.g. Wallington, Kochanek & Narayan, 1996, Warren & Dye, 2003). Dye & Warren (2005) analysed the HST image of the Einstein ring . They used a two-component mass model, comprising a dark-matter halo, and a baryonic component following the light, and thereby measured the inner slope of the dark matter mass profile ( confidence). They obtained substantially stronger limits than the lensing and dynamics analysis of the same system by Koopmans & Treu (2003), which used only the positions of the four bright peaks in the image as lensing constraints. They also obtained constraints on the dark matter fraction within the Einstein radius from this single system, as good as the constraints obtained by Rusin et al. (2003) from their analysis of 22 multiply-imaged quasars, with fewer assumptions. This highlights the usefulness of galaxy–galaxy lenses. The analysis also provided the first measurement, free of dynamical assumptions, of the baryonic mass-to-light ratio (M/L) in an individual galaxy.
Einstein rings were discovered at radio wavelengths (Hewitt et al. 1987), and a handful of other radio rings are now known. In this paper we are concerned with finding additional suitable galaxy-galaxy lens targets at optical wavelengths for imaging with the HST Advanced Camera for Surveys (ACS), in order to measure accurate mass profiles. The three best lenses for this type of work so far published, where the ring is substantially complete and reasonably bright at optical wavelengths, are (Warren et al. 1996, 1998), SDSS J (Bolton et al. 2005), and FOR J (Cabanac et al., 2005). The first two have been observed by HST, although the images are of relatively low signal-to-noise ratio (S/N). It would be feasible to obtain high S/N images of all three targets with ACS, with just a few orbits, and substantially improve on the results of Dye & Warren. We have excluded here rings where the source is an AGN (the best example is RXS J, Sluse et al. 2003), because again the fluxes in the bright images of the nucleus may be affected by microlensing, and contaminate large sections of the ring. A number of other galaxy-galaxy lenses are known, which are fainter and less extended than the best three, and therefore less useful (e.g. Ratnatunga et al. 1999, Crampton et al. 2002, Fassnacht et al. 2004).
The lens was discovered serendipitously, by noting an anomalous emission line in the spectrum of an early-type galaxy at . The emission line proved to be Ly from a background galaxy at , shown to be lensed into a partial ring in a narrow-band image centred on the line. A targetted search of the spectra of massive galaxies in large galaxy redshift surveys could prove an efficient method for discovering further examples (Hewett et al. 2000). The spectroscopic catalogue of the Sloan Digital Sky Survey (SDSS, York et al. 2000) is the best current dataset for this task by virtue of its size, depth, wavelength coverage, and resolution, and especially because the relatively large fibre angular diameter of is larger than the Einstein ring for all but the most massive galaxies.111For example, for a singular isothermal sphere at , of one–dimensional velocity dispersion km s-1, the angular diameter of the Einstein ring is 15 and 22 for source redshifts of and respectively. This ensures that in all cases where the source is multiply imaged, nearly all the flux will be captured by the fibre. Each galaxy in the survey, then, acts as a lens magnifying objects behind, by an amount that depends on the lens mass, the degree of alignment, and the source and lens redshifts. The luminous red galaxy (LRG) subsample (Eisenstein et al. 2001) is particularly useful since these sources dominate the cross section for strong lensing. Motivated by these arguments Bolton et al. (2004, hereafter B04) searched the spectra of some 51,000 SDSS LRG spectra for anomalous emission lines superposed on the early-type galaxy spectra. They provide a sample of 49 candidate lenses, with source redshifts confirmed by the detection of at least three lines. The Einstein ring J is the first confirmed success from this programme.
With the same motivation we have searched the spectra of LRGs in the SDSS DR3 spectroscopic catalogue (Abazajian et al. 2005), to find galaxy-galaxy lenses. This paper presents the first two confirmed lenses from our sample of candidates. Our survey is similar in many respects to that of B04, but with some significant differences. In §2 we briefly describe the steps followed to produce a sample of candidate lenses, highlighting differences compared to B04. In §3 and §4 we describe imaging and spectroscopic observations of two candidates, confirming that the emission lines are indeed from multiply-imaged background galaxies. These observations are adequate for confirming the nature of the candidates, but insufficient for a useful analysis of the galaxy mass profiles, which we postpone until completion of scheduled ACS observations.
When presenting calculations that involve angular diameter distances, we assume a Friedmann–Robertson–Walker cosmological model defined by the parameters , and km s-1 Mpc-1.
2 Spectroscopic identification of candidate gravitational lenses
We have completed a search for anomalous emission lines in the spectra of the LRG subsample of the SDSS DR3. Details of the sample searched, the line-detection algorithm, and the resulting list of candidates will be reported elsewhere. The line-detection algorithm is similar to that of B04. Here we outline the main differences.
The first difference between our analysis and that of B04 is the pre-processing of the SDSS spectra using the algorithm of Wild & Hewett (2005), to reduce systematic sky-line residuals. Large systematic residuals arise at the wavelengths of the brightest OH sky lines due to insufficient sampling of the line profiles, the exact pattern depending on the wavelength solution for each spectrum. To deal with this issue B04 modeled the distribution of residuals at each wavelength, and rescaled the Poisson error distribution, to avoid detecting sky residuals as false emission lines. Instead Wild & Hewett (2005) have developed a scheme to reduce the systematic residuals significantly. From the large database of spectra from fibres devoted to sky, the different patterns of residuals can be characterised and quantified using principal component analysis (PCA), and accordingly removed from the target spectra. The noise characteristics of the resulting spectra approach the Poisson expectation. The result of employing the Wild & Hewett sky-subtraction procedure is to improve substantially the sensitivity of line detection at wavelengths Å.
To search for anomalous emission lines B04 firstly create a residual spectrum by subtracting the combination of a best-fit early-type galaxy spectrum plus a smooth continuum. The early-type spectrum is computed as the best-fit redshifted linear combination of PCA components determined from the sample of restframe LRG spectra. By virtue of the well-defined colour selection used in defining the LRG sample, the continuum emission from any lensed source will be weak relative to the target LRG. Therefore the resulting spectra to be searched contain essentially only emission lines, with any residuals from absorption lines in the background galaxy well below the noise level (Figs 1 and 3 in B04). Instead we have used the simpler scheme of subtracting a median-filtered version of the spectrum, with a box length of 41 pixels, corresponding to Å over the wavelengths of interest. We have found that the PCA scheme, and related schemes, produce slightly better results in the region of the 4000Å break, but given the small region affected, and the fact that we are interested only in detections of relatively high S/N, we prefer the simplicity of the median-filter scheme.
Emission line identification is then performed on the resulting spectra using standard matched-filter techniques (e.g. Hewett et al. 1985). In contrast to B04 who require at least three emission lines of concordant redshift, we include candidates with single lines, or concordant pairs. BO4’s approach essentially ensures that all their candidates are real, in the sense of detecting a second galaxy at higher redshift than the LRG – which may or may not be multiply imaged. But it limits the highest redshift to , when [OIII] 4960, 5008 becomes redshifted beyond the red wavelength limit of the spectra of Å.
Targetting single emission line detections, which in most cases would correspond to the detection of [OII] 3728 emission at redshifts , might seem an optimistic approach. However, as B04 discuss, the SDSS spectra have sufficient resolution that the [OII] 3726.1,3728.8 doublet is partially resolved, producing a distinctive emission line profile. For the identification of genuine lenses, the extension of the search beyond is advantageous because the number of unlensed emission line galaxies that are bright enough to be detected in the spectra is very small, i.e. if a emission line galaxy is detected, then the probability it is lensed is high222The faintest detectable [OII] 3726,3729 emission lines in the LRG spectra at have fluxes of while the median emission line flux for the candidate emission lines is . Typically, as a result both of seeing and the angular offset between the LRG and an emission line source, the fraction of the total emission line flux from a star-forming galaxy contained within the SDSS spectroscopic fibre is , increasing the estimate of the true emission line fluxes by a factor of . The total area of the survey for emission line objects is equal to the number of galaxies surveyed multiplied by the effective area of each fibre (for the detection of an emission line object). Adopting an effective area of square arcseconds per fibre and a detection efficiency of gives an effective survey area of square degrees for sources with intrinsic emission line fluxes of . An estimate of the number of unlensed emission line objects predicted to occur in the LRG spectra can be made using the results of the Hubble Space Telescope survey for emission line galaxies of Drozdovsky et al. (2005). In an effective area of square degrees, very similar to our survey, they identify seven and one object(s) in the redshift range with fluxes exceeding and respectively. Thus, based on the Drozdovsky et al. findings, the predicted number of unlensed emission line sources at in our sample is small.. In principle, the search for single emission lines also allows gravitationally-lensed star-forming galaxies with very high redshifts, , to be detected via their Lyman- 1216 emission. In practice, there appear to be few such viable candidates in the SDSS DR3 spectroscopic database. Application of our spectroscopic search technique to 81,610 LRGs selected from the SDSS DR3 produces high S/N candidate [OII] emission-line systems. As of May 2005 we have succeeded in obtaining follow-up imaging (3 candidates) and spectroscopic (2 candidates) observations to identify cases of multiple imaging. Here we present observations of J145957.1-005522.8 and J230946.3-003912.9, confirmed as gravitational lenses. For compactness, in the remainder of the paper we refer to the two targets as J1459 and J2309 respectively. Both candidates were selected on the basis of the detection of a single emission line, which, if confirmed as the [OII] 3726.1,3728.8 doublet, provides redshifts of for J1459, and for J2309.
3 Follow–up imaging
The most direct way to confirm that candidates are lenses would be to image in the line, by means of observations with an Integral Field Unit, to confirm the reality of the line, and prove that multiple images of the source exist. An alternative approach is to combine imaging and spectroscopy. With limited observing time, broadband imaging on its own may produce ambiguous results, given the scale of the structures, typical seeing conditions, and the flux ratios between different copies of the source. The SDSS images themselves are inadequate because of the mediocre seeing (14 and 17 for J1459 and J2309 respectively) and limited depth. Longslit spectroscopy on its own may also be ineffective since there is no guide to choosing the slit orientation to capture two copies of the source. Our strategy has been to obtain images of substantially better resolution and depth than the original data. Failing unambiguous confirmation of lensing from the imaging data, where the data are suggestive of lensing the images provide a guide to orienting the slit for spectroscopic confirmation.
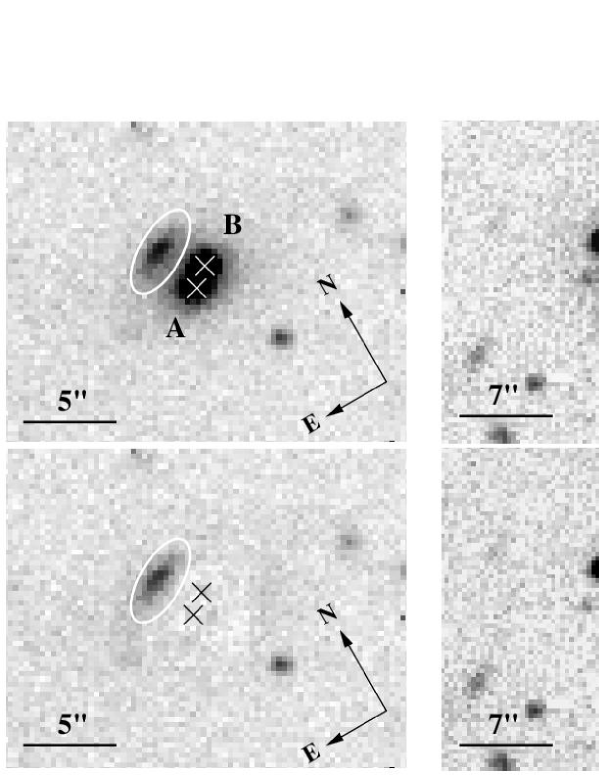
The system J1459 was observed with the MagIC CCD camera at the 6.5m Clay Telescope on 2003 May 30, in the band, for 600s, in 06 seeing, in clear conditions. The system J2309 was observed with the EMMI instrument at the 3.5m ESO NTT on 2004 October 10, in the band, for 300s, in 10 seeing, in clear conditions. The data were processed employing standard CCD reduction techniques and the resulting images are displayed in Fig. 1. The data were calibrated using the SDSS photometry of objects detected in the frames, neglecting any colour term. A zero-point offset applied and all subsequent photometric measures are quoted in Gunn using the AB magnitude scale333Equivalent Vega magnitudes can be obtained by subtracting 0.15 from the AB photometry.. The limiting sky noise computed within a 3″ diameter aperture is and 23.9 for the images of J1459 and J2309 respectively.
To subtract the images of the lensing galaxies we used an iterative procedure as follows (see e.g. Wayth et al. 2005, for a more detailed description of the procedure). We firstly ignored the contribution to the image of the lensed source, and fit de Vaucouleurs models, convolved with the point spread function (defined by stars in the frame), finding the min- 6-parameter model (x, y, orientation, ellipticity, half-light radius , and surface brightness at ). This model was subtracted, enhancing the image of the source. Regions covered by the source were masked, and an improved model computed, etc. In the case of J2309 the final fit was unsatisfactory near the centre, so we added the extra parameter required by the Sersic model, and repeated the procedure. In the case of J1459 the image shows two lens galaxies, separated by , so a different procedure was needed. The two galaxies are labeled A and B, in Fig. 1. Rather than attempt to model both galaxies simultaneously (i.e. a 12-parameter fit, for the de Vaucouleurs model), we proceeded by firstly fitting only the central region of the first galaxy, subtracting the model in this region, and then fitting the central region of the second galaxy. This second model was subtracted from the original image, allowing an improved fit for the first galaxy, over a slightly larger region. This process was iterated, slowly growing the region of the fits, while also improving the mask of the image of the source. For both galaxies, the subtractions are visually satisfactory, and therefore sufficient for examining the source morphology, but formally, in terms of , the fits are unsatisfactory.
Inspection of the image of J1459 reveals an extended arc NNE of the galaxy pair, offset some from the point midway between the two galaxies, and aligned tangentially relative to this point. At the depth of the image no counterimage is visible, but the tangential orientation of the arc is strongly suggestive of lensing, so we flagged the target as high priority for spectroscopy.
The image of J2309 displays a source W of the target. A possible faint counterimage is visible E of the target. The reality of the counterimage is difficult to quantify because of the possibility of systematic errors in the galaxy subtraction. Nevertheless the configuration is again strongly suggestive of lensing, and the target was similarly flagged as high priority for spectroscopy.
Relevant parameters from the profile fits for the three galaxies are provided in Table 1. For each galaxy the following four parameters of the fit are listed: the half-light radius , the surface brightness at the half-light radius , the exponent of the Sersic profile (i.e. de Vaucouleurs is ), and the total magnitude, computed by integrating the model profile. The uncertainties were computed from Poisson considerations. Nevertheless changing the size of the fitted region sometimes produced larger changes in parameters. We defer more sophisticated modelling of the light profiles until completion of the ACS observations. Also listed are the lens redshift, from the SDSS catalogue, and the source redshift, taken from §4. The final row provides the one dimensional velocity dispersion measured by SDSS for J2309. A value is not quoted for J1459, conceivably because the algorithm was confused in analysing the superposition of two LRG spectra.
| J1459 | J2309 | ||
| A | B | ||
| (arcsec) | 2.4 | 1.6 | 2.8 |
| ( mag/arcsec2) | 25.7 | 25.1 | 23.6 |
| (4) | (4) | 4.9 | |
| (AB) | 20.5 | 20.7 | 17.8 |
| 0.577 | 0.291 | ||
| 0.938 | 1.005 | ||
| (kms-1) | … | … | |
Magnitudes for the putative primary source image in each system were computed within 3″ (J1459) and a 2″(J2309) diameter circular apertures centred on the source in the LRG–subtracted image – generating –band magnitudes of for J1459 and for J2309. The presence of a nearby, unrelated, source in J2309 necessitating the use of the smaller aperture.
4 Long–slit spectroscopy
To confirm that the source in each system is multiply imaged, we obtained spectra with the slit oriented from the centre of the lens to the candidate primary image of the source. For J1459 the lens centre was defined as the flux-weighted centroid of the two galaxies. The goal of the observations was to detect the emission line on either side of the LRG.
The systems J1459 and J2309 were observed with the RILD configuration of the EMMI instrument at the ESO NTT on 2004 June 6, and October 10 respectively, in clear conditions. The 600 lines mm-1 grism with a slit provided spectral coverage from 5800 to 8500Å at a resolving power . The spatial scale was 033 pix-1. The slit orientations, the exposure times, and the average seeing during the observations, are provided in Table 2. Conventional procedures were followed for bias subtraction and flatfielding. Then the frames for each target were averaged, employing a sigma–clipping algorithm in order to remove cosmic ray events.
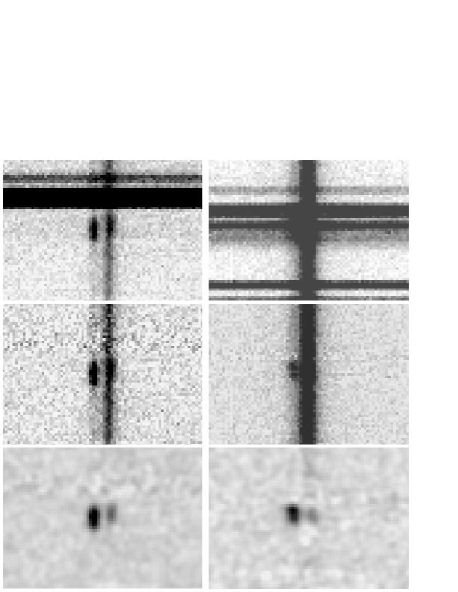
Small sections of each of the final frames, at various stages of subsequent processing, are shown in Fig. 2. In this figure the left column of panels shows J1459, and the right column shows J2309. The top row shows the spectra before sky subtraction, and the middle row shows the spectra after sky subtraction. The bottom row is explained below. Referring to the middle row, the dark vertical line in each panel is the spectrum of the LRG(s). For both targets an emission line, spatially offset from the LRG, is clearly visible, confirming the original detection of an emission line in the SDSS spectrum. In the case of J2309 the line is visibly double peaked, and the wavelength separation confirms the identification as the [OII] 3726.1,3728.8 doublet at . In the case of J1459 the line is spectrally resolved, and, although not clearly double peaked, the profile is suggestive of the [OII] doublet at . As described below, detection of the corresponding H line confirms this identification. The source redshifts have been entered into Table 1.
To subtract the spectrum of the lens galaxy in each system, in order to search for a counterimage of the emission line, we fit a cubic spline, with a small number of pieces, up each column. This is satisfactory because there are no strong absorption lines in the LRGs at the wavelengths of the emission lines. The resulting spectra, smoothed by convolution with a Gaussian, are reproduced in the bottom row of Fig. 2. An emission line on the opposite side of the LRG, and at the same wavelength as the line from the primary image, and therefore corresponding to a secondary image of the source, is visible in both panels. The significance of the detection is for J1459, and for J2309, established through measurement of the unsmoothed frames. These detections, corroborated by the measured source redshifts , confirm that we have identified galaxies that are multiply imaged, and that both systems are gravitational lenses. The spatial separations of the two images of the [OII] 3728 lines of each source, relative to the LRG, as well as the flux ratios of the primary and secondary images, were measured in the unsmoothed continuum-subtracted frames. The results are summarised in Table 2.
For each confirmed lens system, the location of the lensed emission-line images about the LRG deflector in the two-dimensional spectral frame imply that the total magnification is low: inputting the deflector–image separations, source and deflector redshift for each system into an assumed singular isothermal spherical (SIS) mass model generates total magnification factors 2.8 (J1459) and 4.0 (J2309) for each lens system. Low magnification values for the secondary images (0.4 and 1.0 for J1459 and J2309 respectively) provide some explanation for the lack of detection in the -band image, Fig. 1. The predicted flux ration for J1459 compares to the value of 2.6 measured from the long–slit spectrum. This discrepancy is not thought to be serious as the primary lens image is extended and slit losses will reduce the measured flux ratio. We note however, that computation of lens properties based upon the assumption of a simple mass model must be treated with some caution: the SIS mass model predicts an Einstein ring diameter of for the geometry of the J2309 system. The observed image separation in the spectrum, is consistent with this estimate, but this comparison is not particularly illuminating given the large uncertainties.
| J1459 | J2309 | |
|---|---|---|
| Slit position angle (∘EofN) | 26.1 | 90.0 |
| Exposure time (s) | ||
| Average seeing (″) | 0.8 | 1.1 |
| Image separation (″) | ||
| (″) | ||
| (″) | ||
| Flux ratio A/B |
The spectra of the LRG and both the primary and secondary images of the emission line galaxy overlap. To separate and extract the spectra of the lens and source, for each system, we used the following simplified scheme. We firstly fixed the relative locations of the lens and the two images of the source, in each system, at the values listed in Table 2. We then defined the normalised cross-sectional profile for the source and lens separately. The source cross-section was defined by fitting a Gaussian to the spatial profile of the primary image of the [OII] 3728 line, and using the same profile for the secondary image of the source, with the flux ratio fixed at the value measured for the emission line. The profile of the lens was defined by fitting a Gaussian to the peak of the cross-section, over a wavelength range separate from the [OII] 3728 line. The problem of spectral extraction then reduces to the problem of a min- fit at each wavelength, with three free parameters: the position of the lens, and the normalisations of the lens and source profiles (which provide the fluxes). Corresponding variance spectra were computed from Poisson considerations.
The above procedure represents a relatively robust approach to the problem of spectral extraction for blended, moderate S/N data. Inspection of the residual frame generated by subtracting the min- fit reveals coherent residual light at the level typically equal to or lower than the errors. These features arise from the fact that the adopted Gaussian spatial profile does not provide an exact match to the LRG in each system (the brightest spectral component). However, it is not anticipated that further detailed modelling of the LRG light distribution will result in substantive changes to the resulting spectra.
The extracted flux-calibrated spectra, on a linear wavelength scale, are displayed in Figs 3 and 4. We detect the corresponding H emission line in the spectrum of J1459, at significance, which confirms our original identification of the line detected in the SDSS spectrum as [OII] 3728 at . The H emission line for J2309 is not detected in the SDSS DR3 survey spectrum above the nominal flux limit of ergs s-1 cm-2 and it lies outwith the accessible wavelength interval for the NTT/EMMI follow-up spectrum. The unreddened [OII] 3728 emission-line fluxes observed in the SDSS DR3 spectra are ergs s-1 cm-2 (J1459) and ergs s-1 cm-2 (J2309). These fluxes are lower limits due to unknown signal losses arising from the limited spectroscopic fibre field of view. Employing the total magnification factors computed for each system, the corresponding unlensed [OII] 3728 emission luminosity for each system is ergs s-1 (J1459) and ergs s-1 (J2309). Employing the conversion between [OII] 3728 emission luminosity and star formation rate (SFR) presented by Kewley et al. (2004), the intrinsic SFR detected in each lensed source is approximately 1.4 (J1459) and 0.8 (J2309) M⊙ yr-1.


In summary, imaging and spectroscopic observations of two candidate gravitational lenses, selected through the detection of anomalous emission lines in the spectra of SDSS LRGs, have resulted in the confirmation of two new galaxy–galaxy lenses. The new lenses are suitably bright for HST imaging. Only three similarly bright galaxy–galaxy lenses were previously known. ACS observations can provide accurate measurement of the dark matter density profile in the lens galaxy in such systems, free of dynamical assumptions. Many more similarly–good candidate systems exist in the SDSS database, providing the basis for detailed statistical studies of galaxy dark matter profiles.
acknowledgements
Funding for the Sloan Digital Sky Survey (SDSS) has been provided by the Alfred P. Sloan Foundation, the Participating Institutions, the National Aeronautics and Space Administration, the National Science Foundation, the U.S. Department of Energy, the Japanese Monbukagakusho, and the Max Planck Society. The SDSS Web site is http://www.sdss.org/.
The SDSS is managed by the Astrophysical Research Consortium (ARC) for the Participating Institutions. The Participating Institutions are The University of Chicago, Fermilab, the Institute for Advanced Study, the Japan Participation Group, The Johns Hopkins University, Los Alamos National Laboratory, the Max-Planck-Institute for Astronomy (MPIA), the Max-Planck-Institute for Astrophysics (MPA), New Mexico State University, University of Pittsburgh, Princeton University, the United States Naval Observatory, and the University of Washington.
The authors are additionally grateful to Thodoris Nakos for having performed the June 2004 NTT observations. We further thank the anonymous referee for a constructive report.
References
- Abazajian et al. (2005) Abazajian K., Adelman-McCarthy J. K., Agüeros M. A., et al., 2005, AJ, 129, 1755
- de Blok and Bosma (2002) de Blok W. J. G., Bosma A., 2002, A&A, 385, 816
- Bolton et al. (2004) Bolton A. S., Burles S., Schlegel D. J., Eisenstein D. J., Brinkmann J., 2004, AJ, 127, 1860
- Bolton et al. (2005) Bolton A. S., Burles S., Koopmans L. V. E., Treu T., Moustakas L. A., 2005, ApJ, 624, L21
- Cabanac et al. (2005) Cabanac R. A., Valls-Gabaud D., Jaunsen A. O., Lidman, C., Jerjen C., 2005, A&A in press (astro-ph/0504585)
- Crampton et al. (2002) Crampton D., Schade D., Hammer F., Matzkin A., Lilly S. J., Le Fèvre O., 2002, ApJ, 570, 86
- Dye and Warren (2005) Dye S., Warren S. J., 2005, ApJ, 623, 31
- Drozdovsky et al. (2005) Drozdovsky I., Yan L., Chen H.-W., Stern D., Kennicutt R. J., Spinrad H., Dawson S., 2005, AJ, in press (astro-ph/0503592)
- Eisenstein et al. (2001) Eisenstein D. J., Annis J., Gunn J. E., et al., 2001, AJ, 122, 2267
- Fassnacht (2004) Fassnacht C. D., Moustakas L. A., Casertano S., Ferguson H. C., Lucas R. A., Park Y., 2004, ApJ, 600, L155
- Hayashi et al. (2004) Hayashi E., Navarro J., Power C., Jenkins A. R., Frenk C. S., White S. D. M., Springel V., Stadel J., Quinn T. R., 2004, MNRAS, 355, 794
- Hewett et al. (1985) Hewett P. C., Irwin M. J., Bunclark P., Bridgeland M. T., Kibblewhite E. J., He X. T., Smith M. G., 1985, MNRAS, 213, 971
- Hewett et al. (2000) Hewett P. C., Warren S. J., Willis J. P., Bland-Hawthorn J., Lewis G. F., 2000, ASPC, 195, 94
- Hewitt et al. (1987) Hewitt J.,Turner E. L., Schneider D. P., Burke B. F., Langston G. I., 1987, Nature, 333, 537
- 2004 ([kew04) ewley, L.J., Geller, M.J., Jansen, R.A., 2004, AJ, 127, 2002
- Koopmans and Treu (2003) Koopmans L. V. E., Treu T., 2003, ApJ, 583, 606
- Navarro et al. (2004) Navarro J. F., Hayashi E., Power C., Jenkins A. R., Frenk C. S., White S. D. M., Springel V., Stadel J., Quinn T. R., 2004, MNRAS, 349, 1039
- Ratnatunga et al. (1999) Ratnatunga K. U., Griffiths R. E., Ostrander E. J., 1999, AJ, 117, 2010
- Rusin et al. (2003) Rusin D., Kochanek C. S., Keeton C. R., 2003, 595, 29
- Sluse et al. (2003) Sluse D., Surdej J., Claeskens J.-F., Hutsemékers D., Jean C., Courbin F., Nakos T., Billeres M., Khmil S. V., 2003, A&A, 406, L43
- Treu and Koopmans (2004) Treu T., Koopmans L. V. E., 2004, ApJ, 611, 739
- Wallington et al. (1996) Wallington S., Kochanek C. S., Narayan R., 1996, ApJ, 465, 64
- Warren and Dye (2003) Warren S. J., Dye S., 2003, ApJ, 590, 673
- Warren et al. (1996) Warren S. J., Hewett P. C., Lewis G. F., Møller P., Iovino A., Shaver P. A., 1996, MNRAS, 278, 139
- Warren et al. (1998) Warren S. J., Iovino I., Hewett P. C., Shaver P. A., 1998, MNRAS, 299, 1215
- Wayth et al. (2005) Wayth R. B., Warren S. J., Lewis G. F., Hewett P. C., 2005, MNRAS, in press (astro-ph/0410253)
- Wild and Hewett (2005) Wild V., Hewett P. C., 2005, MNRAS, in press (astro-ph/0501460)
- York et al. (2000) York D. G., Adelman J., Anderson J. E. Jr., et al., 2000, AJ, 120, 1579