On the discovery of the first 350 micron-selected galaxy
Abstract
We report the detection of a 3.6 350 m-selected source in the Boötes Deep Field. The source, the first Short-wavelength Submillimeter-selected Galaxy (SSG 1), was discovered as part of a blank field extragalactic survey using the 350 m-optimised Submillimeter High Angular Resolution Camera (SHARC II) at the Caltech Submillimeter Observatory. With multiwavelength photometry from NOAO-NDWFS (R and I band), FLAMEX (J and Ks), Spitzer (IRAC and MIPS) and the Westerbork 1.4 GHz Deep Survey (radio upper limit), we are able to constrain the photometric redshift using different methods, all of which suggest a redshift 1. In the absence of long-wavelength submillimeter data we use SED templates to infer that this source is an ultraluminous infrared galaxy (ULIRG) with a dust temperature of 305 K, occupying a region of luminosity-temperature space shared by modarate redshift ISO-selected ULIRGs (rather than high redshift SCUBA-selected SMGs). SHARC II can thus select SMGs with moderately “warm” dust that might be missed in submillimeter surveys at longer wavelengths.
Subject headings:
infrared: galaxies – submillimeter: galaxies – galaxies: starburst – galaxies: high–redshift1. INTRODUCTION
Submillimeter-selected galaxies (SMGs) generally refer to the population detected in the pioneering lensed and blank deep field surveys using the Submillimeter Common User Bolometer Array (SCUBA; Holland et al. 1999) instrument on the James Clerk Maxwell Telescope (JCMT) (e.g., Smail, Ivison & Blain 1997; Hughes et al. 1998; Barger et al. 1998; Eales et al. 1999). They are regarded as the high redshift (z2–3; Chapman et al. 2005; Chapman et al. 2003; see also Simpson et al. 2004) counterparts to the population of luminous and ultraluminous infrared galaxies (LIRGs and ULIRGs) detected by the InfraRed Astronomical Satellite, IRAS, typically out to z0.1 (Soifer et al. 1984; Joseph & Wright 1985; and Soifer, Neugebauer & Houck 1987), since they share similar properties (fundamentally, that the bulk of the bolometric luminosity is emitted in the restframe far-IR, powered by a combination of star formation and AGN activity.).
As a necessary consequence of the selection at longer submillimeter wavelengths, SMGs tend to have higher bolometric luminosities, and those with comparable luminosities to IRAS-selected ULIRGs tend to have cooler dust temperatures (Blain et al. 2004). Between the two are the Infrared Space Observatory (ISO)-selected ULIRGs (Aussel et al. 1999; Rowan-Robinson et al. 1999; Elbaz et al. 2002a), which occupy an intermediate redshift space (z1), and have dust masses in-between the IRAS and SCUBA-selected ULIRGs (Chapman et al. 2002; Blain et al. 2004; this is also a region of parameter space that will be shared by Spitzer-selected galaxies, see, e.g., Yan et al. 2004).
Sources selected at 350 m are expected to be predominantly LIRGs and ULIRGs at 13 (the K-correction changes from negative to positive with increasing redshift as the observing window moves towards and past the Wien peak; see, e.g., Guiderdoni et al. 1998; Khan, 2005, in preparation). Galaxies at z1 are likely to be the dominant source of the integrated far-IR background (Puget et al. 1996; Fixsen et al. 1998; Elbaz et al. 2002b); also, observations suggest that after a relatively steep rise from z=0 to 1, the cosmic star formation rate (CSFR) appears to flatten off between z=1 and 4, with evidence for a slow decline at higher redshift (Lilly et al. 1996; Madau et al. 1996; Connolly et al. 1997; Steidel et al. 1999; Gabasch et al. 2004). Hence 350 m-selected sources are an important probe of the epoch of peak star formation rate in the universe.
In this Letter we report on the detection of a single source above 3 at 350 m. It is, to the best of our knowledge, the first short-wavelength submillimeter-selected galaxy (200–500 m) and is denoted as SSG 1 in this Letter (but by standard convention, SMM J143206.65+341613.4). SSG 1 is the first object discovered purely by its 350 m emission, through blank deep observations of the Boötes field in a program designed to search efficiently for new sources at 350 m (the SHARC II Unbiased Deep Survey, SUDS; Khan et al., 2005, in preparation). Verification of the detection is confirmed by coincident sources subsequently identified in the Spitzer MIPS 24 m filter, all four Spitzer IRAC filters, and J, Ks, I and R band, enabling us to place constraints on the photometric redshift, luminosity and nature of this source. This Letter presents these fluxes, plus important flux upper limits in other bands, to characterize this source, and with this understanding we consider the implications for other sources that may be discovered at 350 m.
2. OBSERVATION
Eight hours of data were obtained using the Second Generation Submillimeter High Angular Resolution Camera (SHARC II) at the Caltech Submillimeter Observatory (CSO) on Mauna Kea, Hawai’i, in January and March 2004. SHARC II is a 350 m-optimized camera (Dowell et al. 2003) built around a element close-packed bolometer array (Moseley et al. 2004). It achieves a point-source sensitivity of in good weather. The 384 pixels of the SHARC II array image a region of around on the sky. Its filled absorber array provides instantaneous imaging of the entire field of view, sampled at roughly 2.5 pixels per nominal beam area. The beam profile was measured on known compact sources, and was verified to be within three per cent of the diffraction-limited beamwidth of . All observations were taken using the Dish Surface Optimisation System (Leong et al. 2003), which corrects for the primary mirror deformation as a function of zenith angle, to improve the telescope efficiency and the pointing.
For these data the in-band zenith atmospheric opacity () ranged from 1.0 to 1.4, corresponding to a zenith transmission of around 30 per cent. Our observations were centred on the Boötes Deep Field (de Vries et al. 2002), at position RA, Dec (J2000).
The data were reduced using the standard CSO reduction software, CRUSH (Kovács, 2005, in preparation). This software implements a self-consistent least-squares algorithm to solve for the celestial emission, taking into account instrumental and atmospheric contributions to the signal.
The skymap is calibrated with the flux and point spread function based on observations of Callisto taken throughout the observing period at similar elevations.
3. RESULTS
| Observed wavelength | Flux density | Instrument–Survey |
|---|---|---|
| X-ray (0.5–7 keV) | c.g.s | Chandra–XBoötes |
| 4220Å | 0.1 Jy | KPNO–NDWFS |
| 6590Å | 1.0 0.1 Jy | KPNO–NDWFS |
| 8081Å | 3.1 0.2 Jy | KPNO–NDWFS |
| 1.24 m | 10.5 1.1 Jy | KPNO–FLAMEX |
| 2.16 m | 42.0 1.4 Jy | KPNO–FLAMEX |
| 3.6 m | 80.0 2.9 Jy | Spitzer IRAC–Shallow |
| 4.5 m | 65.8 3.6 Jy | Spitzer IRAC–Shallow |
| 5.8 m | 55.3 17.3 Jy | Spitzer IRAC–Shallow |
| 8.0 m | 81.7 15.1 Jy | Spitzer IRAC–Shallow |
| 24 m | 0.61 0.04 mJy | Spitzer MIPS–IRS/MIPS GTO |
| 70 m | 40 mJy | Spitzer MIPS–IRS/MIPS GTO |
| 160 m | 100 mJy | Spitzer MIPS–IRS/MIPS GTO |
| 350 m | 23.2 7.9 mJy | SHARC II–SUDS |
| 21 cm | 63 Jy | Westerbork–Deep 1.4 GHz |
An oversampled fit is used to determine the position of the source and the flux per beam. The best-fitting position is at 14:32:06.650.24 +34:16:13.4 (J2000) (quoting 3 position uncertainties), with a flux per beam of 23.2 7.9 mJy (the 1 uncertainty comprises the background noise, primary calibrator and gain calibration errors). The signal-to-noise in the detection is 3.6. The additional photometry for SSG 1 (Table 1) is from the Chandra XBoötes survey (Murray et al. 2005), NOAO-NDWFS (Jannuzi & Dey 1999), FLAMEX (Elston et al., 2005, in preparation), Spitzer-IRAC Shallow survey (Eisenhardt et al. 2004), Spitzer-MIPS (IRS and MIPS GTO teams) and the Westerbork deep 1.4 GHz survey (de Vries et al. 2002). The upper limits are quoted to 3. The corresponding multiwavelength positions and probability of coincident detection are given in Table 2.
| Position (J2000) | Band | P(Accidental Overlap) | |
|---|---|---|---|
| RA | Dec | ||
| 14:32:06.61 | +34:16:12.0 | R | 9.5% |
| 14:32:06.55 | +34:16:11.6 | Ks | 2..9% |
| 14:32:06.58 | +34:16:12.0 | 3.6 m | 9.4% |
| 14:32:06.60 | +34:16:11.5 | 24 m | 0.2% |
| 14:32:06.65 | +34:16:13.4 | 350 m | n/a |
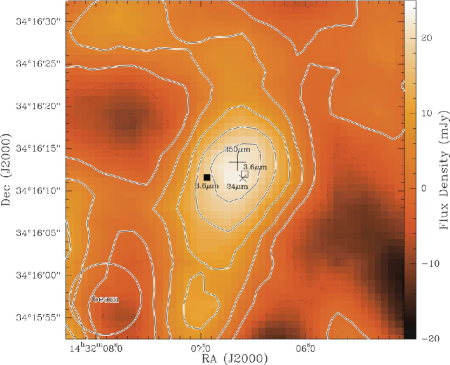
Within the 99% 350 m confidence region there are two candidate sources resolved in the optical and NIR bands (Figure 1). We assume that the optical-NIR counterpart of SSG 1 is the source coincident with the MIPS 24 m detection. The source to the east of this (at IRAC position RA, Dec /J2000) is not detected by MIPS, and is designated as SSG 1E for the purposes of this Letter.
4. CONSTRAINING THE NATURE OF SSG 1

Using the fluxes presented in Table 1, we can use several methods to constrain the redshift, reddening, infrared luminosity and dust temperature of SSG 1. It can be seen in Figure 2 that the optical-NIR SED of SSG 1 is characterized by a prominent bump associated with the continuum emission of the stellar populations. This bump peaks at 1.6 m in the rest-frame, providing a very good constraint on the redshift, and also indicates SSG 1 is more likely to be starburst rather than AGN-dominated (which are usually associated with a featureless power-law spectrum; see, e.g., Egami et al. 2004).
| Source | Photometric Redshift | Model | AV |
|---|---|---|---|
| SSG 1 | 1.0 | IMPZ | 2.60.2 |
| 0.99 | STARDUST2 | 2.20.09 | |
| SSG 1E | 1.00.05 | IMPZ | 0.50.1 |
IMPZ (Babbedge et al. 2004) uses only the optical-NIR photometry when fitting templates with Bayesian statistics. The best-fitting redshifts are z=1.0 for SSG 1 and z=1.00.05 for SSG 1E respectively (1), and are listed in Table 3. It is worth noting that if, as IMPZ suggests, both galaxies are at the same distance, and interacting, it would make the SSG pair a widely separated interacting ULIRG system (a local example of which is IRAS 09111–1007; Khan et al. 2005).
STARDUST2 (Chanial et al., 2005, in preparation) uses a mid-IR to radio spectral library constrained by the IR-radio correlation and a variety of local, IRAS, ISO and SCUBA color-color correlations in addition to a stellar synthesis model for the FUV to NIR window (Devriendt et al. 1999). This provides a simultaneous constraint on the thermal dust emission as well as the redshift. The effective dust temperature is found following the methodology given in Chapman et al. (2002; 2005). The model assumes , , and , and that a single component is responsible for both the optical and IR emission. Because of the degeneracy in fitting and the Total-IR Luminosity, (8–1100 m), it is the 350 m flux in conjunction with the radio upper limit that constrains the infrared luminosity. The radio upper limit (Table 1) is used to find as follows:
with the radio term being
where is the modeled spectral energy distribution and 3 is the radio upper limit listed in Table 1.
The best-fitting model for SSG 1 from STARDUST2 returns a redshift of 0.99 (all errors are quoted to 1 ; note: STARDUST2 uses the longer wavelengths, in addition to the optical-NIR photometry, to fit the extinction given in Table 3). This model also gives a dust temperature of 30.34.5 K, and a log() of 12.02 L⊙, with 88% of the total bolometric luminosity radiated at wavelengths longward of 5 m. The predicted 850 m flux is 2.7 mJy.
Other redshift estimates were independently obtained following an approach that mostly relies on the fit of the 1.6 m feature (see, e.g., Le Floc’h et al. 2004). In agreement with the results derived from IMPZ and STARDUST2, these fits of the stellar bump led to a redshift z1 using the photometric Arp220 SED, and z=1.250.25 using various templates from the library of Devriendt et al. (1999).
We also use the radio-submillimeter correlation to estimate a minimum redshift for the source, as the radio flux is unlikely to be significantly AGN-enhanced. Formally, these correlations should be used as a statistical redshift indicator, so with that caveat we present the minimum redshift of SSG 1 based on the 1.4 GHz upper limit (Table 1) and an 850 m flux derived from the best-fitting STARDUST2 SED (Figure 2). Using the relations of Dunne, Clements & Eales (2000) and Carilli & Yun (2000a; 2000b) we get of 1.2 and 1.5 respectively.
The photometric redshift is more secure than the radio-submillimeter correlation since the latter is prone to systematics caused by uncertain dust temperatures (see Clements et al. 2004).
5. DISCUSSION
The (R– color of 5.7 for SSG 1 classifies it as an Extremely Red Object (ERO), and both IMPZ and STARDUST2 find this object to be highly reddened (Table 3). At least a third of the SMG population can be classified as EROs (Smail et al. 2002; Webb et al. 2004; Frayer et al. 2004), which comprise two classes of galaxies: elliptical and dusty star-forming luminous infrared galaxies (but a significant submillimeter flux is usually indicative of the latter class). EROs are thought to comprise a significant fraction of the cosmic star formation density at redshifts of one and higher (Cimatti et al. 2002), the epoch by which the majority of the universe’s star formation has taken place (Dickinson et al. 2003; Rudnick et al. 2003).
Determining the effective dust temperature of the source allows us to estimate the total fraction of the bolometric luminosity that is reprocessed by the dust. Our effective dust temperature from STARDUST2 is 30.34.5 K, which, with our total infrared luminosity of , allows us to directly compare SSG 1 with IRAS and SCUBA-selected ULIRGs in the L vs T diagram of Blain et al. (2004). We find that SSG 1 is warmer than an equivalent luminosity SMG from the Chapman et al. (2003; 2005) high redshift sample, and cooler than the IRAS moderate redshift counterparts of Stanford et al. (2000). Instead, it is similar to the intermediate redshift ISO sample of Garrett (2002).
The notion of SSG 1 being an ISO ULIRG analog is further reinforced by the best-fitting 60-100 m colors from STARDUST2, of which the closest template is FN1-40, an ISO cold (=25.7 K) ULIRG at z=0.45 (Chapman et al. 2002). The 850 m flux (3 mJy) predicts SSG 1 to be fainter than the majority of SCUBA-selected SMGs (, due to survey and instrument limitations). We conclude that SSG 1 is more like ISO-selected ULIRGs rather than the SCUBA-selected SMGs.
6. CONCLUSION
We report the detection of the first short-wavelength submillimeter-selected galaxy (SSG 1) and present optical, NIR and IR photometry which we use to constrain the redshift, luminosity and dust temperature of this source. The photometric redshift estimators are all in agreement, producing a best-fitting redshift of 1. The dust temperature of 30.34.5 K and luminosity of make SSG 1 an analog of intermediate redshift ISO-selected ULIRGs rather than high redshift SCUBA-selected SMGs.
If there exists a population of galaxies with properties similar to SSG 1, in a redshift space between ISO and SCUBA, it may be argued that observations at 350 m, in conjunction with the current ISO, Spitzer and SCUBA samples, could describe the IR-luminous population from 0.34.0 (although the SCUBA-selected galaxies will be more luminous). Not only would this population bridge the gap in redshift space, but also the gap in “dust temperature space” (and consequently “dust mass space”). SHARC II thus complements SCUBA in revealing warmer SMGs that might be missed otherwise. Furthermore, finding the lower luminosity SMGs is necessary for an accurate understanding of the submillimeter luminosity function.
From our understanding of the first 350 m-selected object, SSG 1, we infer that observations at 350 m, far from being superfluous to SCUBA, will be of great use in determining the nature and evolution of the luminous infrared galaxy population.
7. ACKNOWLEDGEMENTS
The Caltech Submillimeter Observatory is supported by NSF contract AST-0229008. This work is based in part on observations made with the Spitzer Space Telescope, which is operated by the Jet Propulsion Laboratory, California Institute of Technology under NASA contract 1407. This work made use of images and data products provided by the NOAO Deep Wide-Field Survey (Jannuzi & Dey 1999), which is supported by the National Optical Astronomy Observatory (NOAO). NOAO is operated by AURA, Inc., under a cooperative agreement with the National Science Foundation. The FLAMEX Survey acknowledges support from NOAO and NSF (AST-9875448, AST-0407085, AST-0436681), and technical assistance from S.N. Raines.
We would like to thank the anonymous referee for their insightful comments which have significantly improved this Letter. We also thank Tom Phillips and the CSO for observing time and assistance during our runs, and Darren Dowell, Colin Borys and Attila Kovács for instrument and data reduction support. We express our gratitude to our fellow GSFC co-Is on SUDS: Bob Silverberg and Dave Chuss. We also thank SUDS co-I Rick Arendt for continual support on the data analysis. S.A.K. thanks Jon Gardner, Rob Ivison and Steve Eales for very helpful discussions.
References
- Aussel et al. (1999) Aussel, H., Cesarsky, C. J., Elbaz, D., Starck, J. L., 1999, A&A, 342, 313
- Babbedge et al. (2004) Babbedge, T. S. R., et al., 2004, MNRAS, 353, 654
- Barger et al. (1998) Barger, A. J., Cowie, L. L., Sanders, D. B., Fulton, E., Taniguchi, Y., Sato, Y., Kawara, K., Okuda, H., 1998, Nature, 394, 248
- Blain et al. (2004) Blain, A. W., Chapman, S. C., Smail, I., Ivison, R., 2004, ApJ, 611, 52
- Carilli & Yun (2000a) Carilli, C. L., Yun, Min S., 2000, ApJ, 530, 618
- Carilli & Yun (2000b) Carilli, C. L., Yun, Min S., 2000, ApJ, 539, 1024
- Chapman et al. (2005) Chapman, S. C., Blain, A. W., Smail, I., Ivison, R. J., 2005, ApJ, 622, 772
- Chapman et al. (2003) Chapman, S. C., Blain, A. W., Ivison, R. J., Smail, I. R., 2003, Nature, 422, 695
- Chapman et al. (2002) Chapman, S. C., Smail, I., Ivison, R. J., Helou, G., Dale, D. A., Lagache, G., 2002, ApJ, 573, 66
- Cimatti et al. (2002) Cimatti, A., et al., 2002, A&A, 381L, 68
- Clements et al. (2004) Clements, D., et al.,2004, MNRAS, 351, 447
- Connolly et al. (1997) Connolly, A.J., Szalay, A.S., Dickinson, M., Subbarao, M.U., Brunner, R.J., 1997, ApJ, 486, 11
- de Vries et al. (2002) de Vries, W. H., Morganti, R., Röttgering, H. J. A., Vermeulen, R., van Breugel, W., Rengelink, R., Jarvis, M. J., 2002, AJ, 123, 1784
- Devriendt et al. (1999) Devriendt, J. E. G., Guiderdoni, B., Sadat, R., 1999, A&A, 350, 381
- Dickinson et al. (2003) Dickinson, M., Papovich, C., Ferguson, H. C., Budavári, T., 2003, ApJ, 587, 25
- Dowell et al. (2003) Dowell C.D., et al., 2003, SPIE, 4855, 73
- Dunne et al. (2000) Dunne, L., Clements, D. L., Eales, S. A., 2000, MNRAS, 319, 813
- Eales et al. (1999) Eales, S., et al., 1999, ApJ, 515, 518
- Egami et al. (2004) Egami, E., et al., 2004, ApJS, 154, 130
- Eisenhardt et al. (2004) Eisenhardt, P.R., et al., 2004, ApJS, 154, 48
- Elbaz et al. (2002a) Elbaz, D., Flores, H., Chanial, P., Mirabel, I. F., Sanders, D., Duc, P.-A., Cesarsky, C. J., Aussel, H., 2002a, A&A, 381, 1
- Elbaz et al. (2002b) Elbaz, D., Cesarsky, C.J., Chanial, P., Aussel, H., Franceschini, A., Fadda, D., Chary, R. R., 2002b, A&A, 384, 848
- Fixsen et al. (1998) Fixsen, D.J. et al., 1998, ApJ, 508, 123
- Frayer et al. (2004) Frayer, D. T., et al., 2004, ApJS, 154, 137
- Gabasch et al. (2004) Gabasch, A., et al., 2004, ApJ, 616, L83
- Garrett (2002) Garrett, M. A., 2002, A&A, 384, L19
- Guiderdoni et al. (1998) Guiderdoni, B., Hivon, E., Bouchet, F. R., Maffei, B., 1998, MNRAS, 295, 877
- Holland et al. (1999) Holland, W. S., et al., 1999, MNRAS, 303, 659
- Hughes et al. (1998) Hughes, D. H., et al., 1998, Nature, 394, 241
- Jannuzi & Dey (1999) Jannuzi, B. T., Dey, A., 1999, in ”Photometric Redshifts and the Detection of High Redshift Galaxies”, ASP Conference Series, Vol. 191, Edited by R. Weymann, L. Storrie-Lombardi, M. Sawicki, and R. Brunner. ISBN: 158381-017-X, p. 111
- Joseph & Wright (1985) Joseph R.D., Wright G.S., 1985, MNRAS, 214, 87
- Khan et al. (2005) Khan, S.A., Benford, D.J., Clements, D.L., Moseley, S.H., Shafer, R.A., Sumner, T.J., 2005, MNRAS, 359L, 10
- Le Floc’h et al. (2004) Le Floc’h, E., et al. 2004, ApJS, 154, 170
- Leong et al. (2003) Leong, M., et al., 2003, http://puuoo.caltech.edu/dsos/DSOSAMOSpaper.pdf
- Lilly et al. (1996) Lilly, S.J., Le Fèvre, O., Hammer, F., Crampton, D., 1996, ApJ, 460, 1
- Madau et al. (1996) Madau, P., Ferguson, H. C., Dickinson, M. E., Giavalisco, M., Steidel, C. C., Fruchter, A., 1996, MNRAS, 283, 1388
- Moseley et al. (2004) Moseley S.H., Allen C.A., Benford D., Dowell C.D., Harper D.A., Phillips T.G., Silverberg R.F., Staguhn J., 2004, NIMPA, 520, 417
- Murray et al. (2005) Murray, S.S., et al., 2005, astro-ph/0504084
- Puget et al. (1996) Puget, J.-L., Abergel, A., Bernard, J.-P., Boulanger, F., Burton, W. B., Desert, F.-X., Hartmann, D., 1996, A&A, 308, L5
- Rowan-Robinson (1999) Rowan-Robinson, M., et al., 1999, The Universe as Seen by ISO. Eds. P. Cox & M. F. Kessler. ESA-SP 427., p. 1011
- Rudnick et al. (2003) Rudnick, G., et al., 2003, ApJ, 599, 847
- Simpson et al. (2004) Simpson, C., Dunlop, J. S., Eales, S. A., Ivison, R. J., Scott, S. E., Lilly, S. J., Webb, T. M. A., 2004, MNRAS, 353, 179
- Smail et al. (2002) Smail, I., Owen, F. N., Morrison, G. E., Keel, W. C., Ivison, R. J., Ledlow, M. J, 2002, ApJ, 581, 844
- Smail et al. (1997) Smail, I., Ivison, R. J., Blain, A. W., 1997, ApJ, 490L, 5
- Soifer et al. (1987) Soifer B.T., Neugebauer G., Houck J.R., 1987, ARA&A, 25, 187
- Soifer et al. (1984) Soifer B.T., et al., 1984, ApJ, 278L, 71
- Stanford et al. (2000) Stanford, S. A., Stern, D., van Breugel, W., De Breuck, C., 2000, ApJS, 131, 185
- Steidel et al. (1999) Steidel, C. C., Adelberger, K. L., Giavalisco, M., Dickinson, M., Pettini, M., 1999, ApJ, 519, 1
- Webb et al. (2003) Webb, T. M. A., Brodwin, M., Eales, S., Lilly, S. J., 2004, ApJ, 605, 645
- Yan et al. (2004) Yan, L., et al., 2004, ApJS, 154, 75