Disk evolution since in a CDM Universe.
Abstract
Increasingly large populations of disk galaxies are now being observed at increasingly high redshifts, providing new constraints on our knowledge of how such galaxies evolve. Are these observations consistent with a cosmology in which structures form hierarchically? To probe this question, we employ SPH/N-body galaxy scale simulations of late-type galaxies. We examine the evolution of these simulated disk galaxies from redshift 1 to 0, looking at the mass-size and luminosity-size relations, and the thickness parameter, defined as the ratio of scale height to scale length. The structural parameters of our simulated disks settle down quickly, and after redshift the galaxies evolve to become only slightly flatter. Our present day simulated galaxies are larger, more massive, less bright, and redder than at . The inside-out nature of the growth of our simulated galaxies reduces, and perhaps eliminates, expectations of evolution in the size-mass relation.
1 INTRODUCTION
Galaxies are major structural components of our Universe, yet their formation and evolution remain an outstanding mystery of contemporary astrophysics. The latest generation of telescopes, including Keck, Subaru, the Very Large Telescope, Gemini, and the Hubble Space Telescope, provide snapshots of galaxies at various redshifts. The properties of disk galaxies out to have been the subject of several recent studies. These properties include the Tully-Fisher relation (e.g. Vogt et al. 1996; Bizyaev & Mitronova 2002; Böhm et al. 2004), the luminosity-size, magnitude-size, and mass-size relations (e.g. Lilly et al. 1998; Simard et al. 1999; Bouwens & Silk 2002; Barden et al. 2005), the size distribution (e.g. Shen et al. 2003; Ravindranath et al. 2004; Ferguson et al. 2004) and the disk “thickness” (Reshetnikov, Dettmar & Combes 2003, hereafter RDC, Elmegreen et al. 2005).
The evolution of the luminosity-size and mass-size relations of disk galaxies remains a controversial issue. In particular, the interpretation of such evolution depends acutely on the selection biases of the surveys. Several studies have found an increase in the -band surface brightness of mag arcsec-2, out to redshift 1 (e.g. Schade et al. 1996; Roche et al. 1998; Lilly et al. 1998). Taking into account selection effects Simard et al. (1999) found minimal evolution with redshift, work that was supported by Ravindranath et al. (2004), who found that the luminosity-size relation evolves by less than 0.4 mag arcsec-1 between and . Yet these groups invoke a population of high redshift, high surface brightness galaxies in their interpretation. Different interpretations of completeness have resulted in Trujillo & Aguerri (2004) and Barden et al. (2005) finding an evolution in the rest frame -band surface brightness of and mag arcsec-2 out to and , respectively. Barden et al. (2005) also find that disks at a given absolute magnitude are bluer, with lower stellar mass to light ratios at , resulting in weak evolution in the relation between stellar mass and disk size.
RDC selected 34 edge-on disk galaxies in the Hubble Deep Field with apparent diameters larger than 1.3″ and unperturbed morphology. They found an evolution between distant and local disk galaxies in their relative thickness or flatness, as characterized by the ratio of scale height to scale length . Their results indicate that disks at redshift are smaller, in absolute value, than present day disk galaxies, and have a thickness ratio, larger by a factor . support for such a thickening of disk galaxies at high redshifts also comes from Elmegreen et al. (2005), who inferred from their study of galaxies in the Hubble Ultra-Deep-Field that high redshift disk galaxies are thicker than local spirals by a factor of .
Studies such as these are clearly increasing our knowledge of the evolutionary stages of populations of disk galaxies, yet the path taken for galaxies to evolve between these stages remains unclear, and reliant on modeling. The general scenario of galaxy formation within the cosmological context, as envisioned by White & Rees (1978), involves extended dark halos of galaxies forming hierarchically by gravitational clustering of non-dissipative dark matter. The luminous components form by a combination of the gravitational clustering and dissipative collapse. A general framework for the formation of disk galaxies was outlined in Fall & Efstathiou (1980). In their model, a uniformly rotating, homogeneous protogalactic cloud of gas begins to collapse as it decouples from the Hubble flow. This protogalaxy is endowed with angular momentum from tidal torques driven by surrounding structure (Peebles 1969). It is assumed that the baryons destined to form the disk receive the same tidal torques as the dark matter before much dissipation occurs. If the collapse is smooth, then specific angular momentum is conserved and the gas forms a thin, rapidly rotating disk (e.g. Dalcanton, Spergel, & Summers 1997; Mo, Mao, & White 1998).
Detailed direct modeling has highlighted that the above disk formation scenario is far from simple within a Cold Dark Matter (CDM) Universe . Complex baryonic processes involving multiple gas phases and energy feedback, for example from quasars, supernovae, and stellar winds, have proven difficult to model, yet these processes appear to be crucial in the formation and evolution of disk galaxies within the context of hierarchical structure assembly. Early simulations employed thermal feedback, following Katz & Gunn (1991), augmented somewhat in Navarro & White (1993), who added a variable fraction of supernova energy as kinetic energy. This type of feedback has been popular up until recent times (e.g. Steinmetz & Navarro 2002; Abadi et al. 2003), even though it was known to be highly inefficient, with thermal energy radiating away over timescales shorter than the dynamical timescales Katz (1992). The effects of this inefficient feedback, in light of the the overcooling problem (White & Rees 1978), was the rapid formation of stars in the early collapsing halos. Subsequent mergers of these halos resulted in loss of angular momentum to the dark halo, resulting in disk galaxies being dominated by stellar halo components, and significantly deficient in angular momentum. Weil, Eke, & Efstathiou (1998) showed that the suppression of early radiative cooling in numerical simulations can result in more realistically sized disks. The problem was tackled in Thacker & Couchman (2000) by turning off cooling for a fixed time in gas within the SPH smoothing kernel of a supernova event. Although lacking detailed insights into the multiphase gas processes involved in galaxy formation, these models succeeded in regulating star formation in small halos, and resulted in increased angular momentum in the simulated disk galaxy. In Brook et al. (2004a), we simulated galaxies using identical initial conditions with these two different feedback methods. The thermal feedback following Katz & Gunn (1991) resulted in galaxies which are dominated by a high mass, high metallicity spheroidal stellar component, with a low mass disk component. By regulating star formation in low mass building blocks, the adiabatic feedback model, which follows Thacker & Couchman (2000), formed galaxies with a dominant disk component, and a low mass, low metallicity stellar halo. Sommer-Larsen and collaborators have examined other implementations of feedback, and also shown the importance of regulating cooling at early epochs (Sommer-Larsen, Gelato, & Vedel 1999; Sommer-Larsen & Dolgov 2001; Sommer-Larsen, Götz, & Portinari 2003). Meanwhile, Governato et al. (2004) highlights the importance of resolution in simulating disk galaxies. Implementing these findings has allowed models such as Robertson et al. (2004), Okamoto et al. (2005) and Governato et al. (2005) to make progress in reproducing disk galaxies with properties approaching those of observed disks.
Our chemo-dynamical models for simulating disk galaxies (which we will refer to as sGALS, to avoid confusion with real galaxies) have been successful in forming disk galaxies with a dominant young, metal-rich disk component, with a metal poor, old stellar halo, and an old, intermediate metallicity thick disk component. The sGALS have many features observed in the Milky Way and local disk galaxies, including metallicities, abundances, ages, and color gradients of the stellar populations of the thin and thick disks, metallicities and abundances of the stellar halo, and the relation between luminosity and metallicity of the stellar halo (Brook et al. 2004a; Brook et al. 2004b [hereafter BKGF]; Brook et al., 2005 [hereafter BGMK]; Renda, Gibson, & Kawata 2005). Here we report on the evolution of the disk component of such sGALS, specifically after redshift . We deliberately follow the evolution of our sGALS at times after which they have settled into a disk morphology, and trace their luminosity, scale length, scale height, and central surface brightness. We hope to provide insight into how the disk component of late-type galaxies evolve in their relatively “quiescent phase,” during which mergers are only minor and star formation occurs almost exclusively in the disk regions.
In this paper, we concentrate on the evolution of the size-mass and size-central surface brightness relations and the “thickness” of four simulated disk galaxies (sGALS), and what these tell us about interpreting observations. We also examine the evolution of the magnitude and color of our simulated galaxies. Our study will not allow direct comparison with the observational studies which compare distant galaxy populations to “like” local galaxy populations; it is not clear which galaxies are likely progenitors of today’s galaxies. Yet, by providing evolutionary paths that disk galaxies can be expected to follow, our study will provide insights into the interpretation of such observations, in particular in how to interpolate between the two populations.
2 THE CODE AND MODELS
The four sGALS studied here are the same as were studied in BGMK. They are formed using our galactic chemo-dynamical evolution code, GCD+, which self-consistently models the effects of gravity, gas dynamics, radiative cooling, and star formation. Full details of GCD+ can be found in Kawata & Gibson (2003). All galaxies are formed with the Adiabatic Feedback Model from Brook et al. (2004a). In this model, gas within the SPH smoothing kernel of SNe II explosions is prevented from cooling. This adiabatic phase is assumed to last for the lifetime of the lowest mass star which ends as a SNe II, i.e. the lifetime of an 8-M star (100 Myr). In the AFM, the energy released by SNe Ia, which do not trace starburst regions, is fed back as thermal energy.
| Galaxy | |||
|---|---|---|---|
| sGAL1 | 1.8 | 51011 | 0.0675 |
| sGAL2 | 1.9 | 51011 | 0.0675 |
| sGAL3 | 2.0 | 11012 | 0.0600 |
| sGAL4 | 2.2 | 51011 | 0.0675 |
We employ a semi-cosmological version of GCD+, where the initial conditions consist of an isolated sphere of dark matter and gas (Katz & Gunn, 1991). This top-hat overdensity has an amplitude, , at initial redshift, , which is approximately related to the collapse redshift, , by (e.g. Padmanabhan, 1993). Small scale density fluctuations are superimposed on each sphere, parameterized by , seeding local collapse and subsequent star formation. Longer wavelength fluctuations are incorporated by imparting a solid-body rotation corresponding to a spin parameter, , to the initial sphere, where is the total angular momentum, the total energy, and is the total mass of the sphere. This simplified model allows us to run a suite of simulations at high resolution, whilst retaining the most important features of full cosmological simulations. The choice of large values of , and initial conditions in which no major merger occurs in late epochs (), ensures that disk sGALS are formed. We use an Einstein-deSitter CDM model; parameters relevant to all sGALS include , baryon fraction, , , star formation efficiency, , and . This choice was made merely for convenience. As we showed in BGMK, the consequences of using this cosmology with the initial conditions of this study, rather than the now standard CDM cosmology, are negligible. Essentially, prior to the redshift of collapse , a CDM universe is almost identical to a Einstein-de Sitter universe, while after that redshift, the system is so dense that the background cosmology becomes irrelevant. For a detailed proof, we refer the reader to BGMK. Other parameters varied slightly between the four models, but all were chosen to result in Milky-Way-type sGALS. Table 1, reproduced from BGMK, shows the values of total mass, , and for the four simulations. Along with these variations in parameters, different random seeds are incorporated in the initial conditions of the sGALS, creating evolutionary diversity in our sample. We employed 38911 dark matter and 38911 gas/star particles for each model.
3 RESULTS
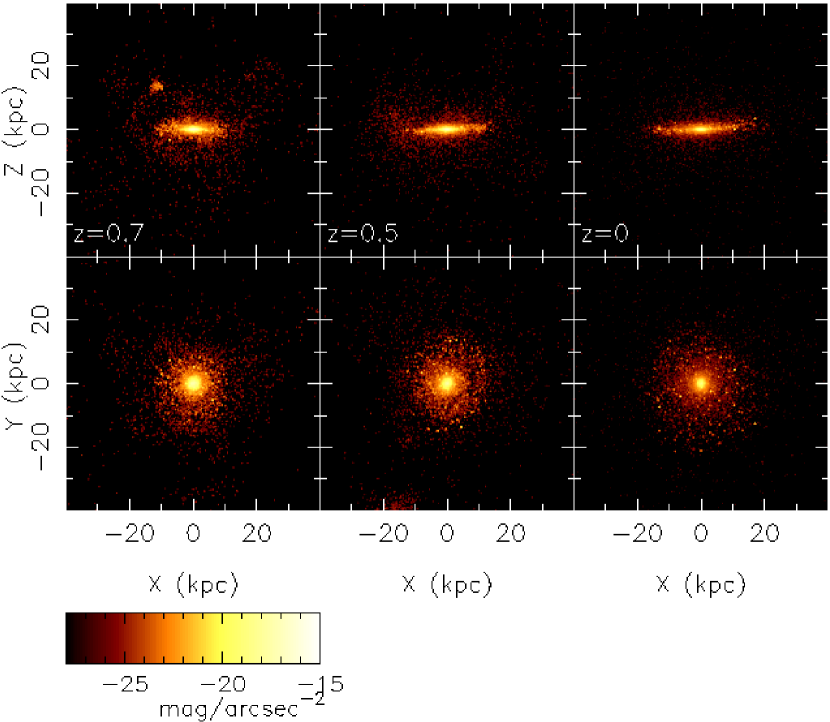
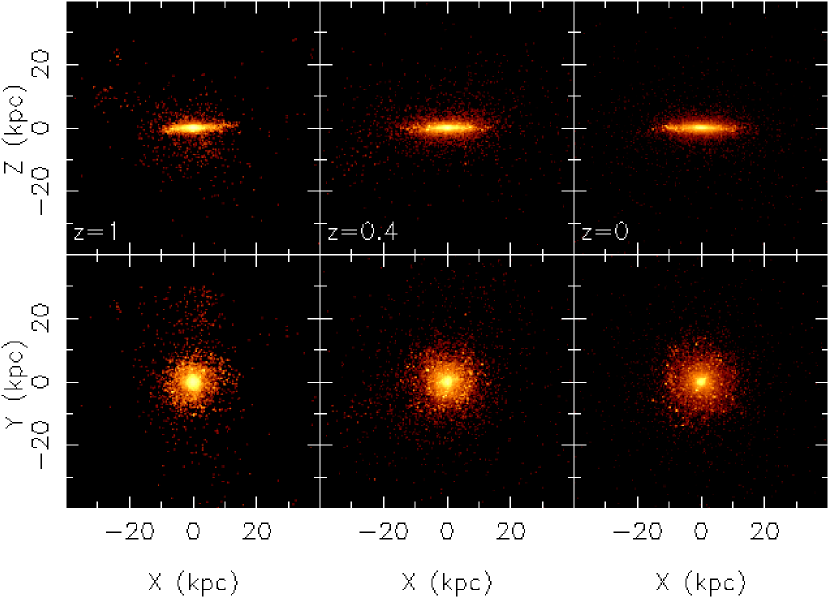
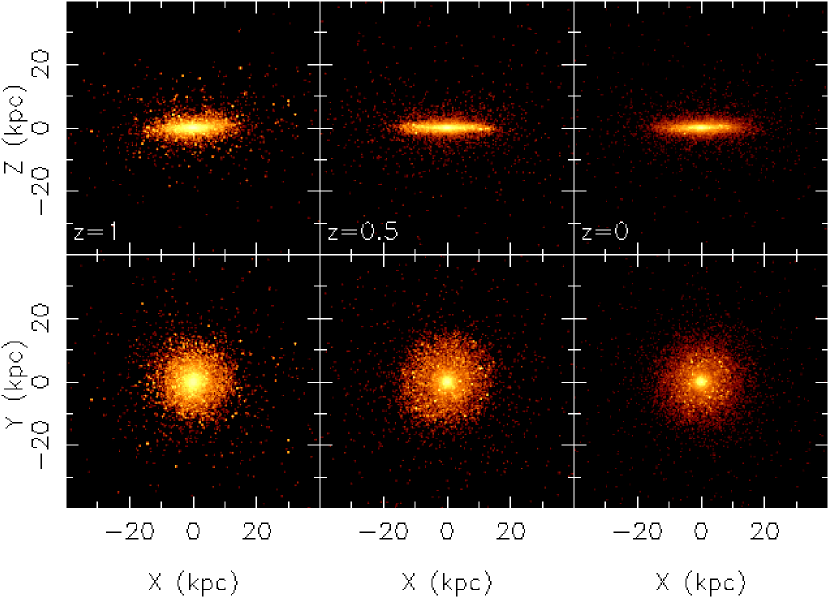
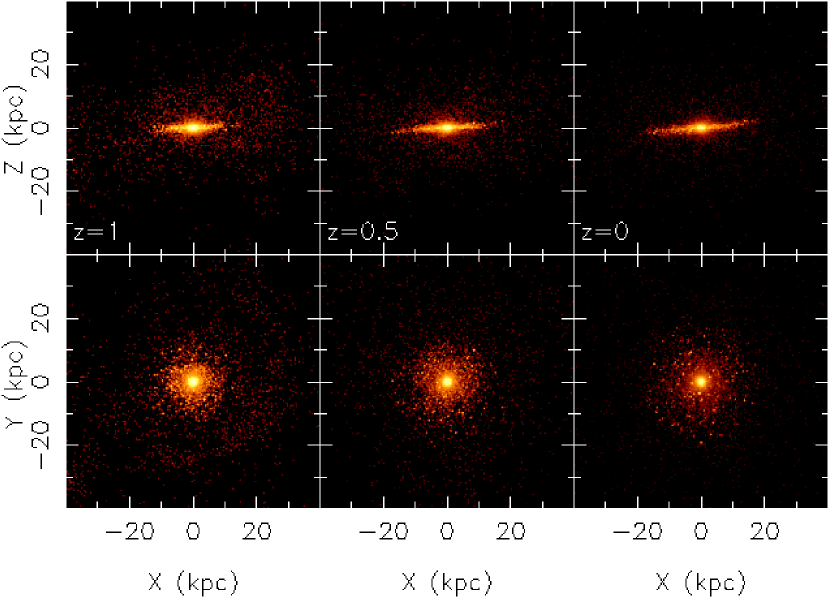
Our model results in the formation of late-type sGALS which have a dominant disk component, with a low mass, metal poor halo component (BKGF). Figure 1 shows the rest frame -band surface brightness profile of sGAL1, both edge-on (upper panels) and face-on (lower panels), at three epochs: (corresponding to a lookback time of 7.3 Gyrs) (5.7 Gyrs), and . Figures 2-4 show corresponding plots for sGALS 2-4, shown at (corresponding to lookback time of 8.5 Gyrs) ( for sGAL2, lookback time 4.8 Gyrs), and . These epochs are chosen to be: (a) after the thick disk formation epoch, when the old thin disk has begun to form; (b) at an intermediate time; and (c) the present, respectively. The different time chosen for the early epoch of sGAL1 () was taken as that simulated galaxy is undergoing a significant merger at , and we need our sGALS to have a settled disk structure for a fair comparison with distant galaxies which have been selected for their disk features. Similarly, a satellite is being accreted to sGAL2 at the intermediate epoch, 0.5, so we chose a later intermediate time, for this sGAL. The surface brightness is calculated by assuming that each star particle is a single stellar population, and using the SSPs of Kodama & Arimoto (1997), with a simple Salpeter initial mass function (IMF) parameterized by a power-law slope of 1.35 and lower and upper mass of 0.1 and , respectively. The photometric properties of sGALS discussed here are all intrinsic values, where we avoid discussing the effect of the dust absorption.
Total -band magnitudes of the sGALS are found by integrating the luminosity densities displayed in these images. The results are shown in column 3 of Table 2. We see that the galaxies have an average at the earliest epoch (which we will refer to as ), an average of at the intermediate epoch () and at . The higher luminosity at earlier times is largely due to the enhanced star formation at the epoch during which the thick disk forms (see BKGF), the epoch which precedes the “early epoch” () analyzed in this study. The rate of star formation is lower during the more quiescent later epochs, resulting in evolution toward fainter magnitudes at the present.
We repeat the above process in both the rest frame and bands, and derive and colors. The and colors are shown in columns 5 and 6 of Table 2, respectively. The galaxies become redder during the relatively quiescent late epochs studied, from an average () of 1.1 (0.7) at 1, to 1.5 (0.9) at , and 1.7 (1.0) at . These redder colors are due to the effects of a decreasing star formation rate, aging stellar populations, and more metal rich stellar populations being born in the disk region. The redder colors are not sufficient to overcome the decrease in -band luminosity; the sGALS also become fainter in the redder bands.
The -band surface brightness profiles for the four sGALS are plotted against radius in Figure 5, at the three epochs shown in Figures 1-4. We use open stars for the early phase of evolution (), open squares for the intermediate phase (), and solid triangles for in this and all ensuing plots in order to allow evolution of the properties of the disk sGALS to be easily followed. Outside the central bulge regions, the disk components can be approximated reasonably by exponential fits. This allows us to derive disk scale lengths for each sGAL at each epoch. This is done in two stages. An approximate scale length is derived by fitting between 4 and 20 kpc. This allows us to then make fits between (to exclude the bulge) and . Numerous tests verified that this technique gave robust results, which are shown column 9 in Table 2. Scale lengths increase from an average of 2.9 at to an average of 3.5 at , and to 4.1 by . The implication is that the galaxies grow from the “inside-out.”
We plot the surface brightness profiles of the four sGALS perpendicular to the disk in Figure 6. We exclude the bulge region when calculating how the surface brightness varies with distance from the disk plane. Again, the profiles are well fitted with exponentials, and we fit between 0 and 2.5 scale heights (essentially out to 1.5 kpc in Figure 6) using similar techniques as employed to derive scale lengths. The derived scale heights are shown in column 8 of Table 2. Scale heights remain close to constant, with an average of at to an average of at , and an average of at . We derive the thickness of the disks, defined as the ratio of scale height to scale length, , and show the results column 10 in Table 2. On average, the galaxies are “thicker” at the earlier epochs, by a factor of at . This is due to the no evolution of the scale hight and the increasing scale length with decreasing redshift. Our simulation does show little evolution of the scale height, because the thick disk forms first, followed by the thin disk formation, as discussed in BKGF. If the thick disk comes from heating of the thin disk, we should expect an increasing scale height with decreasing redshift, and a slower evolution of the disk thickness. Further observations of the thickness evolution will help constrain thick disk formation scenarios. The evolution of the thickness in our sGALS (in the sense that the galaxies become thinner) is driven by the inside-out thin disk formation. At the intermediate epoch, the sGALS show a marginal increase in thickness, by a factor of at ; galaxies settle rapidly to disk morphologies after their last “significant” merger (i.e. a merger likely to alter the morphology of the galaxy).
Numerical heating is an issue when considering vertical structure in numerical simulations, but we have reason to believe that our results are not affected significantly. Previous studies at similar resolution to ours have shown numerical vertical heating to be relatively low (Font et al. 2001; Mayer 2004). Figure 2 of BGMK shows the vertical velocity dispersion versus age for four sGALS in this study, which demonstrates relatively little vertical heating during the disks’ quiescent period; in the order of 20% over the last Gyrs. Even if this were totally attributed to numerical heating (unlikely as processes such as spiral structure and substructure heating will contribute), our results will not be greatly affected, because the vertical scale height is proportional to the square root of the velocity dispersion, i.e (e.g. Bottema 1993). Our measured scale height at will be, in the worst case, overestimated by 10%. As far as relevance to our study, the important point that we note is that any artificial heating will not affect our results qualitatively. In the absence of such effects, our conclusions that our simulated disk galaxies become flatter ( decreases) will hold. Our quantitative estimates would then be underestimating this effect. Having said this, higher resolution studies will increase the reliability of the quantitative estimates
The way that the structural parameters, scale length and scale height, evolve relative to one another can be ascertained from Figure 7. Also plotted as crosses are observations of local disk galaxies from Schwarzkopf & Dettmar (2000). Plotted as open circles are observations of 34 edge-on disk galaxies at 1, taken from RDC. The disk galaxies of RDC are found to be smaller and thicker than local galaxies, as determined by previous studies, such as Schwarzkopf & Dettmar (2000), de Grijs (1998), Kregel et al. (2002) and Bizyaev & Mitronova (2002). Our sGALS evolve in this plot primarily by increasing in scale length, with less evolution in scale height, resulting in galaxies evolving across this diagram, from left to right.
Central surface brightness, again in the rest frame in the -band, is derived by extrapolating the exponential fits from Figure 5 to . Results are shown in column 7 of Table 2. We find that our sGALS are brighter at earlier epochs, with an average at , compared with at , and at . This is related to the higher star formation rates at the earlier epochs in our sGALS, as shown in Figure 5 of BGMK. This is consistent with observations, which point to star formation rates being higher at earlier epochs (e.g. Madau et al. 1996; Hammer et al. 1997; Flores et al. 1999; Juneau et al. 2005). We plot the -band central surface brightness against the flatness parameter, (the inverse of the thickness parameter), in Figure 8. The sGALS have higher surface brightness and are thicker at earlier times, closer to the merging epochs when the thick disks formed. As the thin disk grows larger in the more quiescent later stages of their evolution, the sGALS become less bright, and also thinner. At each epoch, it is also apparent that brighter sGALS are thicker, although this trend is not as strong as the trend with time, because the sGALS we have studied are all relatively quiescent throughout the epoch during which evolution is followed in this study. This supports the conclusions of RDC, who plotted the relation between and central surface brightness of galaxies (their Fig .7), and found that the brightest objects have the thickest disk. They speculated that enhanced star formation and enhanced thickness are the results of ongoing interactions and mergings.
We derive the stellar mass of each sGAL at each epoch using the friends-of-friends algorithm, and confirm that sensitivity to our choice of linking length is insignificant. Results are displayed in column 4 of Table 2. The inside-out nature of the growth of the thin disk in our sGALS is apparent in the relationship between the stellar mass and scale length, shown in Figure 9. The mass and size of the sGALS grow together. Although we do not want to overemphasize the quantitative nature of our results, using just four relatively homogeneous L∗ sGALS, we note that the ratio does not evolve, with the average at each epoch staying remarkably close to . Qualitatively, it is clear that the thin disks of our sGALS increase in size as they grow in mass, and the disk evolves along the mass scale length relation.
| redshift | SGAL | (mag) | (M⊙) | (mag/arcsec2) | (kpc) | (kpc) | |||
|---|---|---|---|---|---|---|---|---|---|
| sGAL1 | -19.5 | 2.91010 | 1.7 | 1.0 | 23.3 | 0.70 | 4.5 | 0.16 | |
| sGAL2 | -19.6 | 3.01010 | 1.7 | 1.0 | 22.1 | 0.59 | 3.7 | 0.16 | |
| sGAL3 | -20.2 | 6.61010 | 1.8 | 1.1 | 21.4 | 0.60 | 3.5 | 0.17 | |
| sGAL4 | -19.6 | 3.61010 | 1.7 | 1.0 | 23.9 | 0.70 | 4.6 | 0.15 | |
| mean | -19.7 | 4.0 1010 | 1.7 | 1.0 | 22.7 | 0.65 | 4.1 | 0.16 | |
| sGAL1 | -20.3 | 2.41010 | 1.5 | 0.9 | 22.2 | 0.64 | 3.8 | 0.17 | |
| sGAL2 | -20.6 | 2.4 1010 | 1.3 | 0.8 | 21.0 | 0.60 | 2.7 | 0.22 | |
| sGAL3 | -21.0 | 5.91010 | 1.5 | 0.9 | 20.6 | 0.56 | 3.2 | 0.18 | |
| sGAL4 | -20.3 | 3.21010 | 1.5 | 0.9 | 23.2 | 0.67 | 4.2 | 0.16 | |
| mean | -20.6 | 3.51010 | 1.5 | 0.9 | 21.8 | 0.62 | 3.5 | 0.18 | |
| sGAL1 | -20.9 | 2.11010 | 1.1 | 0.7 | 21.8 | 0.69 | 3.2 | 0.22 | |
| sGAL2 | -20.9 | 1.41010 | 0.9 | 0.6 | 20.7 | 0.51 | 2.2 | 0.23 | |
| sGAL3 | -21.6 | 5.01010 | 1.3 | 0.8 | 20.2 | 0.75 | 3.0 | 0.25 | |
| sGAL4 | -21.1 | 2.71010 | 1.2 | 0.8 | 21.6 | 0.58 | 3.1 | 0.22 | |
| mean | -21.1 | 2.81010 | 1.1 | 0.7 | 21.0 | 0.63 | 2.9 | 0.23 |
4 SUMMARY AND CONCLUSION
The evolution of individual galaxies cannot be observed directly, but lookback studies are providing increasing information on properties of populations of “like” galaxies, out to redshift 1 and beyond. These studies remain difficult, in large part because it is unclear how to select which galaxies should be compared at each epoch. In addition, there are large uncertainties involved in correcting for dust and cosmological dimming, especially in the case of edge-on disk galaxies.
Several recent studies have compared the observed evolution of disk galaxy properties with semi-analytic and infall type models. For example, Barden et al. (2005) and Trujillo et al. (2005) show that one of the most basic assumptions of the semi-analytic approach, where disk size scales in proportion to the virial radius of the dark halo (Mo, Mao, & White, 1998), is at odds with observations; the observed size evolution is weaker than the predicted , where is the Hubble parameter as a function of redshift. The infall model of Bouwens & Silk (2002) assumes a star formation rate at each radius and time, according to the local density (Schmidt 1959), and the infall of metal-free gas. This model is able to match observations of the size evolution, at given luminosity, out to (Trujillo et al. 2005). In order to explain the evolution of disk galaxies, the necessity of accounting for effects such as mass build up, star formation, energy feedback, and gas infall self-consistently within a CDM hierarchical framework, motivates us to confront observations with direct numerical simulations.
We examine four simulated disk galaxies (sGALS), and do so in an idealized manner, free from the difficulties posed in observation. Our sGALS form thick disks at high redshift () during a period of mergers of gas rich “building blocks” (BKGF), and rapidly settle into a disk galaxy morphology by . We examine their subsequent evolution to the present, comparing various properties of the galaxies at high (), intermediate (), and zero redshift, where we find clear trends. Our main results are:
-
•
Scale heights of disk galaxies show no evolution after . Scale lengths increase slowly, resulting in flatter disks at later times. This is consistent with the observations of RDC, who find that disk galaxies at are smaller than present-day galaxies, and have a thickness ratio, larger by a factor of .
-
•
The “inside-out” growth of disks is reflected in the scale length increasing roughly proportional to the stellar mass, resulting in little to no evolution of the mass-size relation. This is consistent with interpretations of Trujillo & Aguerri (2004); Barden et al. (2005); Trujillo et al. (2005). Previously, few direct numerical studies have probed these issues. In a study of sGALS of various morphologies in a fully self-consistent CDM simulation, Sommer-Larsen, Götz, & Portinari (2003) examined two disk galaxies, and found that while one clearly evolved inside-out, the other evolves outside-in. Samland & Gerhard (2003) examine the build up of disk galaxies through a spherical gas infall model, perhaps an idealization of the quiescent period of disk galaxy formation, and finds that disks form inside-out.
-
•
Disk sGALS become more massive, less bright, and redder between redshifts and 0. The evolution of the luminosity of disk galaxies remains observationally controversial, with selection effects largely determining interpretations (for a discussion see Barden et al. 2005). The mass build up in this epoch is relatively quiescent, with aging stellar populations and high metallicity stars born in the disk accounting for the galaxy reddening.
-
•
Rapid periods of star formation due to mergers and interactions can result in both thickening of the disk, and galaxy brightening (see Figure 8). This is consistent with the results of RDC, as well as local observations which show that interacting galaxies are thicker (Reshetnikov & Combes 1997), and that a correlation exists between central surface brightness and “thickness,” in the sense that higher surface brightness galaxies are thicker (Bizyaev 2000; Bizyaev & Mitronova 2002; Bizyaev & Kajsin 2004).
The quantitative results of our study are summarized in Table 2. These results are subject to uncertainties inherent in our models, such as star formation and feedback prescriptions. Also, our simulations do not cover the range of galaxy masses, sizes, morphologies, and histories of the large observed populations. We therefore feel that more modeling of a greater population of high- and low-redshift sGALS within a fully cosmological simulation is required in order to make more meaningful quantitative predictions. Having said this, clear trends have emerged in this study of the evolution of the properties of disk sGALS formed in a hierarchical, Cold Dark Matter Universe.
References
- Abadi et al. (2003) Abadi, M. G., Navarro, J. F., Steinmetz, M., Eke, V. R. 2003, ApJ, 591, 499
- Barden et al. (2005) Barden M. et al. 2005, preprint (astro-ph/0502416)
- Bizyaev (2000) Bizyaev, D. 2000, Sov. Astron. Lett, 26, 219
- Bizyaev & Kajsin (2004) Bizyaev, D., & Kajsin, S. 2004, ApJ, 613, 886
- Bizyaev & Mitronova (2002) Bizyaev, D., & Mitronova, S. 2002, A&A, 389, 795
- Böhm et al. (2004) Böhm, A. et al. 2004, A&A, 420, 97
- Bottema (1993) Bottema, R. 1993 A&A, 275, 16
- Bouwens & Silk (2002) Bouwens, R., & Silk, J. 2002, ApJ, 568, 522
- Brook et al. (2005) Brook, C. B., Gibson, B. K., Martel, H., & Kawata D. 2005, ApJ, in press (BGMK)
- Brook et al. (2004a) Brook, C. B., Kawata, D., Gibson, B. K., & Flynn C. 2004a, MNRAS, 349, 52
- Brook et al. (2004b) Brook, C. B., Kawata, D., Gibson, B. K., & Freeman K. 2004b, ApJ, 612, 894 (BKGF)
- Dalcanton, Spergel, & Summers (1997) Dalcanton, J. J., Spergel, D. N., & Summers, F. J. 1997, ApJ, 482, 659
- de Grijs (1998) de Grijs, R. 1998, MNRAS, 299, 595
- Elmegreen et al. (2005) Elmegreen, D. M., Elmegreen, B. G., Rubin, D. S., & Schaffer, M. A. 2005, ApJ, 631, 85
- Fall & Efstathiou (1980) Fall, S. M., & Efstathiou, G. 1980, MNRAS, 193, 189
- Ferguson et al. (2004) Ferguson, H. C. et al. 2004, ApJ, 600, L107
- Flores et al. (1999) Flores, H. et al. 1999, ApJ, 595, L9
- Font et al. (2001) Font, A. S., Navarro, J. F., Stadel, J., & Quinn, T. R. 2001, ApJ, 563L, 1
- Governato et al. (2005) Governato, F., Stitson, G, Wadsley, J., Quinn, T. 2005, Proceedings for the Vth Marseille International Cosmology Conference: The Fabulous Destiny of Galaxies
- Governato et al. (2004) Governato, F. et al. 2004, ApJ, 607, 688
- Hammer et al. (1997) Hammer, F. et al. 1997, ApJ, 481, 49
- Juneau et al. (2005) Juneau, S. et al. 2005, ApJ, 619, L135
- Kawata & Gibson (2003) Kawata, D., & Gibson, B. K. 2003, MNRAS, 340, 908
- Katz & Gunn (1991) Katz, N., & Gunn, J. E. 1991, ApJ, 377, 565
- Katz (1992) Katz, N. 1992, ApJ, 391, 502
- Kodama & Arimoto (1997) Kodama T., & Arimoto N. 1997, A&A, 320, 41
- Kregel et al. (2002) Kregel, M., van den Kruit, P. C., & de Grijs, R. 2002, MNRAS, 311, 565
- Lilly et al. (1998) Lilly, S. et al. 1998, ApJ, 500, 75
- Madau et al. (1996) Madau, P., Ferguson, H. C., Dickinson, M. E., Giavalisco, M., Steidel, C. C., & Fletcher, A. 1996, MNRAS, 283, 1388
- Mayer (2004) Mayer, L. 2004, in Baryons in Dark Matter Haloes, Novigrad, Croatia, 5-9 October 2004, Proc.Sci. BDMH2004 037
- Mo, Mao, & White (1998) Mo, H. J., Mao, S., & White, S. D. M. 1998, MNRAS, 295, 319
- Navarro & White (1993) Navarro, J. F., & White, S. D. M. 1993 MNRAS, 265, 271
- Okamoto et al. (2005) Okamoto, T., Eke, V. R., Frenk, C. S., & Jenkins, A. 2005, preprint (astro-ph/0503676)
- Padmanabhan (1993) Padmanabhan, T. 1993, Structure Formation in the Universe (Cambridge: Cambridge University Press)
- Peebles (1969) Peebles, P. J. E. 1969, ApJ, 155, 393
- Ravindranath et al. (2004) Ravindranath, S. et al 2004, ApJ, 604, L9
- Renda, Gibson, & Kawata (2005) Renda, A., Gibson, B. K., Mouhcine, M., Ibata, R. A., Kawata, D., Flynn, C., & Brook, C. B. 2005, submitted to MNRAS
- Reshetnikov & Combes (1997) Reshetnikov, V. P., & Combes, F. 1997, A&A, 324, 80
- Reshetnikov, Dettmar & Combes (2003) Reshetnikov, V. P., Dettmar, R.-J. & Combes, F. 2003, A&A, 399, 879 (RDC)
- Robertson et al. (2004) Robertson, B., Yoshida, N., Springel, V., & Hernquist, L. 2004, ApJ, 606, 32
- Roche et al. (1998) Roche, N., Ranatunga, K., Griffiths, R. E., Im, M., & Naim, A. 1998, MNRAS, 293, 157
- Samland & Gerhard (2003) Samland, M., & Gerhard, O. E. 2003, A&A, 399, 961
- Schade et al. (1996) Schade, D., Lilly, S. J., Le Fèvre, O., Hammer, F., & Crampton, D. 1996, ApJ, 464, 79
- Schmidt (1959) Schmidt, M. 1959, ApJ, 129, 243
- Schwarzkopf & Dettmar (2000) Schwarzkopf, U., & Dettmar, R.-J. 2000, A&AS, 144, 85
- Shen et al. (2003) Shen, S., Mo, H. J., White, S. D. M., Blanton, M. R., Kauffmann, G., Voges, W., Brinkmann, J., & Csabai, I. 2003, MNRAS, 343, 978
- Simard et al. (1999) Simard, L. et al. 1999, ApJ, 519, 563
- Sommer-Larsen & Dolgov (2001) Sommer-Larsen, J., & Dolgov, A. 2001, ApJ, 551, 608
- Sommer-Larsen, Götz, & Portinari (2003) Sommer-Larsen, J., Götz, M., & Portinari, L. 2003, ApJ, 596, 47
- Sommer-Larsen, Gelato, & Vedel (1999) Sommer-Larsen, J., Gelato, S., & Vedel. H. 1999, ApJ, 519, 501
- Steinmetz & Navarro (2002) Steinmetz, M., & Navarro, J. F. 2002, NewA., 7, 155
- Thacker & Couchman (2000) Thacker, R. J., & Couchman, H. M. P. 2000, ApJ, 545, 728
- Trujillo & Aguerri (2004) Trujillo, I., & Aguerri, J. A. L. 2004, MNRAS, 355, 82
- Trujillo et al. (2005) Trujillo, I. et al. 2005, submitted to ApJ (astro-ph/0504225)
- Vogt et al. (1996) Vogt, N. P., Forbes, D. A., Phillips, A. C., Gronwall, C., Faber, S. M., Illingworth, G. D., & Koo, D. C. 1996, ApJ, 604, 521
- Weil, Eke, & Efstathiou (1998) Weil, M. L., Eke, V. R., & Efstathiou, G. 1998, MNRAS, 300, 773
- White & Rees (1978) White, S. D. M., & Rees, M. J. 1978, MNRAS, 183, 341