Mars Odyssey Joins The Third Interplanetary Network
Abstract
The Mars Odyssey spacecraft carries two experiments which are capable of detecting cosmic gamma-ray bursts and soft gamma repeaters. Since April 2001 they have detected over 275 bursts and, in conjunction with the other spacecraft of the interplanetary network, localized many of them rapidly and precisely enough to allow sensitive multi-wavelength counterpart searches. We present the Mars Odyssey mission and describe the burst capabilities of the two experiments in detail. We explain how the spacecraft timing and ephemeris have been verified in-flight using bursts from objects whose precise positions are known by other means. Finally, we show several examples of localizations and discuss future plans for the Odyssey mission and the network as a whole.
1 Introduction
Interplanetary networks (IPNs) have played an important role in the studies of both cosmic gamma-ray bursts (GRBs) and soft gamma repeaters (SGRs) for over two decades. Indeed, until the launch of BeppoSAX in 1996, the only way to derive arcminute positions for these objects was by comparing their arrival times at distant spacecraft. The current (third) IPN was formed when the Ulysses spacecraft was launched in 1990. Over 25 spacecraft have participated in the IPN since then, and the latest interplanetary mission to join the network is Mars Odyssey . It seems fitting that this spacecraft should belong to the IPN, since “Odyssey” and “Ulysses” both refer to the same saga of distant voyages. Today, the IPN comprises the Ulysses, Konus-Wind, Ramaty High Energy Solar Spectroscopic Imager (RHESSI), High Energy Transient Explorer (HETE), Swift, and Mars Odyssey (MO) missions and experiments, and, with a detection rate of 200 events/year, is responsible for most GRB and SGR detections and localizations. As a distant point in the network, MO plays a crucial role: without it, only localizations to annuli or large error boxes would be possible. The triangulation, or arrival-time analysis method for localizing bursts has been presented elsewhere (Hurley et al. 1999a,b). In this paper, we concentrate on the properties of the two MO experiments which make burst detection possible. We note that this is the fifth attempt, and the first successful one, to place a GRB detector in Mars orbit; the four previous attempts, aboard the Phobos 1 & 2 (Sagdeev and Zakharov 1990) , Mars Observer (Metzger et al. 1992), and Mars ’96 (Ziock et al. 1997) missions, met with limited or no success due to mission failures.
2 The Mars Odyssey Mission
The Mars Odyssey mission is an orbiter whose objective is to provide a better understanding of the climate and geologic history of Mars. It was launched on 2001 April 7, and after a 6 month cruise phase, reached Mars on 2001 October 24. The mission then entered an aerobraking phase to circularize the orbit which lasted until 2002 January. At the end of this phase, the spacecraft was orbiting the planet every 1.964 h at an altitude between 370 and 432 km (Saunders et al. 2004). The prime scientific mission then commenced, and at present, Odyssey is in its first extended mission, which will continue through 2006 September; a mission extension beyond that date is likely.
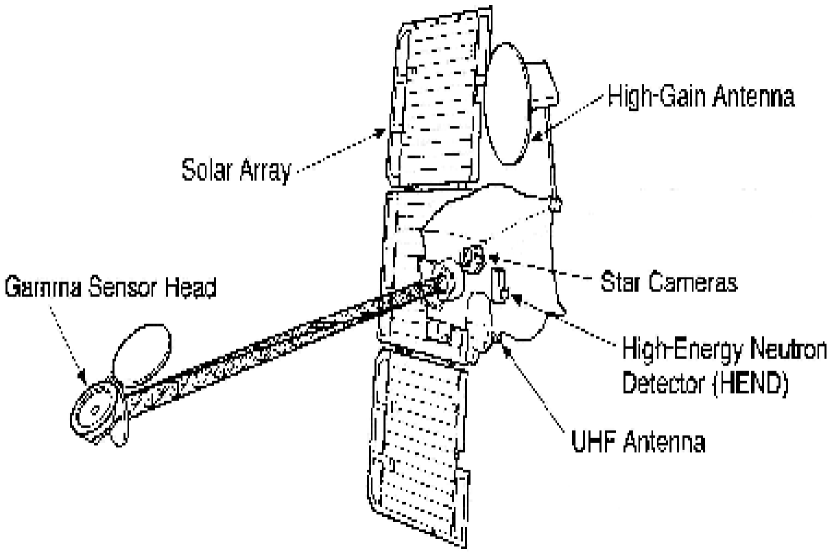
The spacecraft is shown in figure 1. In its present orbit, Mars subtends approximately 27% of the sky (62 half-angle) at the Odyssey spacecraft. In general, the instruments are powered on continuously, and almost 100% of the data is downlinked through the Deep Space Network during daily tracking passes. A more complete description of the mission has appeared in Saunders et al. (2004).
2.1 The Gamma Sensor Head and the High Energy Neutron Detector
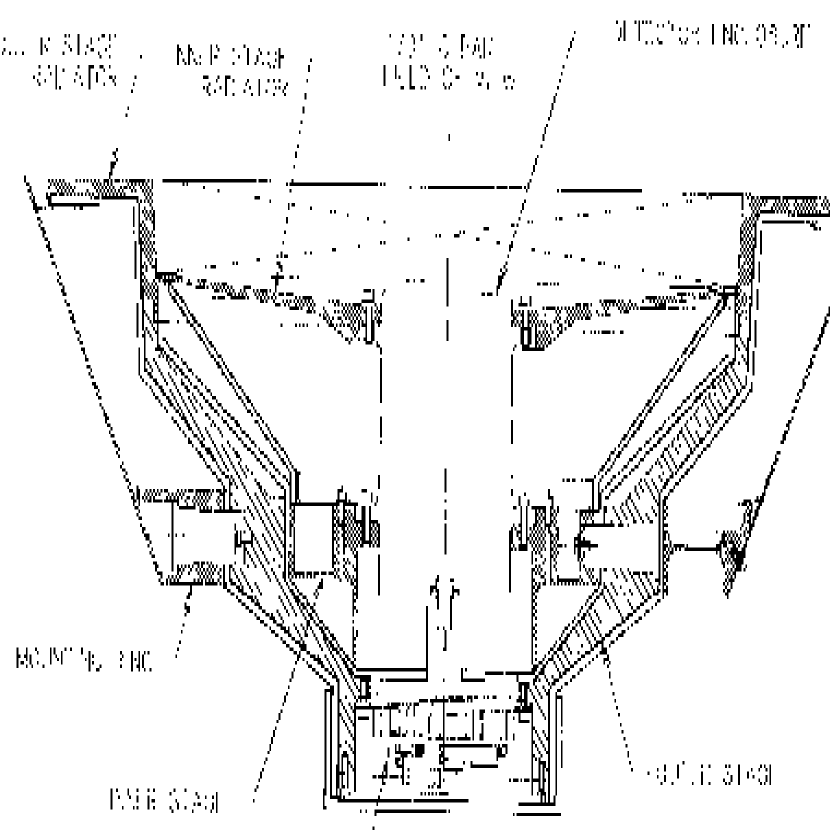
The Gamma-Ray Spectrometer (GRS) is an instrument suite which includes two detectors with GRB detection capabilities, the gamma sensor head (GSH), and the High Energy Neutron Detector (HEND). The principal objective of the GRS experiment is the determination of the elemental abundances on Mars. The GSH consists of a 6.7 cm diameter 6.7 cm high (cross sectional area to GRBs 40 cm2) right circular cylindrical germanium detector which is passively cooled and mounted on a boom extending 6 m from the body of the spacecraft. It records energy spectra between 50 keV and 10 MeV in a low time resolution mode (20 s) until triggered by a burst. It then records GRB time histories in a single energy channel with 32 ms resolution for 19.75 s, and can retrigger immediately thereafter. The boom extension and detector cooling did not take place until after the end of the aerobraking phase, and thus the experiment did not collect useful GRB data until then. The in-orbit background rate is 100 c/s in the GRB energy channel, but it undergoes variations due to numerous causes. In order of decreasing importance, these are a) the albedo from the cosmic gamma-ray background from the Martian surface, which is different for different regions of the planet, b) seasonal changes on month timescales such as CO2 condensation in the polar cap regions (which suppresses the upcoming gamma-radiation from the surface of the planet), and c) solar proton events. The GSH is shown in figure 2. More details may be found in Boynton et al. (2004).
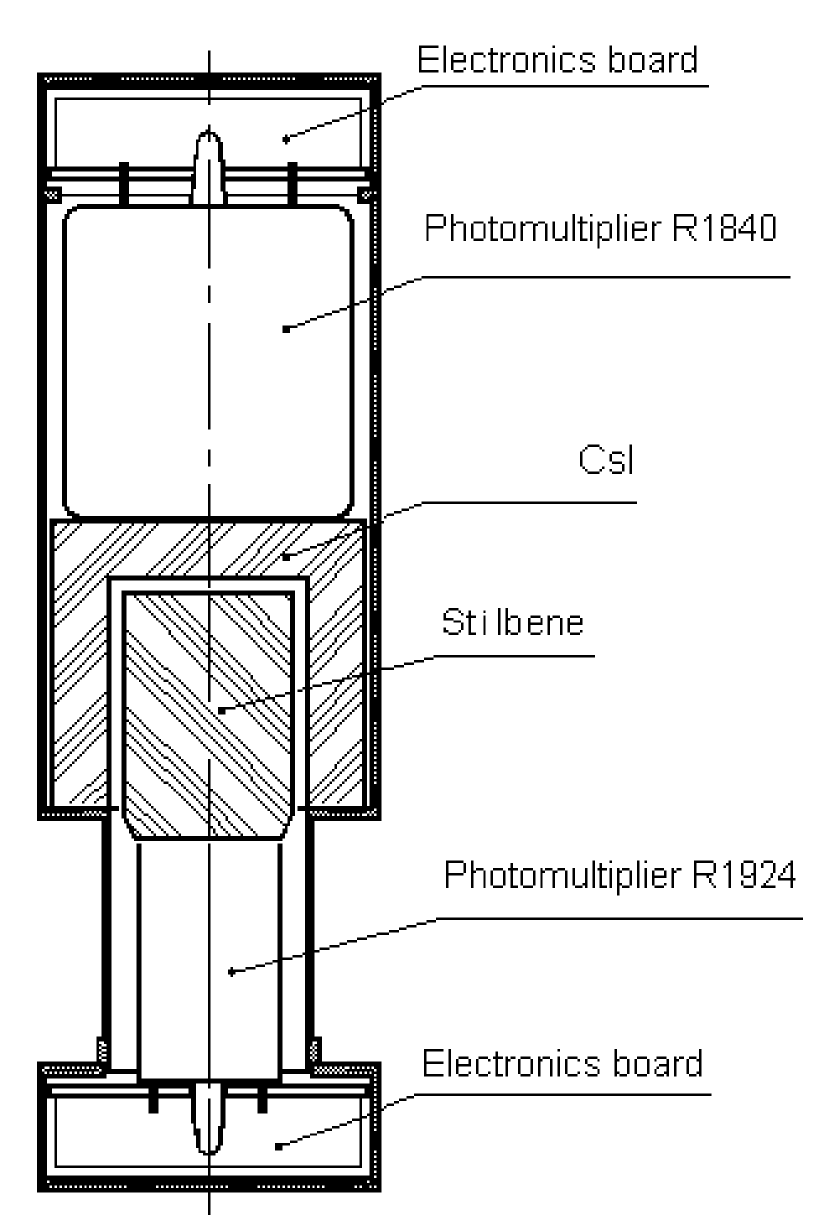
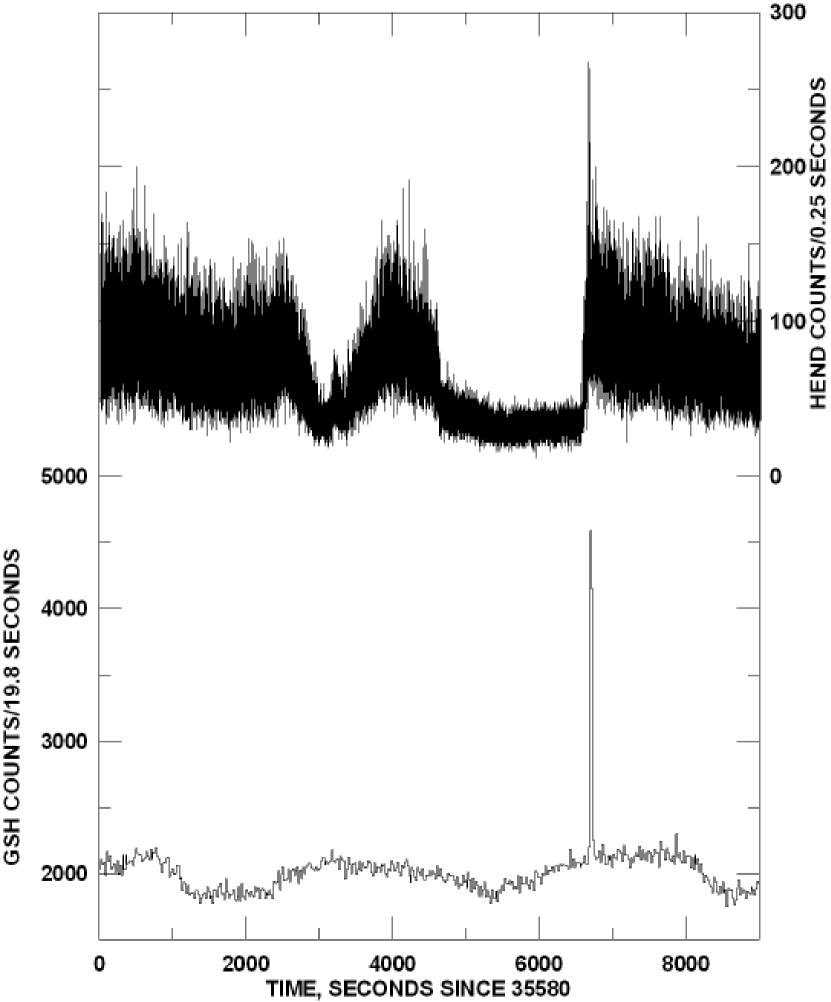
The burst detection portion of the HEND experiment is based on two optically separate scintillation detectors (figure 3). The first is a cylindrical stilbene crystal with a diameter of 30 mm and a height of 10 mm, which is used for the detection of high energy neutrons, and records gamma-rays as a by-product. These counts are measured continuously in the 350-3000 keV range with a time resolution of 1 second. The second detector is a cylindrical CsI(Tl) anti-coincidence well surrounding the stilbene, whose thickness is 10 mm, whose outer diameter is 50 mm, and whose height is 49 mm. Thus its cross-sectional area to GRBs varies between cm2 (on-axis), cm2 (90 off-axis), and cm2 (180 off-axis). In triggered mode, counts from the CsI are recorded in the 30-1300 keV energy range with a time resolution of 250 ms, and these data are used for triangulation. The upper and lower energy limits are only approximate, since the light collection in the cylindrical crystal depends upon the photon interaction point. Energy spectra are not transmitted. The capacity of the counters is limited to 511 counts every 250 ms, so very strong bursts can temporarily saturate the detector. HEND is mounted on the body of the spacecraft. The in-orbit background rates are counts/sec for the inner stilbene detector, and counts/sec for the CsI anticoincidence. Both these rates undergo variations for the same reasons as the GSH, and in addition, because of HEND’s lower energy threshold, due to trapped particles. For example, for a period of approximately 7 months starting on November 11, 2002, the background variations along the orbit increased from their nominal value of about a factor of 2 to a factor of 30. The cause of this increase is suspected to be trapped particles. During this time, the duty cycle for GRB detection decreased by a factor of 3.4. These large variations disappeared around June 9, 2003. Occasionally they reappear rather reduced in strength. A background plot is shown in figure 4. More details of the instrument may be found in Boynton et al. (2004).
3 Burst Detection and Statistics
Bursts are detected in HEND and the GSH in different ways. HEND is equipped with an on-board trigger, but the telemetry allocation made it possible to transmit triggered data continuously. Thus the trigger level was set to a value below the background level, and in effect, the experiment triggers continuously and produces continuous data with 250 ms time resolution. Searches for bursts in the HEND data may therefore be initiated by detections on other IPN spacecraft, and may be carried out in the ground analysis. Every candidate event detected by an IPN spacecraft initiates such a search, and almost all the bursts detected by HEND to date have been found by searching the data in the crossing time window which corresponds to these candidate events. (Thus, for example, in the case of an event detected by Ulysses , the crossing time window is the Mars-Ulysses distance expressed in light-seconds; the maximum distance is 3000 light-seconds.) Up to now, no exhaustive automatic “blind” search for bursts has been carried out in the HEND data, although an algorithm to do this is being developed and tested. GSH burst data, on the other hand, come only from on-board triggers; each trigger initiates a search for a confirming event in the data of the other IPN spacecraft in the appropriate crossing time windows. As high time resolution GSH data are only available for triggered events, it is usually not practical to search the data for bursts detected by other spacecraft.
HEND was turned on during the cruise phase and detected its first confirmed GRB on 2001 May 8. In the 1520 days which followed, HEND and/or GRS have detected 275 GRBs or SGRs which have been confirmed by detection aboard at least one other IPN spacecraft. Thus the average burst detection rate during the cruise and orbital phases is about one burst every 5.9 d. This number is an average over the entire period, and does not take high background periods, or times when the experiments were turned off, into account. The true rate would therefore be higher. Initially, the spacecraft timing was not determined accurately during the cruise phase and no triangulation results were announced. (These data have since been reprocessed for accurate timing.) Thus the Odyssey mission became most useful to the IPN when it entered its orbital phase; at that point its separation from Earth was large enough for the triangulation method to produce small error boxes, and the timing was known to good accuracy in real time. The typical IPN annulus width as a function of time over the mission is shown in figure 5.
The GRB detection rate by 3 widely separated spacecraft (that is, Mars Odyssey, Ulysses, and any near-Earth mission) is about 1 every 7 days. It is interesting to note that this rate is identical to that which was obtained when the Near Earth Asteroid Rendezvous (NEAR) mission was the other distant spacecraft in addition to Ulysses . These numbers do not depend strongly upon any comparison of the MO and NEAR instrument sensitivities, for the following reason. Due to its small size, Ulysses tends to be the least sensitive detector in the network. We are counting only those bursts which were detected by Ulysses, a near-Earth spacecraft, and another, distant spacecraft. As long as the sensitivities of the near-Earth and the distant spacecraft are greater than that of Ulysses , the burst rate is determined primarily by Ulysses’ sensitivity, rather than by that of the other detectors.
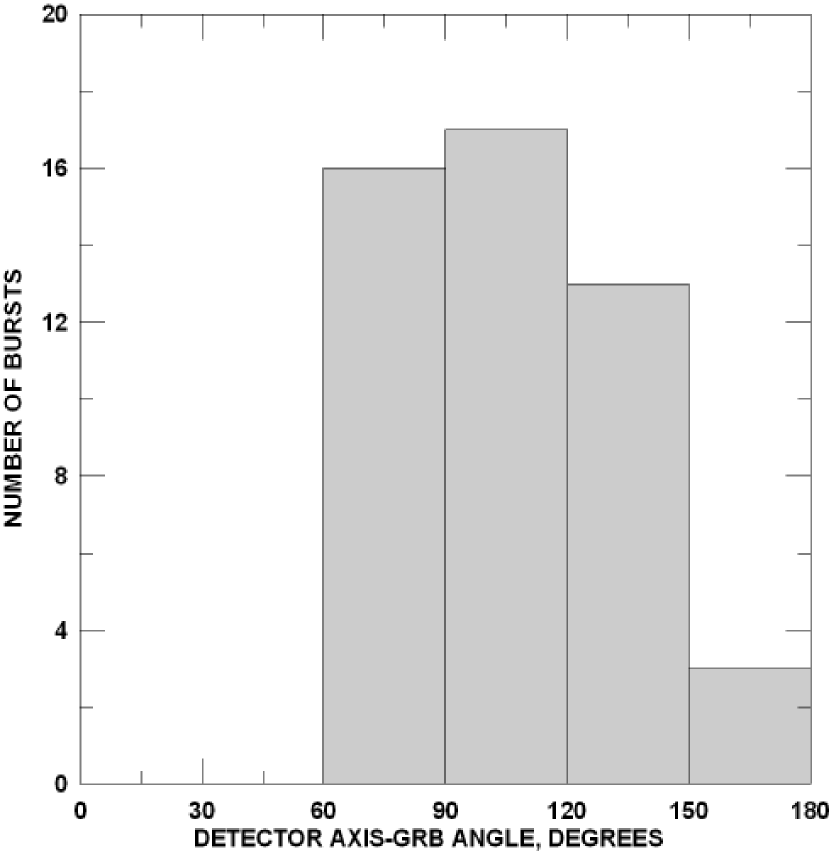
Figure 6 presents the distribution of the angles between the HEND detector axis, which is always pointed towards Mars in the orbital phase of the mission, and the GRBs detected by it. This distribution agrees with the wide field of view of the CsI anticoincidence, which is limited mainly by the Mars horizon; the body of the spacecraft blocks a small fraction of the sky with relatively low atomic number materials.
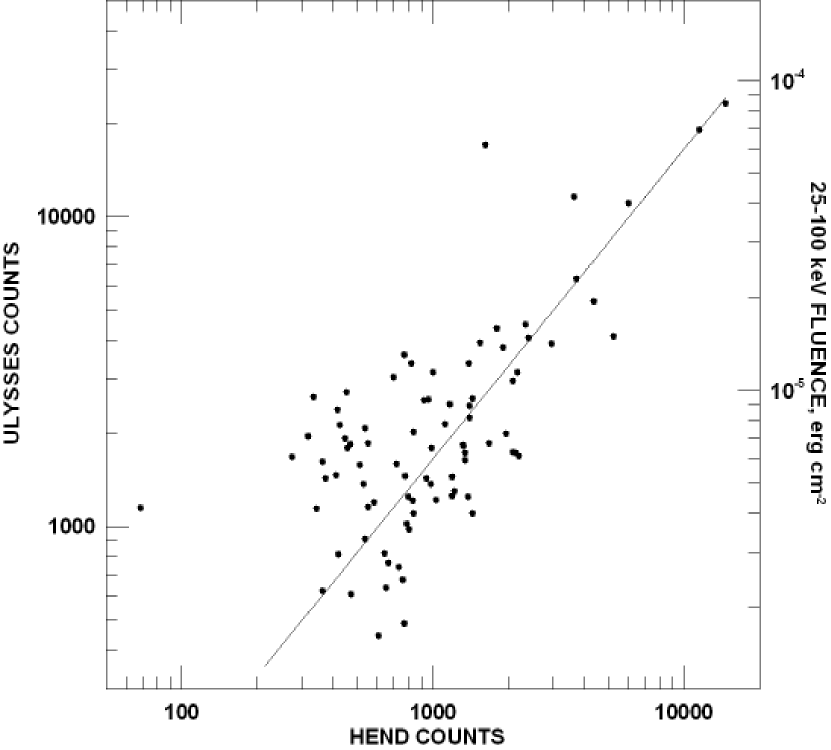
Figure 7 compares the count rates for events detected by HEND and Ulysses . Since the HEND count rate is roughly proportional to that of Ulysses , this relation can be used for an approximate estimate of the fluence of HEND bursts. The weakest confirmed GRB detected by HEND to date had a fluence of about .
4 Verifying the IPN results
Whenever a new spacecraft enters the network, both its timing and its ephemeris must be verified in-flight. There are various ways to do this, but the most effective end-to-end test is to triangulate bursts whose positions are known with greater precision than that obtainable from the IPN alone. This includes events (cosmic or SGR) localized with X-ray cameras, and events with radio, X-ray, or optical counterparts. To date, 12 GRBs which meet one or more of these criteria, 5 bursts from SGR1900+14, and 14 bursts from SGR1806-20 have been used to verify Odyssey’s timing and ephemeris. In these verifications, the triangulation is usually done using Odyssey and a near-Earth spacecraft, for which station-keeping is much simpler and more accurate, so that the timing and ephemeris uncertainties for this spacecraft are negligible.
When such events are triangulated, a “time shift” can be derived, which is the amount of time which would have to be added to the Odyssey time to obtain perfect agreement between the annulus derived from the Odyssey data, and the known source position. This time shift is therefore a measure of the combination of statistical and systematic uncertainties in the triangulation. The statistical uncertainty depends only on the statistics of the two time histories which are being compared, and it is estimated in the cross-correlation analysis. The systematic uncertainty in these triangulations, which is a combination of timing and ephemeris errors, is always found to be much less than the statistical one.
5 Some scientific highlights
5.1 GRB020405
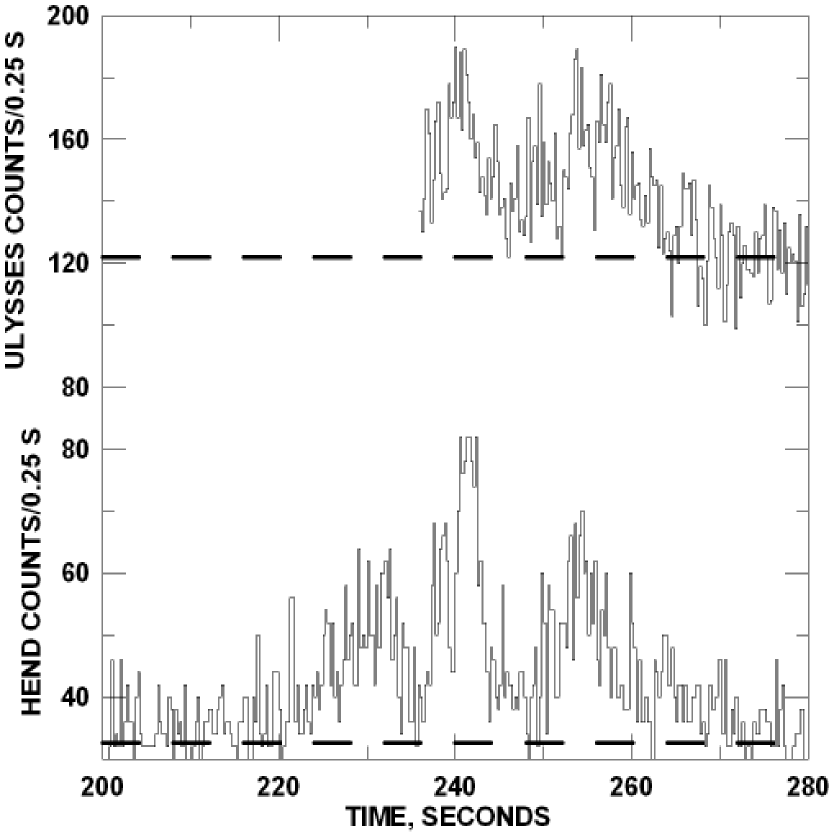
This event was observed by Ulysses, Mars Odyssey, Konus, and BeppoSAX (the GRBM experiment). The HEND and Ulysses time histories are shown in figure 8. The first localization, to a 75 square arcminute error box, was produced within 16.6 hours (Hurley et al., 2002a). Multi-wavelength observations of the afterglow were carried out by numerous ground- and space-based telescopes. An optical transient was identified in the error box (figure 9), and a redshift of 0.695 was found for it (Masetti et al. 2003). A bump in the optical afterglow light curve advanced the case for a supernova/GRB connection (Dado, Dar, and de Rujula 2002; Masetti et al. 2003; Price et al. 2003). Polarization studies of the optical afterglow were used to constrain the dust content of the host galaxy (Covino et al. 2002). Masetti et al. (2003) achieved the first detection of an afterglow in the NIR bands, and the first detection of a galaxy responsible for an intervening absorption line system in the spectrum of a GRB afterglow. Observations of a radio flare and of the the X-ray afterglow were used to deduce the nature of the surrounding medium (Berger et al. 2003; Mirabal et al. 2003; Chevalier et al. 2004).
5.2 GRB020813
This event was observed by Ulysses, Mars Odyssey, Konus, , and HETE. The HETE WXM and SXC produced localizations (Villasenor et al. 2002) which were used by Fox, Blake, and Price (2002) to identify the optical counterpart, whose redshift was measured to be 1.2 (Price et al. 2002). The IPN error box had an area of 33 square arcminutes, and was circulated 24 hours after the burst (Hurley et al. 2002b,c). It constrains the HETE positions, agrees with the optical position (figure 10), and serves both to verify them, and to confirm the Odyssey timing and ephemeris.
5.3 GRB021206
This event was detected by Ulysses, Mars Odyssey, Konus, RHESSI, and INTEGRAL (Hurley et al. 2002d, 2003). Polarization was detected in gamma-rays for this burst by RHESSI (Coburn and Boggs 2003; but see also Rutledge and Fox, 2004 and Coburn and Boggs, 2004), and the burst time history was used to set limits on the quantum gravity energy scale (Boggs et al. 2004). This event is a good example of the utility of the IPN technique. The IPN as a whole has isotropic response, and this burst occurred only 18 degrees from the Sun. Thus it is unlikely that it could have been detected and localized by INTEGRAL, HETE, or Swift due to pointing constraints. Since RHESSI is the only spacecraft which has a demonstrated polarization measurement capability, and it points in the solar direction, only IPN-localized bursts can benefit from polarization measurements.
5.4 The giant flare from SGR1806-20
An event which occurred on 2004 December 27 was the most intense burst of X- and gamma-radiation detected to date (Hurley et al. 2005). Although it was observed by at least 20 spacecraft, none of them could localize it. The precise localization, which was a key element in identifying the source, was done by triangulation using Odyssey. The burst turned out to be a giant flare from SGR1806-20. This SGR was only about 5 °from the Sun at the time of the burst.
6 Conclusions
The GSH and HEND experiments aboard the Mars Odyssey spacecraft have been successfully integrated into the third interplanetary network. In this configuration, the IPN is producing rapid, precise GRB localizations at the expected rate, and should continue to do so for the forseeable future. With the advent of newer missions, with much greater sensitivities, and which are capable of independently determining GRB positions to better accuracies and with shorter delays, the question inevitably arises whether it is useful to maintain an IPN. There are several arguments in favor of this. The new missions achieve their accuracy and sensitivity at the expense of sky converage; typically they view only 10 - 20% of the sky, while the IPN is isotropic. Thus, first, IPNs serve as continuous monitors of SGR activity throughout the galaxy, which the newer missions do not. Second, IPNs will detect strong bursts at a rate which is 5-10 times greater than that of the newer missions. Therefore IPNs should continue to serve a useful role in GRB and SGR studies for years to come.
7 Acknowledgments
We are grateful to John Laros for the initial work which made GRB detection possible aboard Odyssey. KH acknowledges support under the NASA Long Term Space Astrophysics and Odyssey Participating Scientist programs, FDNAG-5-11451.
References
- (1)
- (2) Berger, E., Soderberg, A., Frail, D., and Kulkarni, S., 2003, Ap. J. 587, L5
- (3)
- (4) Boggs, S., Wunderer, C., Hurley, K., and Coburn, W., 2004, Ap. J. 611, L77
- (5)
- (6) Boynton, W., et al. 2004, Space Sci. Rev. 110, 37
- (7)
- (8) Chevalier, R., Li, Z-Y., and Fransson, C., 2004, Ap. J. 606, 369
- (9)
- (10) Coburn, W., and Boggs, S., 2003, Nature 423, 415
- (11)
- (12) Coburn, W., and Boggs, S., 2004, Mon. Not. R. Astron. Soc. 350, 1288
- (13)
- (14) Covino, S., et al. 2003, Astron. Astrophys. 400, L9
- (15)
- (16) Dado, S., Dar, A., and De Rujula, A., 2002, Astron. Astrophys. 393, L25
- (17)
- (18) Fox, D., Blake, C., and Price, P., 2002, Gamma-ray Burst Coordinates Network Circular 1470
- (19)
- (20) Hurley, K., et al. 1999a, ApJS 120, 399
- (21)
- (22) Hurley, K., et al. 1999b, ApJS 122, 497
- (23)
- (24) Hurley, K. et al., 2002a, Gamma-ray Burst Coordinates Network Circular 1325
- (25)
- (26) Hurley, K., et al., 2002b, Gamma-ray Burst Coordinates Network Circular 1482
- (27)
- (28) Hurley, K., et al., 2002c, Gamma-ray Burst Coordinates Network Circular 1483
- (29)
- (30) Hurley, K., et al., 2002d, Gamma-ray Burst Coordinates Network Circular 1728
- (31)
- (32) Hurley, K., et al., 2003, Gamma-ray Burst Coordinates Network Circular 2281
- (33)
- (34) Hurley, K., et al., 2005, Nature 434, 1098
- (35)
- (36) Jernigan, J. G., et al., 2002, Gamma-ray Burst Coordinates Network Circular 1494
- (37)
- (38) Masetti, N., et al. 2003, Astron. Astrophys. 404, 465
- (39)
- (40) Metzger, A., Boynton, W., Laros, J., and Trombka, J., 1992, in AIP Conf. Proc. 265, Gamma-Ray Bursts, ed. W. Paciesas & G. Fishman (New York: AIP Press), 353
- (41)
- (42) Mirabal, N., Paerels, F., and Halpern, J., 2003, Ap. J. 587, 128
- (43)
- (44) Price, P., Bloom, J., Goodrich, R., Barth, A., Cohen, M., and Fox, D., 2002, Gamma-ray Burst Coordinates Network Circular 1475
- (45)
- (46) Price, P., et al. 2003, Ap. J. 589, 838
- (47)
- (48) Rutledge, R., and Fox, D., 2004, M.N.R.A.S. 350, 1288
- (49)
- (50) Sagdeev, R.,and Zakharov, A., 1990, Sov. Astron. Lett. 16(2), 125
- (51)
- (52) Saunders, R., et al. 2004, Space Sci. Rev. 110, 1
- (53)
- (54) Villasenor, J., et al. 2002, Gamma-ray Burst Coordinates Network Circular 1471
- (55)
- (56) Ziock, K., et al. 1997, IEEE Trans. Nuc. Sci. 44(4), 1692
- (57)