Outflows and Jets from Collapsing Magnetized Cloud Cores
Abstract
Star formation is usually accompanied by outflow phenomena. There is strong evidence that these outflows and jets are launched from the protostellar disk by magneto-rotational processes. Here, we report on our three dimensional, adaptive mesh, magneto-hydrodynamic simulations of collapsing, rotating, magnetized Bonnor-Ebert-Spheres whose properties are taken directly from observations. In contrast to the pure hydro case where no outflows are seen, our present simulations show an outflow from the protodisk surface at and a jet at after a strong toroidal magnetic field build up. The large scale outflow, which extends up to at the end of our simulation, is driven by toroidal magnetic pressure (spring), whereas the jet is powered by magneto-centrifugal force (fling). At the final stage of our simulation these winds are still confined within two respective shock fronts. Furthermore, we find that the jet-wind and the disk-anchored magnetic field extracts a considerable amount of angular momentum from the protostellar disk. The initial spin of our cloud core was chosen high enough to produce a binary system. We indeed find a close binary system (separation ) which results from the fragmentation of an earlier formed ring structure. The magnetic field strength in these protostars reaches and becomes about at from the center in agreement with recent observational results.
1 Introduction
One of the earliest and most significant manifestations of star formation is the appearance of jets and outflows in the early stages of gravitational collapse (for a review see Bachiller, 1996; Andre et al., 2000). Theoretical work by Blandford & Payne (1982) and Pudritz & Norman (1983) first established the idea that these outflows originate from protostellar disks threaded by magnetic fields. The accretion flow in protostellar disks advect their magnetic field inward while disk rotation leads to field configurations that flings the gas off the disks. Subsequent computational efforts (Shibata & Uchida, 1985; Uchida & Shibata, 1985; Shibata & Uchida, 1986; Stone & Norman, 1992) found large-scale, magnetically launched outflows from collapsing disks around young stellar objects. Detailed magneto-hydrodynamical (MHD) simulations showed that highly collimated, high velocity jets are driven by a Keplerian accretion disk when threaded with magnetic fields (e.g., Ouyed et al., 1997). The large, comprehensive, theoretical and computational literature that has developed in this field over the last decade is discussed in recent reviews (e.g., Konigl & Pudritz, 2000; Heyvaerts, 2003; Pudritz, 2003). Current observations confirm that jets rotate, and carry off angular momentum from their underlying disks (e.g., Bacciotti et al., 2002).
One of the most difficult aspects of star formation is to include both magnetic fields and (the resulting) outflows into the problem. The point is that protostellar disks are themselves the result of the gravitational collapse of rotating cloud cores. Therefore, there should be a profound link between collapse and outflow. Progress has recently come from the advent of sophisticated MHD codes. One the first simulations of collapsing magnetized cloud cores showed that a magnetically driven outflow is launched after strong toroidal magnetic field component is dynamically build up during the collapse of the rotating molecular cloud (Tomisaka, 1998).
More recent simulations of collapsing magnetized cloud cores include the work of Tomisaka (2002); Boss (2002); Matsumoto & Tomisaka (2004); Hosking & Whitworth (2004); Machida et al. (2004); Ziegler (2005); Machida et al. (2005b, a). Differences between these approaches are based on numerical techniques and/or simulated physics. For instance, a static spherical coordinate mesh is used by Boss (2002) where magnetic fields are treated in an approximate way, whereas a Lagrangian magnetohydrodynamic approach is used by Hosking & Whitworth (2004) to address the question of fragmentation of a magnetized protodisk. These groups arrive at different conclusions. The results from the new AMR code NIRVANA by Ziegler (2005) confirmed the findings of Hosking & Whitworth (2004) that magnetic fields tend to stabilize the protodisk and prevent fragmentation. Extensive nested grid simulations performed by Machida et al. (2005b, a) focused also on fragmentation and binary formation and concluded with magnetic flux-spin relations in different regimes that controls fragmentation.
The issue of initial conditions for gravitational collapse and star formation is important, but is, as yet not fully explored in 3D MHD collapse simulations. So far, there is only one simulation of a collapsing magnetized, cloud core that is embedded in a (low density) environment (Matsumoto & Tomisaka, 2004). However, these authors do not focus on the collapse–outflow connection but rather on the important dynamical evolution and relation of the cloud angular momentum and the field geometry. Other simulations are done for an assumed infinite cylindrical cloud (e.g., Tomisaka, 2002; Nakamura & Li, 2003; Machida et al., 2004). Such a cylindrical cloud does not go through an initial phase of magnetic braking. Magnetic braking, even before the collapse phase, has a significant effect on the initial rotation profile and the angular momentum of the cloud (Mouschovias & Paleologou, 1980). Here, we place the cloud core in a warm, low density, environment which is entirely threaded with a background magnetic field. Such cloud cores are frequently seen in observations (see e.g. Ward-Thompson et al., 2002). Moreover, the presence of magnetic fields in molecular cloud cores is well justified by observations (Crutcher et al., 1999).
A far better understood aspect of star formation, at least in principle, is the role of cooling. Most simulations are either based on a pure isothermal equation of state (EOS) or an isothermal-polytropic EOS where the EOS is locally switched whenever the density exceeds a certain critical value. The latter approach, which accounts for the different cooling mechanisms during the collapse phase (e.g. see Larson, 2003), is not without its own difficulties. First, changing the EOS from an isothermal system to a polytropic system corresponds to a change from a system with an infinite heat reservoir to a system with a finite reservoir and is difficult to achieve numerically. Second, cooling by adiabatic expansion of the gas is not correctly taken into account for a polytropic index other than 111Usually, a large scale outflow is accompanied by an expanding “magnetic bubble” where adiabatic cooling might affect its efficiency.. Therefore, in order to achieve a useful step towards a realistic picture of collapsing cloud cores, we incorporate cooling by molecular line emission in our simulations in this paper. This allows us to capture some of the real complexity of the shock system that arises during the collapse phase. We point the reader to Sec. 8 (where we show the effective equation of state as a function of the core density) for further discussion on the necessity of incorporating additional physics into collapse simulations.
In this paper we present a comprehensive and self-consistent picture of the generation of outflow phenomena driven by dynamically enhanced magnetic fields that are build up within collapsing cloud cores. Our study is based on the results of 3D adaptive mesh refinement (AMR) MHD simulations that resolves the collapse of the magnetized, rotating cloud core configurations over 7 decades in physical scale. Here, we focus on the results of our low mass simulation () whose initial conditions are chosen to closely match those of the observed Bonner-Ebert molecular cloud core, Barnard 68 (Alves et al., 2001). We also performed pure hydro simulations (without magnetic fields) with a very similar setup to that reported here (Banerjee, Pudritz, & Holmes, 2004, (BPH04)). We report on the differences and similarities of magnetic/non-magnetic systems within this work.
2 Simulation model and initial conditions
Our initial conditions (see also BPH04 for the hydro setup) resemble the properties of the well studied Bok globule, Barnard 68. Extinction measurements show that the density of this cloud core closely follows a Bonnor-Ebert-profile (Alves et al., 2001) (for a brief review of the Bonnor-Ebert-Sphere see e.g. BPH04). We adopt the values from these measurements for our initial setup: core density , mass of the cloud core , radius (dimensionless Bonnor-Ebert-radius ) , and gas temperature . The sphere is bounded by a warm, low density (density contrast ), ambient medium so that the pressure at the edge of the sphere and that of the ambient gas match. Furthermore, we assume a solid body rotation of the cloud core with an angular velocity of which corresponds to , where is the initial free fall time. We chose this value because hydrodynamic simulations show that cores that spin at rates fragment into rings and then binaries (e.g., Matsumoto & Hanawa, 2003, BPH04).
The initial magnetic field is setup to be parallel to the rotation axis (-axis) which threads the entire simulation box. To account for a magnetic pressure enhancement during core formation we assume a constant thermal-to-magnetic-pressure, , in the equatorial plane with a value of which gives a minimal and maximal field strength of and , respectively. Recent simulations of collapsing, magnetized Bonnor-Ebert-Spheres (Matsumoto & Tomisaka, 2004) showed that the rotation axis will be aligned with the magnetic field during the collapse of the cloud core as the perpendicular (to the magnetic field) component of the angular momentum is extracted more quickly than the parallel component. Therefore, an aligned rotator, as in our case, might be a “natural” configuration of magnetized cloud cores. In order to induce the collapse of the modified Bonnor-Ebert-Sphere above, we enhance the density by 10% to overcome the additional rotational and magnetic component. We observe fragmentation in the self-gravitating disk that forms as a consequence of the collapse. We not add or perturbations however – the numerical perturbations suffice.
We follow the evolution with the grid based 3D MHD code FLASH (Fryxell et al., 2000) which is build on a block structured adaptive mesh refinement technique (Olson et al., 1999). This technique enables us to obey the Truelove criteria (Truelove et al., 1997) wherein the mesh must be fine enough to resolve the local Jeans length by at least 4 grid points in order to prevent spurious (i.e. numerically induced) fragmentation. In our simulations, we resolve the Jeans length by at least 8 grid points. At the end of our simulation we reach 27 refinement levels (the highest refinement level at the beginning of the simulation is 7) which corresponds to a minimal grid spacing of . This should be compared to the length of our simulation box which is . In this high resolution run we are able to study details of the protostellar environment and the fragmentation to a very close binary system (separation ). We performed several lower resolution runs with different magnetic field strengths and different angular velocities. The high resolution simulation presented in this paper, ran for 44 hours on 32 processors on an Alpha SC Server.
2.1 Cooling
As in our hydro simulations (BPH04), we augmented the FLASH code with the ability to cool the gas as it contracts using the self-consistent radiative cooling calculations by Neufeld & Kaufman (1993); Neufeld et al. (1995). So far, our simulations do not include the possible cooling by dust grains coupled to the gas. Cooling of molecular gas by dust grains is very efficient even in the regime if the gas is tightly coupled to grains (see e.g., Goldsmith & Langer, 1978; Goldsmith, 2001). The critical density at which dust cooling becomes inefficient is in the optical thick regime at a density of about after which the core becomes essentially adiabatic (see e.g. Larson, 2003) rather than the value of which is set by the molecular cooling scale. In BPH04 we found that the appearance of shocks results when . A prolonged isothermal collapse phase (due to efficient dust cooling) would shift the appearance of the first shock (see Sec. 4) to higher densities and therefore smaller scales but would not change the basic physical outcome.
We derived the relation between the critical density and the scale height (BPH04, Eq. (21)) at which the shock first appears as
| (1) |
Therefore, we would expect the shock scale to set in at about above the protodisk if the critical density is , compared to our findings which show the shock appearance at . Recent 1D simulations by Lesaffre et al. (2005) including gas and dust cooling indeed find a accretion shock at which is close to the value to which we extrapolate our own results if cooling by dust is included. Simulations by others find also similar shock and/or outflow structures (e.g., Yorke et al., 1995; Tomisaka, 2002; Matsumoto & Tomisaka, 2004). Thus, even without explicit dust cooling in our code, we can confirm that our results should scale. We will explicitly add dust cooling in our future work.
2.2 Ambipolar diffusion
Another physical process which we have not yet accounted for is ambipolar diffusion, the slipping of magnetic field lines relative to neutrals in the weak ion-neutral coupling regime. While many papers have been written about field limitation by ambipolar diffusion (e.g., Ciolek & Mouschovias, 1998; Li, 1998; Desch & Mouschovias, 2001), they have so far focused on spherical or asymmetric configurations with purely poloidal magnetic fields. Moreover, the calculations are done for highly idealized conditions for the ionization balance in such systems. Consider first the effect of rotation. A collapsing rotating core and disk will have a maximum value of the toroidal field near the inner edge of the disk (since the toroidal field on the rotation axis must necessarily vanish) and will have a quadrupolar spatial geometry (cf. Sec. 7). Such toroidal field will exert a pressure gradient force towards the disk mid-plane (in addition to the pressure gradients that drives outflows away from the disk) as well as towards the protostar(s). The latter effect may serve to stabilize the protostellar field and significantly reduce the ambipolar diffusion rate.
Recent numerical simulations have also shown that it is possible to have a strong fossil field within a star that is stable and lies in the range of (Braithwaite & Spruit, 2004). Such a field is stabilized by a ring of toroidal fields that is buried under the stellar surface. This situation somewhat resembles our own simulation results. Thus, the inclusion of full 3D field dynamics may yet show that ambipolar diffusion does not necessarily exclude the formation of a strong fossil field.
A second general point is that the disks that are formed during collapse will generally have well ionized surface layers – even if cosmic rays are the only source for ionization. While ambipolar diffusion should occur in the mid plane, the surface layers of the disk may retain strong fields.
The first direct measurement by Donati et al. (2005) of magnetic fields in the FU Ori accretion disk using Zeeman signatures indicate strong magnetic fields very close to the protostar ( at ). As these authors make clear, the observed magnetic fields are disk-fields and are not generated in the protostar. At least in this case, it appears as if ambipolar diffusion is not effective enough to prevent the trapping of strong magnetic fields in the surface layers of the disk.
3 Magnetic braking in the pre-collapse phase
A spinning, magnetized core undergoes significant magnetic braking even before the collapse begins. In this early phase, some of the core’s initial angular momentum will be carried off by a flux of torsional (Alfvénic) waves which transfer angular momentum from the spinning sphere to the surrounding gas gradually spinning down the sphere. The initial magnetic braking of a spinning cloud core was studied analytically by Mouschovias & Paleologou (1980) for idealized disk-like rotors embedded in a non-rotating environment, and its appearance provides an excellent test of the accuracy of our numerical methods as well. That cores do not co-rotate with their environments has been explicitly shown in many turbulent fragmentation simulations of core formation. The system of oblique shocks that produces a whole spectrum of core masses is also the likely origin of the spin distribution of cores (see e.g., Tilley & Pudritz, 2004).
We present the results of our simulation of this pre-collapsing stage in Fig. 1 where the propagation of the torsional Alfvén wave in the ambient medium is shown. The spin down time of a homogeneous disk embedded in a non-rotating environment with a density contrast is (Mouschovias & Paleologou, 1980)
| (2) |
where is the Alfvén velocity in external medium, and is the disk height. For our setup, this gives a spin down time of , which is in good agreement with our numerical results shown in Fig. 1.
During the pre-collapse phase, the core’s rotation is slowed by a factor of by this magnetic braking mechanism which gives at the time when the major collapse gets underway. The amount of rotation prior to the runaway collapse has an important effect upon the formation of the disk since it determines its size, fiducial density and hence its ability to cool and fragment (e.g., Matsumoto & Hanawa, 2003, BPH04). In particular, for a purely hydrodynamic disk fragments into a ring which further fragments into a binary. We also note that in order to generate sufficiently strong toroidal magnetic fields to get magnetically driven outflows, the spin down time must not be too small. Our simulations with stronger magnetic fields and/or slower initial rotation showed no, or only a weak outflow as the build-up toroidal magnetic field component is not strong enough to power a wind. By comparing the damping time of Eq. (2) to the initial orbital time of the sphere one can estimate whether magnetic braking spins down the sphere too quickly. The condition that the spin-down time not be too short gives (cf. Eq. (18a) in Mouschovias & Paleologou, 1980):
| (3) |
Using this relation can be rewritten as
| (4) |
(in our case ). Simulations where condition Eq. (4) is not or only barely fulfilled result in a more spherical collapse with less pronounced disks and had no tendency to fragment. We conclude from these results that modest to strong magnetic fields stabilize the cloud core and prevent fragmentation during the collapse (see also the discussion in Sec. 7). We note separately that a measure of the toroidal field under these circumstances is given by the expression (Mouschovias & Paleologou, 1980, Eq. (17a))
| (5) |
where is the initial, homogeneous, magnetic field. For our initial setup (Eq. (5)) becomes larger than one at a disk radius of .
4 The initial collapse phase
Initially, the sphere is close to a hydrostatic equilibrium so that the runaway collapse starts only after a substantial amount of the additional rotational support is extracted by magnetic braking (see also, Basu & Mouschovias, 1994, 1995a, 1995b). Here, the time from the beginning of the simulation to the start of the runaway collapse is 222Henceforth, times given in this paper are measured form the beginning of the runaway collapse, i.e. , with .
The first phase of the collapse of magnetized Bonnor-Ebert-Spheres proceeds very similarly to the non-magnetized cases (see also BPH04): initially the rotating cloud core collapses from outside-in isothermally so long as molecular cooling is efficient enough to keep the core on its initial temperature. At densities of about , cooling becomes inefficient and the dense core starts to heat. At this point, a thick disk begins to form. The infalling material undergoes a shock at a height of above and below the disk plane (if dust is included, we expect this scale to be at about ). In this early stage of the collapse ( into the collapse), these shock fronts move steadily towards the center of the core. Not until the core density exceeds is material falling onto the core much affected by the magnetic field as the magnetic pressure is still smaller than the thermal pressure (). Note that a general prediction of the density at which the outflow will be launched will involve the knowledge of the magnetic field structure and strength as well as the rotation velocity of the first core. The non-linear interplay between the magnetic field and the self-gravitational collapse of a rotating cloud hampers this task. Nevertheless, we find that the outflow starts well into the collapse and after the first core has formed.
5 Onset of large scale outflow
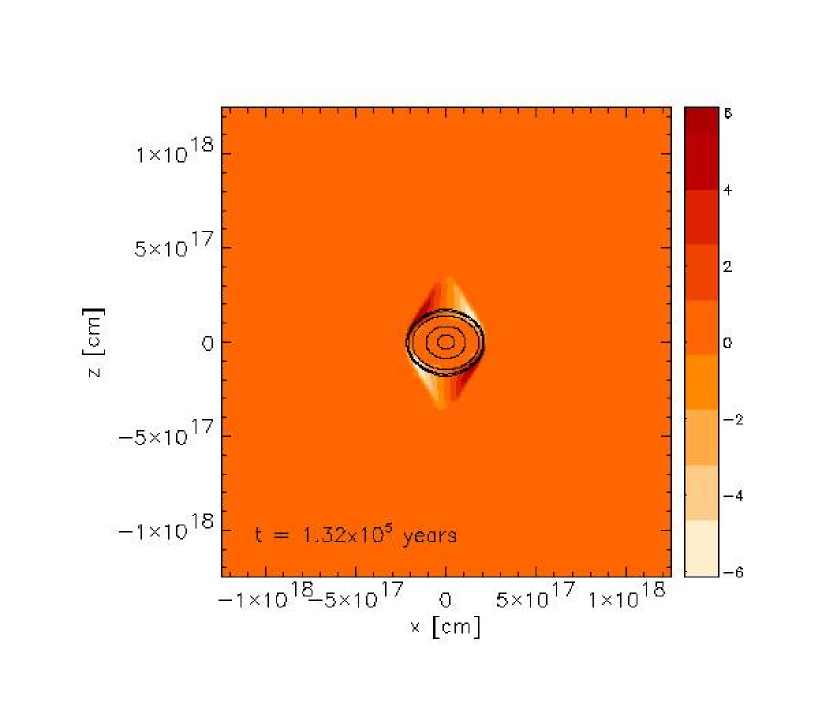
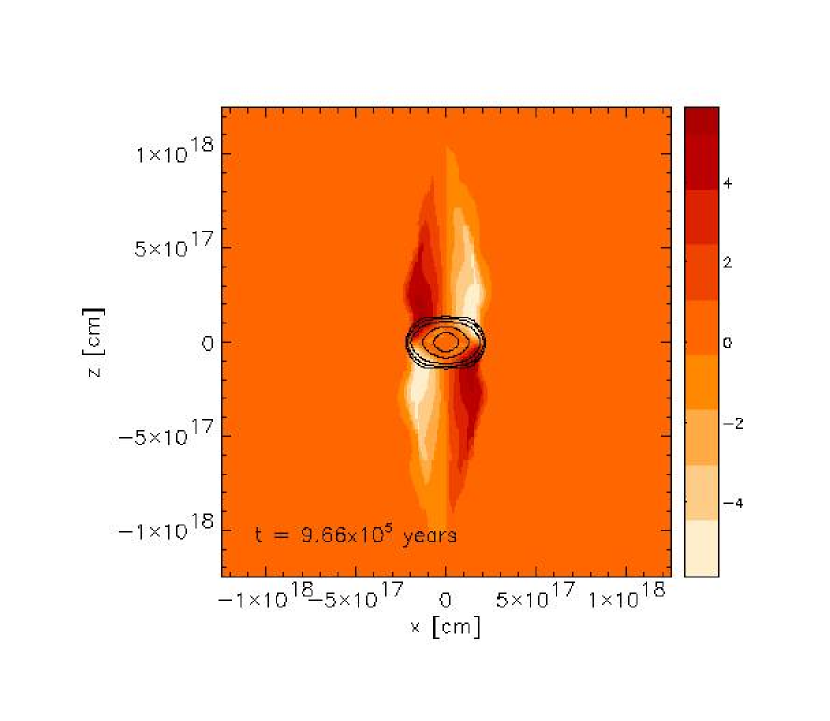
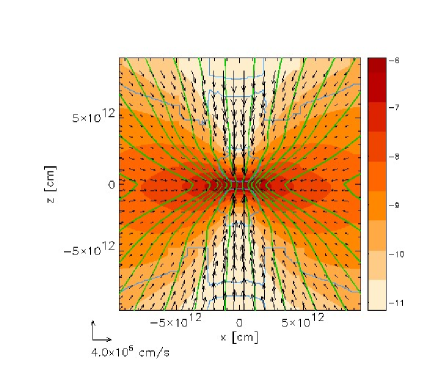
A strong toroidal magnetic field component builds up by winding magnetic field lines as the core’s angular velocity increases during its contraction phase. By time the central density reaches , the magnetic pressure from the toroidal field component has become strong enough to prevent the shock fronts below and above the disk plane from moving towards the center. Now, material inside the magnetized bubble is pushed outward leading to a large scale outflow. The onset of this large scale magnetic tower outflow and the situation at the end of our simulation are shown in the two snapshots in Fig. 2 wherein we present a 2 pixel wide, 2D slice through the center of the simulation box. Such large scale, low velocity outflows are also seen in other collapse simulations (e.g., Tomisaka, 1998, 2002; Allen et al., 2003).
This collimated bipolar outflow can be understood in terms of a magnetic tower (Lynden-Bell, 2003; Kato et al., 2004) that consists of an annulus of highly wound magnetic field lines that pushes into the ambient pressure environment. The toroidal magnetic field component that is continuously produced by the rotating disk acts like a compressed spring which lifts some material off the disk surface and sweeps up material in the external medium. Substantial pressure is needed to trap the toroidal field, allowing it to wind up and push into this region. Solutions show (Lynden-Bell, 2003) that the expansion of a tower grows linearly with time in the case of an uniform external pressure and accelerates in the case of a decreasing pressure profile. The acceleration of a tower may be slowed or even reversed in the presence of ram pressure. Taken together, it appears natural that a tower flow be driven from a disk within the high-pressure region inside the first shock.
At this stage where the large scale outflow begins to sweep up material the magnetic pressure becomes stronger than the thermal pressure () and the interior of the “magnetic bubble“ cools further by adiabatic expansion. Such an outflow may be the origin of the molecular flow that is seen from all young stellar objects (YSOs) (e.g., Uchida & Shibata, 1985). Measurements of CO emission lines of outflows from young stellar objects indicate higher velocities, but our simulations show the star formation phase in a very early stage wherein the central mass of the protostar is still tiny. Since the outflow velocity is related to the escape speed (see Pudritz, 2003, for a review), this is the expected result. The outflow speed will increase with time as central stellar mass grows. In Fig. 2 one can see that the outflow velocity exceeds the poloidal Alfvén velocity where the outflow is the fastest. The outflow forces the region enclosed by the outer shock fronts to expand and the shock fronts are moving outward. By the end of our simulation the shock fronts are pushed to a disk height of and would presumably continue to rise. As already mentioned, this may be the origin of bipolar outflows that are associated with all young stellar objects.
We point out that the collimation of the large scale outflow is not due to the initially uniform field which extends to infinity but rather to the dynamically built up field structure which provides hoop stresses to confine the outflow. The fact that toroidal field component dominates the poloidal component in the outflow region shows that the large scale outflow is driven by (toroidal) magnetic pressure and confined by by the same toroidal field structure as shown in Lynden-Bell (2003).
6 The onset of the disk jet
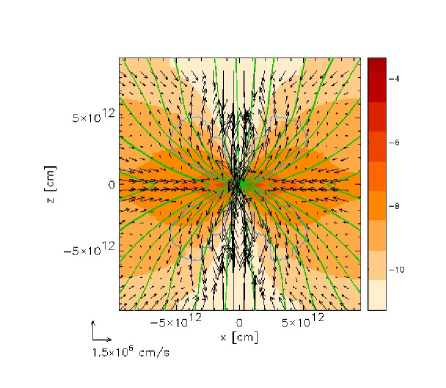
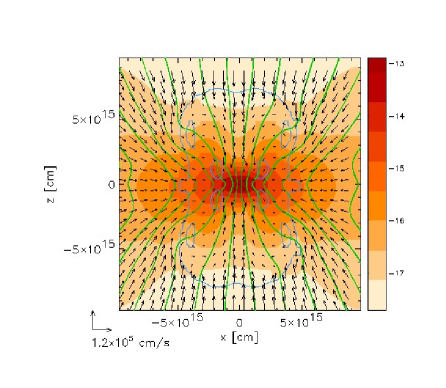
An even more dramatic outflow phenomenon erupts from the interior regions of the disk, in the deepest part of the gravitational potential well generated by the assembling protostar. In Fig. 3, we show two snapshots of the disk and surrounding infalling region focused down to a scale of . The upper panel shows the collapse of material that is still raining down onto the disk at time of . In comparison with the outer regions of the disk, the magnetic field lines towards the disk interior have been significantly distorted as they are dragged inwards by the disk’s accretion flow. They take the appearance of a highly pinched-in, hour-glass. This configuration is known to be highly conducive to the launch of disk winds (Blandford & Payne, 1982; Pudritz & Norman, 1983; Lubow et al., 1994; Ferreira, 1997): magnetic field lines threading the disk with an angle with the vertical that is greater than are able to launch a centrifugally driven outflow of gas from the disk surface. Our simulations clearly confirm this picture as the angles of the magnetic field lines with the vertical axis that are much greater than .
Five months later in our simulation, a jet can clearly be seen to leave the disk surface inside a spatial scale of . Moreover, this disk wind achieves super-Alfvénic velocities above which it begins to collimate towards the outflow axis. This jet is much more energetic than the magnetic tower outflow at times larger scales (cf. Figure 2).
Similar to the large scale outflow, this jet is confined between shock fronts which result from the non-isothermal EOS due to inefficient cooling (for the evolution of the effective EOS see Sec. 10). The appearance of these shocks seems to encourage flow reversal, possibly because the high pressure inside the post-shock region.
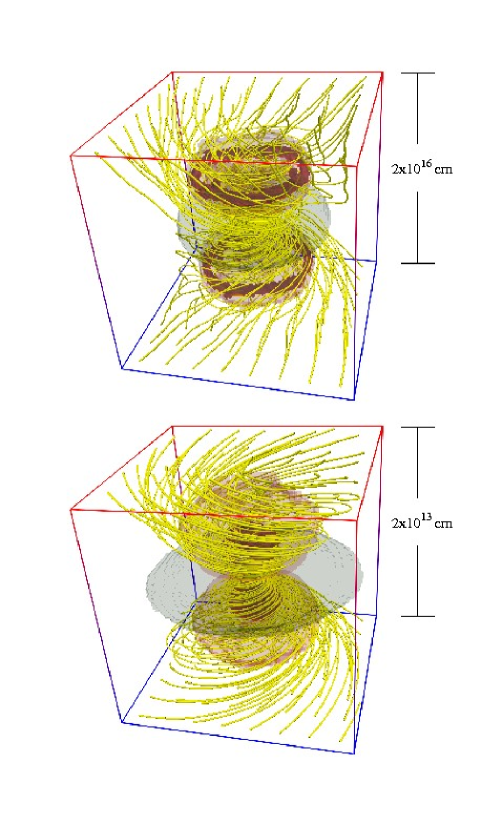
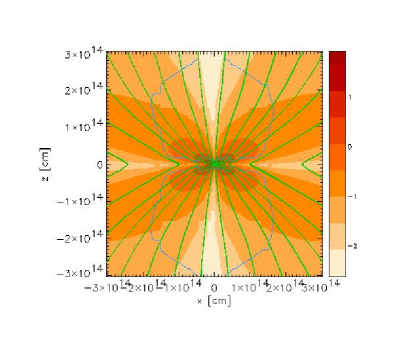
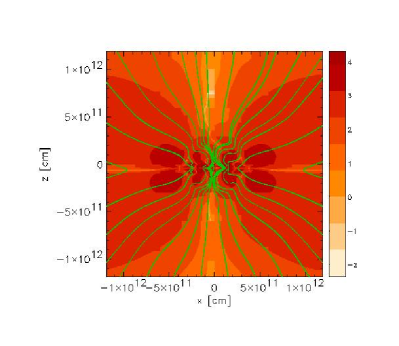
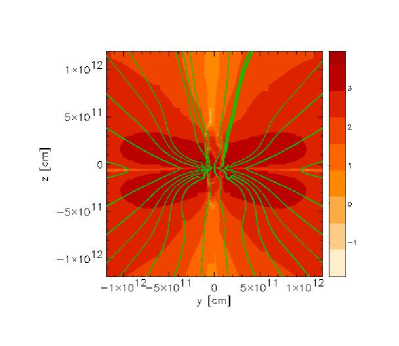
In Figure 4, we show two snapshots of the three dimensional structure of the magnetic field lines each taken at the end of our simulation. The upper panel shows the 3D field structure of magnetic field lines on the scale of the large scale outflow in Figure 2, while the lower panel shows the same for the jet in Figure 3. The magnetic field lines in both snapshots are always swept backwards in a rotating outflow - an affect that arises from the mass loading of these flows. Nevertheless, there is a difference in the field line structure - those in the upper panel are almost parallel to the outflow axis outside the large scale outflow region, while the field lines in the jet region have a strong component parallel to the protodisk. The latter field structure indicates the jet is magneto-centrifugally powered wherein the field lines act as “lever arms” flinging material off the disk surface, whereas the large scale outflow is powered by magnetic pressure in which the magnetic field lines behave like the release of a compressed spring.
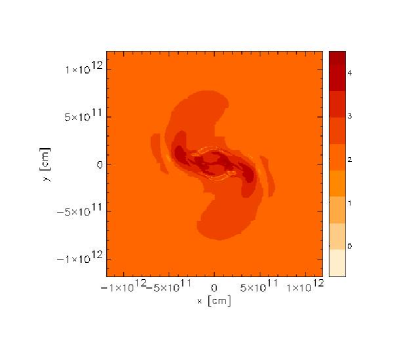
7 Ring fragmentation in the disk – the formation of a proto-binary system
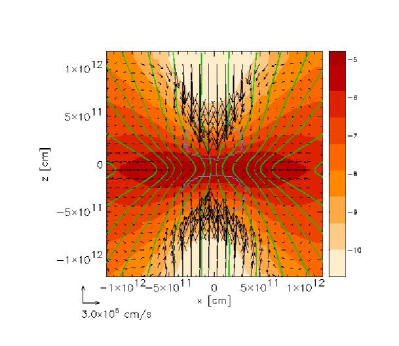
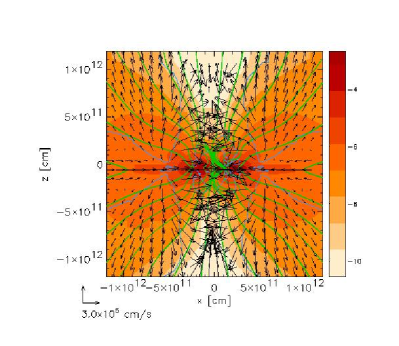
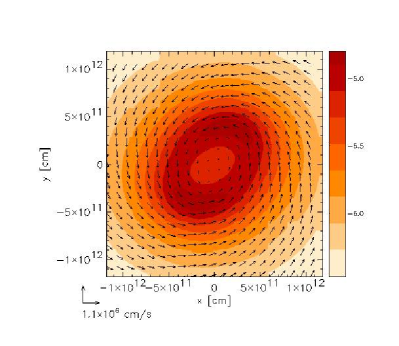
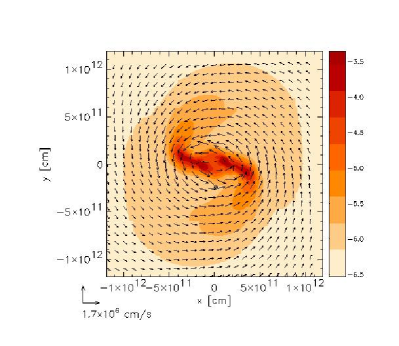
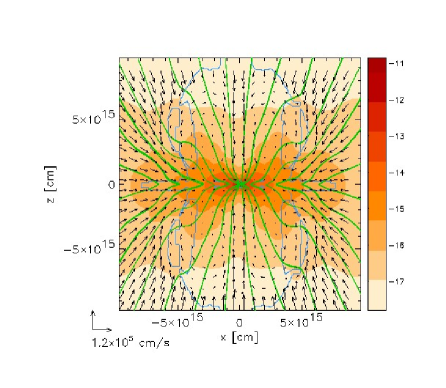
We examine accretion disk structure, infall, and jet outflow in the vicinity of the protostar - on a physical scale of and smaller - in Figure 5. The snapshots in the left panels are taken before the fragmentation of the disk into a ring has taken place, while the right panels show the situation a few weeks later, at the end of our simulation, after the disk’s ring structure has broken up into two pieces. This binary is only separated by and contains gas of . These images are taken at an unprecedented level of grid refinement as we able to study the dynamics on a physical scale of .
In the left panels, vigorous infall is still occurring onto the central protostellar region as the material in the envelope rains down on the central protostar. In the top right panel, a jet-like outflow has been initiated. This outflow achieves super Alfvénic speeds and collimate towards the outflow axis. We show in the bottom right panel that the smooth disk at this point undergoes gravitational fragmentation into a binary protostellar system. The location of the protostellar cores mark a transition of the jet pattern: gas inside the binary system is falling back onto the protostars whereas material outside the cores is leaving the disk. This bifurcation point separates the disk dynamics from the forming binary.
From the upper right panel of Fig. 5 one can see that the disk wind arises from the circumbinary part of the disk. The decrease in disk rotation speed inside may be a reason why the disk wind in this central region is apparently more difficult to launch.
The disk, in the early stages that we are investigating here, is still more massive than the protostars that are forming within it. It is therefore prone to gravitational instabilities that can lead to gravitational fragmentation. The disk has fragmented into a ring of material whose radius is of the order of . After one and a half rotations of the disk, the ring further fragments into two pieces, each of which can be regarded as a protostellar core in its own right. These fragments are strongly bound by tidal interactions and there is the distinct possibility that they will merge to form a single protostar since they are currently separated by only a few solar radii.
Compared to our earlier – pure hydrodynamical – simulations (BPH04), we find that the physical scale of the ring fragment seen in this hydromagnetic simulation is much smaller than the ring found in the purely hydrodynamic calculations. This suggests that magnetic fields support protostellar disks against fragmentation in the low density regime at larger radial distances. The additional magnetic pressure and the slow-down by magnetic braking reduce the possibility of the protodisk to fragment. Recent simulations by Hosking & Whitworth (2004) (SPH) and by Ziegler (2005) (AMR, grid code NIRVANA) also point out that the influence of magnetic fields prevents fragmentation. At higher densities (in our case ) magnetic fields cannot prevent fragmentation and a ring structure forms. This inner region () is rotating much faster than the outer envelope which makes it more likely to form a ring.
Finally we show the link between toroidal and poloidal field structure in the disk-binary system in Figure 6. The toroidal field on scales much larger than the binary system is quadrupolar, because this component must vanish on both the mid-plane of the disk as well as on the rotation axis. On scales characterizing the binary, a much more complex structure is evident. First, the poloidal field traces the density structure of the binary-disk system (see also Fig. 5) due to flux-frozen compression of the magnetic field. Second, the toroidal field (shown in gray scale) peaks just outside of the binary system at (-plane). This maximum in pushes gas and therefore poloidal field lines toward the central rotation axis.
8 Properties of protostellar disks and magnetized protostars


The radial structure of the disks that form in our gravitational collapse simulations is of great interest for the observations of the early stages of star and planet formation in real systems. Our results pertain to the early (class 0) phases, before the central protostar has become sufficiently massive to ignite the burning of its own hydrogen fuel. At this time the disk is heated primarily by the energy that is liberated by shocks and adiabatic compression. Figure 7 consists of 4 panels in which the radial profiles of various physical quantities of interest are plotted as a function of the disk radius, 333All quantities are azimuthally averaged and weighted with the disk density, , e.g. , where is the column density as a function of the cylindrical radius .. These plots show that the disk’s physical properties can be very well described by simple power-law relations over nearly three decades of physical scale. Interior to the smallest scale is the region that is dominated by two protostellar cores.
The column density profile follows the famous ”Hayashi” profile that pertains for the structure of the disk in which our own solar system may have been formed. It is interesting that the threading magnetic field clearly plays a role in determining this structure since our purely hydrodynamic collapse calculations resulted in a column density profile that is considerably steeper. Models for the formation of planetary systems often give values of physical quantities at , the position of the Earth. The column density at this early time is which is considerably denser than the Hayashi ”minimum solar mass nebula” but is still in agreement with values seen in young protostellar disks (Wilner & Lay, 2000).
The disk, at , has a temperature of , which is somewhat higher than is found in most models. We note that this may be property of our assumed coolants that consist solely of the excitations of molecules in the disks. Real protostellar disks will also be able to cool somewhat more efficiently by emission from warm dust grains. The peak temperature achieved interior to a few reaches , which is sufficient to melt the dust grains in the gaseous disk (Hillenbrand et al., 1992). In our case, this means that inside interior to the disk will be free of dust. Comparison of disk models with observational data show that a typical disk will have an inner rim that extends to due to dust sublimation by stellar and accretion heating (Muzerolle et al., 2003).
The rotation curve of a disk, whose gravitational field is dominated by the central star, is given by Kepler’s law, . In contrast, a fully self-gravitating disk has a much shallower behavior with an angular velocity which is constant with radius. Our disk has an intermediate scaling, , which indicates that the disk’s dynamics is somewhat governed by the central forming protostar, but whose own self-gravity is still significant. The rotation speed of material at is . This is smaller by a factor of 10 than that of the Earth around our Sun. However, at this moment in the simulation, this rotation speed is completely consistent with the small amount of gas, as well as protostellar mass, that is interior to - the former being only , about 1 % of the mass of the Sun.
Finally, the distribution of magnetic fields across the disk is a vital ingredient in understanding how outflows are launched and how the bulk of a disk’s angular momentum may be extracted. The dominant field component is the vertical one, which scales as
| (6) |
This radial dependence is close to the scaling one obtains for a self-similar disk model wherein (Blandford & Payne, 1982). Here the self-similarity scaling breaks down however because the toroidal field component falls off much more steeply than does that of the vertical field; we find the scaling close to . The strength of the dominant field component at is quite significant; Gauss. It is remarkable that meteorites found at about this physical scale in the solar system are found to have been magnetized by a field strength that is of this order - 3 Gauss (Levy & Sonett, 1978).
The vertical magnetic field in these data levels off in the innermost region as is seen in this panel. The peak field observed is of the order of . This result is within the limits of measured mean surface magnetic field strengths of stars, which are observed to have values (Johns-Krull et al., 1999). The interesting conclusion is that the magnetic fields in protostars may be fossils of this early star formation epoch in which the magnetic field of the parental magnetized core was compressed into the innermost regions of the accretion disks. Recently it was shown by Braithwaite & Spruit (2004) that fossil fields with non-trivial configuration can survive over a star’s lifetime (see also our discussion in Sec. 2).
Recent measurements by Donati et al. (2005) of magnetic fields in the accretion disk around FU Ori support many of our results reported here. Firstly, the reported magnetic fields strength is around at a distance of from the protostar. Secondly, the inferred field configuration has the structure of a wound-up and compressed magnetic field which azimuthal component points in the opposite direction of the disk rotation and where the poloidal component dominates the field. Thirdly, the magnetic plasma rotates sub-Keplerian which indicates that strong magnetic braking must be taking place.

Figure 8 summarizes the evolution of the magnetic fields strength as a function of the core density . We find the scaling relation . This power law is slightly steeper than is found in other simulations (e.g. Desch & Mouschovias, 2001; Li et al., 2004) who found in collapse and core formation calculations. In general, the scaling law, , depends on the field geometry. For instance, small scale tangled magnetic fields scale as . In our case, we have poloidal and toroidal field components which lead to a slightly steeper compression of the field strength with density 444We calculate the mean magnetic field strength, , as follows: , where the volume, , is taken in the region where , being the maximal density at the time, .
The origin of the magnetic fields in accretion disks remains one of the most important, unresolved issues of star formation. Fields could be advected inwards during the collapse of the magnetized core on larger scales – as we see in our simulations. It is also theoretically possible for magnetic fields to be generated within disks by dynamo action (e.g., Pudritz, 1981b, a; Stepinski & Levy, 1988; Brandenburg et al., 1995; von Rekowski et al., 2003). The simulations of von Rekowski et al. (2003) explicitly include a dynamo generation term (“”) in the induction equation. Their results show that dynamo action in a turbulent disk can generate fields as well as disk winds without the need for larger scale external fields. In our simulations however, the time span is not sufficient to observe dynamo generated disk fields as we can follow only a few disk rotations in this collapse situation.

In Fig. 9 we show the evolution of the effective EOS, , in the core region. We performed the same analysis for our purely hydrodynamical simulations (BPH04) where varies much more significantly with time. For these simulations we did not have as many output files, i.e. the analysis relied on a poorer time resolution. Note in particular the significant change in in the range of densities . The various changes of the effective EOS during the collapse phase reflect the necessity to include realistic physics into collapse simulations and cast some doubt on the use of simple adiabatic “switching” to study gas at high densities. The relevance of cooling for dynamical collapse simulations is also pointed out by Lesaffre et al. (2005).
9 The disk-jet connection
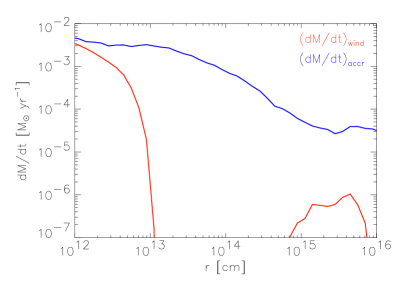
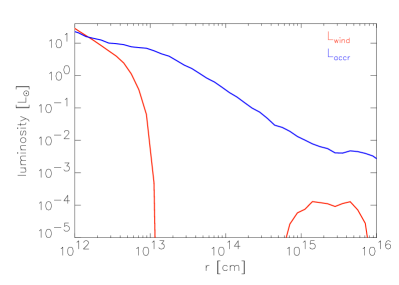
Outflows and jets from young stellar objects are powered by the accretion flows in the disk where magnetic fields redirects a small fraction of the flow leading to a mass loss from the protodisk. Therefore, accretion properties and wind properties should be strongly correlated. Observations of various different systems indicate for instance that the mass loss by the wind and the mass accretion through the disk are related by (e.g. review Konigl & Pudritz, 2000). In Fig. 10, we summarize the results of our simulation which compares the wind properties with that from the accretion disk after the onset of the gravitational collapse (quantities are shown as averaged over a sphere with radius ). Clearly visible in these graphs are the double shock structures that confine the jet and the large scale outflow to distinct regions. The inner shock () momentarily hinders the jet from expanding towards higher disk altitudes and the outer shock () until now blocks the outflow from running into the cloud envelope. Nevertheless, the jet is already powerful enough to expel material at a rate of at which is a good fraction of the peak accretion through the disk ().
The system has not yet reached a steady state configuration and is still in a contracting phase. Therefore, the large scale outflow is not yet fully developed and its contribution to the mass loss and luminosity is still gaining importance. Nonetheless, we can classify the last stage of our simulation as a “Class 0” protostar because the luminosity of the large scale outflow might be in the observable range (a few % of the accretion luminosity).
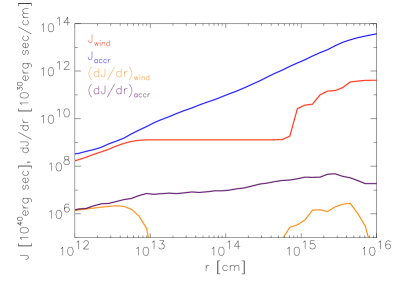
In the lower left panel of Fig. 10 we show the angular momentum per unit length,
| (7) |
and the total angular momentum
| (8) |
carried by the infalling (accretion, ) and outgoing (wind, ) material, where is the toroidal velocity and is the cylindrical radius. At this early times the small scale jet already carries a significant amount of the total angular momentum which is extracted from the protodisk.
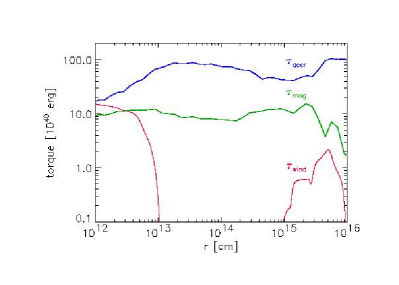
The lower right panel of Fig. 10 shows the torques exerted by the accretion flow, wind, and magnetic field, where we calculate the accretion torque () and the wind torques () as the angular momentum flux through a sphere with radius ,
| (9) |
where is the radial outflow/inflow velocity. The torque exerted by the magnetic field on the fluid at radius is (e.g., Konigl & Pudritz, 2000)
| (10) |
where , , and are the radial, poloidal, and toroidal components of the magnetic field.
The distribution of the torques indicate that the jet transports almost as much angular momentum away from the inner part of the protodisk as the disk gains from accreting gas. Together with the angular momentum extracted by the magnetic torque from this inner region, we conclude that the protostar(s) will spin much below its break-up rate at the time the system relaxes to a steady state configuration.
10 Conclusion
Our study on the early phases of gravitational collapse and star formation in low mass, magnetized, molecular cores shows that outflows and jets are an inevitable consequence of disk formation. Outflows play a central role in transporting disk angular momentum, and in determining the disk structure and basic properties of the forming protostar(s). The predicted properties for the jets, namely that they rotate and transport the bulk of the disk’s angular momentum, have now been confirmed by Hubble Space Telescope observations (Bacciotti et al., 2002).
Our study is a comprehensive and self-consistent approach – including cooling by molecular line emission – of generating outflow phenomena during the collapse of molecular cloud cores. However, additional physical processes such as dust cooling and ambipolar diffusion need to be added to our model (see also discussion in Sec. 2).
Among our many findings, we list the most significant results below.
-
•
We confirm in our simulations that angular momentum loss by the flux of torsional Alfvén waves can significantly reduce the spin of pre-collapse cores.
-
•
A large scale outflow (up to ) occurs which is driven by the wrapped-up toroidal field pressure resulting in a magnetic tower flow. This creates a torus-like “bubble” that expands into the surroundings.
-
•
An inner jet (up to ) is driven from the disk in the deepest part of the gravitational well and is powered by magneto-centrifugal force. This disk wind is launched from the disk region exterior to the binary.
-
•
The magnetic field suppresses, but does not entirely prevent ring fragmentation of our disk. The ring has a physical scale of and rapidly fragments into a proto-binary with a separation of only .
-
•
The protostellar disk still dominates the mass of the forming protostars in these early () stages with within whereas the binary mass is .
-
•
The accretion rate through the disk varies strongly in both space and time. In the inner regions, we find with a peak accretion rate in the disk reaching .
-
•
During the collapse, the total magnetic fields strength scales with the core density as .
-
•
Our results suggest that it is possible that stars acquire fields as fossils of this early collapse era, rather than through dynamo action on an initial weak field.
References
- Allen et al. (2003) Allen, A., Li, Z., & Shu, F. H. 2003, ApJ, 599, 363
- Alves et al. (2001) Alves, J. F., Lada, C. J., & Lada, E. A. 2001, Nature, 409, 159
- Andre et al. (2000) Andre, P., Ward-Thompson, D., & Barsony, M. 2000, Protostars and Planets IV, 59
- Bacciotti et al. (2002) Bacciotti, F., Ray, T. P., Mundt, R., Eislöffel, J., & Solf, J. 2002, ApJ, 576, 222
- Bachiller (1996) Bachiller, R. 1996, ARA&A, 34, 111
- Banerjee et al. (2004) Banerjee, R., Pudritz, R. E., & Holmes, L. 2004, MNRAS, 355, 248
- Basu & Mouschovias (1994) Basu, S., & Mouschovias, T. C. 1994, ApJ, 432, 720
- Basu & Mouschovias (1995a) —. 1995a, ApJ, 452, 386
- Basu & Mouschovias (1995b) —. 1995b, ApJ, 453, 271
- Blandford & Payne (1982) Blandford, R. D., & Payne, D. G. 1982, MNRAS, 199, 883
- Boss (2002) Boss, A. P. 2002, ApJ, 568, 743
- Braithwaite & Spruit (2004) Braithwaite, J., & Spruit, H. C. 2004, Nature, 431, 819
- Brandenburg et al. (1995) Brandenburg, A., Nordlund, A., Stein, R. F., & Torkelsson, U. 1995, ApJ, 446, 741
- Ciolek & Mouschovias (1998) Ciolek, G. E., & Mouschovias, T. C. 1998, ApJ, 504, 280
- Crutcher et al. (1999) Crutcher, R. M., Troland, T. H., Lazareff, B., Paubert, G., & Kazès, I. 1999, ApJ, 514, L121
- Desch & Mouschovias (2001) Desch, S. J., & Mouschovias, T. C. 2001, ApJ, 550, 314
- Donati et al. (2005) Donati, J.-F., Paletou, F., Bouvier, J., & Ferreira, J. 2005, 438, 466
- Ferreira (1997) Ferreira, J. 1997, A&A, 319, 340
- Fryxell et al. (2000) Fryxell, B., Olson, K., Ricker, P., Timmes, F. X., Zingale, M., Lamb, D. Q., MacNeice, P., Rosner, R., Truran, J. W., & Tufo, H. 2000, ApJS, 131, 273
- Goldsmith (2001) Goldsmith, P. F. 2001, ApJ, 557, 736
- Goldsmith & Langer (1978) Goldsmith, P. F., & Langer, W. D. 1978, ApJ, 222, 881
- Hayashi (1981) Hayashi, C. 1981, Progress of Theoretical Physics Supplement, 70, 35
- Heyvaerts (2003) Heyvaerts, J. 2003, NATO ASI, Les Houches, Session LXXVIII, Accretion Discs, Jets and High Energy Phenomena in Astrophysics, p. 3
- Hillenbrand et al. (1992) Hillenbrand, L. A., Strom, S. E., Vrba, F. J., & Keene, J. 1992, ApJ, 397, 613
- Hosking & Whitworth (2004) Hosking, J. G., & Whitworth, A. P. 2004, MNRAS, 347, 1001
- Johns-Krull et al. (1999) Johns-Krull, C. M., Valenti, J. A., & Koresko, C. 1999, ApJ, 516, 900
- Kato et al. (2004) Kato, Y., Mineshige, S., & Shibata, K. 2004, ApJ, 605, 307
- Konigl & Pudritz (2000) Konigl, A., & Pudritz, R. E. 2000, Protostars and Planets IV, 759
- Larson (2003) Larson, R. B. 2003, Reports of Progress in Physics, 66, 1651
- Lesaffre et al. (2005) Lesaffre, P., Belloche, A., Chieze, J. P., & Andre, P. 2005, to appear in A&A, astro-ph/0508161
- Levy & Sonett (1978) Levy, E. H., & Sonett, C. P. 1978, in IAU Colloq. 52: Protostars and Planets, 516–+
- Li et al. (2004) Li, P. S., Norman, M. L., Mac Low, M., & Heitsch, F. 2004, ApJ, 605, 800
- Li (1998) Li, Z. 1998, ApJ, 497, 850
- Lubow et al. (1994) Lubow, S. H., Papaloizou, J. C. B., & Pringle, J. E. 1994, MNRAS, 267, 235
- Lynden-Bell (2003) Lynden-Bell, D. 2003, MNRAS, 341, 1360
- Machida et al. (2005a) Machida, M. N., Matsumoto, T., Hanawa, T., & Tomisaka, K. 2005a
- Machida et al. (2005b) Machida, M. N., Matsumoto, T., Tomisaka, K., & Hanawa, T. 2005b
- Machida et al. (2004) Machida, M. N., Tomisaka, K., & Matsumoto, T. 2004, MNRAS, 348, L1
- Matsumoto & Hanawa (2003) Matsumoto, T., & Hanawa, T. 2003, ApJ, 595, 913
- Matsumoto & Tomisaka (2004) Matsumoto, T., & Tomisaka, K. 2004, ApJ, 616, 266
- Mouschovias & Paleologou (1980) Mouschovias, T. C., & Paleologou, E. V. 1980, ApJ, 237, 877
- Muzerolle et al. (2003) Muzerolle, J., Calvet, N., Hartmann, L., & D’Alessio, P. 2003, ApJ, 597, L149
- Nakamura & Li (2003) Nakamura, F., & Li, Z. 2003, ApJ, 594, 363
- Neufeld & Kaufman (1993) Neufeld, D. A., & Kaufman, M. J. 1993, ApJ, 418, 263
- Neufeld et al. (1995) Neufeld, D. A., Lepp, S., & Melnick, G. J. 1995, ApJS, 100, 132
- Olson et al. (1999) Olson, K. M., MacNeice, P., Fryxell, B., Ricker, P., Timmes, F. X., & Zingale, M. 1999, Bulletin of the American Astronomical Society, 31, 1430
- Ouyed et al. (1997) Ouyed, R., Pudritz, R. E., & Stone, J. M. 1997, Nature, 385, 409
- Pudritz (1981a) Pudritz, R. E. 1981a, MNRAS, 195, 897
- Pudritz (1981b) —. 1981b, MNRAS, 195, 881
- Pudritz (2003) —. 2003, NATO ASI, Les Houches, Session LXXVIII, Accretion Discs, Jets and High Energy Phenomena in Astrophysics, p. 187
- Pudritz & Norman (1983) Pudritz, R. E., & Norman, C. A. 1983, ApJ, 274, 677
- Shibata & Uchida (1985) Shibata, K., & Uchida, Y. 1985, PASJ, 37, 31
- Shibata & Uchida (1986) —. 1986, PASJ, 38, 631
- Stepinski & Levy (1988) Stepinski, T. F., & Levy, E. H. 1988, ApJ, 331, 416
- Stone & Norman (1992) Stone, J. M., & Norman, M. L. 1992, ApJ, 389, 297
- Tilley & Pudritz (2004) Tilley, D. A., & Pudritz, R. E. 2004, MNRAS, 353, 769
- Tomisaka (1998) Tomisaka, K. 1998, ApJ, 502, L163+
- Tomisaka (2002) —. 2002, ApJ, 575, 306
- Truelove et al. (1997) Truelove, J. K., Klein, R. I., McKee, C. F., Holliman, J. H., Howell, L. H., & Greenough, J. A. 1997, ApJ, 489, L179+
- Uchida & Shibata (1985) Uchida, Y., & Shibata, K. 1985, PASJ, 37, 515
- von Rekowski et al. (2003) von Rekowski, B., Brandenburg, A., Dobler, W., Dobler, W., & Shukurov, A. 2003, A&A, 398, 825
- Ward-Thompson et al. (2002) Ward-Thompson, D., André, P., & Kirk, J. M. 2002, MNRAS, 329, 257
- Wilner & Lay (2000) Wilner, D. J., & Lay, O. P. 2000, Protostars and Planets IV, 509
- Yorke et al. (1995) Yorke, H. W., Bodenheimer, P., & Laughlin, G. 1995, ApJ, 443, 199
- Ziegler (2005) Ziegler, U. 2005, A&A, 435, 385