Gamma-Ray Burst Selected High Redshift Galaxies: Comparison to Field Galaxy Populations to
Abstract
We study the internal structural properties of 37 long duration gamma-ray burst (GRB) host galaxies imaged with the Hubble Space Telescope. Our goal is to gain insights in the type of galaxies that gives rise to GRBs, and the relationship of GRB hosts to high-redshift galaxies selected through more traditional photometric methods. We measure structural properties of our sample from Hubble Space Telescope observations obtained after the GRB afterglow faded. Fitting exponential disk (typical for spirals) and r1/4 (typical for ellipticals) models to the surface brightness profiles of eight bright host galaxies, we find that the disk model is slightly preferred for most hosts, although two galaxies are fit best with an r1/4 profile. We furthermore measure the central concentrations and asymmetries of all 37 host galaxies using the CAS (concentration, asymmetry, clumpiness) system, and compare with values for galaxies in the Hubble Deep Field, and systems present on the gamma-ray burst host images. Our first main conclusion is that GRB hosts exhibit a surprisingly high diversity of galaxy types. A significant fraction (68%) of host galaxies are situated in a region of the concentration-asymmetry diagram occupied by spirals or peculiar/merging galaxies. Twelve hosts (32%) are situated in the region occupied by elliptical galaxies, having high concentration indices indicative of early-types or early types in formation. These results show that GRB host galaxies are not a single morphological type, but span the available range of galaxy types seen at high redshift. We also find some evidence for evolution in GRB host galaxy morphology, such that hosts at have a relatively high light concentration, indicating that these systems are perhaps progenitors of massive galaxies, or are compact blue star forming galaxies. We find that GRB hosts at are different from the general field population at in terms of light concentration at 99.5% confidence, yet have sizes similar to the general galaxy population. This is the opposite of the effect at where GRB hosts are smaller than average. We argue that GRB hosts trace the starburst population at high redshift, as similarly concentrated galaxies at are undergoing a disproportionate amount of star formation for their luminosities. Furthermore, our results show that GRBs are not only an effective tracer of star formation, but are perhaps ideal tracers of typical galaxies undergoing star formation at any epoch, making them perhaps our best hope of locating the earliest galaxies at .
1 Introduction
Galaxies at high redshift are selected in a number of different ways. Traditional techniques include using deep optical and near infrared imaging to select systems based on spectral features such as optical or near infrared breaks or line emission (e.g., Steidel & Hamilton 1992; Franx et al. 2003; Fynbo et al. 2003; Moustakas et al. 2004), X-ray emission (Lehmer et al. 2005), sub-mm emission (e.g., Hughes et al. 1998) or through spectroscopic and photometric redshift surveys, typically associated with deep Hubble Space Telescope (HST) imaging, or deep near-infrared imaging (e.g., Dickinson et al. 2000; Budavári et al. 2000; Stanford et al. 2004; Somerville et al. 2004; Daddi et al. 2004). These techniques are all strongly biased, and are possibly missing substantial populations of galaxies at high redshifts. The discovery of gamma ray bursts (GRBs) and their associated host galaxies opens up a new possibility for detecting and understanding the formation and evolution of galaxies, as this selection is not based on assumptions about underlying spectral energy distributions. It is therefore important to understand if GRBs select different galaxy populations than photometric methods by comparing the known properties of field galaxies selected through other techniques with the host galaxies of GRBs.
In practically all cases where HST observations were performed of a GRB field, a host galaxy has been detected at the position of the early afterglow. These GRB host galaxies are actively star forming, as has been demonstrated in several different ways. First, GRB host galaxies tend to be bluer than field galaxies at similar redshifts (Fruchter et al. 1999, 2005; Le Floc’h et al. 2003). GRB hosts also have strong Balmer and nebular emission lines (e.g., Kulkarni et al. 1998; Djorgovski et al. 1998) which are produced by ionizing stars (e.g., Rhoads & Fruchter 2001). Moreover, there is also mounting evidence that long-duration GRBs are associated with regions of massive-star formation within their hosts. This has been shown through the location of afterglows with respect to their host galaxies (e.g., Bloom et al. 2002; Fruchter et al. 2005). For example, Fruchter et al. (2005) argue that GRBs are more centrally concentrated on the peaks of surface brightness enhancements in galaxies than the total light, suggesting a strong correlation between the locations of GRBs and bright regions of star-formation. Another line of evidence for a star-formation connection was initiated by the discovery of an unusual supernova of type Ic, SN 1998bw, in the error box of GRB 980425 (Galama et al. 1998), which suggested an association between the two phenomena. Since this discovery further observations have found a supernova light-curve component superimposed on the late-time power-law decay of afterglows (Bloom et al. 1999; Reichart 1999; Galama et al. 2000; Castro-Tirado et al. 2001). Furthermore, the system GRB 030329 was close enough to show spectroscopically (Stanek et al. 2003; Hjorth et al. 2003a) that at least some GRBs also produce a special type of supernova explosion, or vice versa. This association fits very well in the collapsar model, in which a rapidly rotating massive star undergoing core-collapse produces a jetted GRB along the rotation axis, and at the same time blows up the entire star in an energetic supernova explosion (Woosley 1993; MacFadyen & Woosley 1999).
If GRBs are caused by the explosion of a massive star, one might expect most bursts to occur in massive star-bursting galaxies, i.e. galaxies which are converting most of their neutral gas content into stars in a very short period of time ( 108 years). However, there is a diversity in the modes of star formation, and the kinds of galaxies in which GRBs could originate. From radio and sub-mm observations it appears that at most 20% of GRB hosts are starburst galaxies, with star-formation rates (SFRs) of several hundred M⊙ per year (Berger et al. 2001; Frail et al. 2002; Tanvir et al. 2004). It has also been argued that most host galaxies are very blue, sub-luminous, and sub-massive (e.g., Le Floc’h et al. 2003), although these results might be biased by the steep luminosity function of star forming galaxies. None of the galaxies in the sample of Le Floc’h et al. (2003), who observed GRBs in the R and K bands, include known hosts with characteristics of luminous infrared/submillimeter sources or extremely red starbursts. More recently, Christensen et al. (2004) fitted galaxy templates to the SEDs of a sample of hosts, finding that most have young starburst-like SEDs with moderate to low extinction. The host galaxies of GRBs are therefore potentially an inhomogeneous set of galaxies with ongoing star formation.
To shed light on some of these issues we investigate in this paper the structural properties and sizes of nearly all GRB host galaxies imaged with HST to date. Our goal is to provide additional insight into the types of galaxies that give rise to GRBs, their relationship to other galaxies at similar redshifts, and their star-formation properties. We used a sample of late-time HST images of GRB hosts that were unambiguously identified through an accurate projection of the early afterglow. This data set is described in §2. Our study of the morphology of these GRB hosts is divided into two main parts: in §3 we fit exponential and r1/4 surface brightness profiles to bright hosts at . This allows us to make a rough distinction between early- and late-type galaxies. In §3.2 we use the central concentration and asymmetry indices in order to classify GRB host galaxies as elliptical-like, spiral-like, or peculiar. In §4 we discuss how GRB hosts are related to other galaxies at high redshift, while §5 is a discussion of our results in terms of previous findings concerning GRB hosts, and §6 is a summary of our results. We assume the following cosmology in this paper: H0 = 65 km s-1 Mpc-1, = 0.7 and = 0.3.
2 The HST sample of GRB host galaxies
We make use of observations in three HST programs that have imaged GRB host galaxies over the past few years. The principal investigators of these programs are: Fruchter (e.g., Fruchter et al. 2000, 2005; HST programs 7863, 8189, 9074, 9405), Kulkarni (e.g., Kulkarni et al. 1998; HST programs 8867, 9180), and Holland (Holland et al. 2000; HST program 8640). We have selected the host galaxies for which an accurate (02) projection of the early optical afterglow is possible, to avoid misidentifications of the host system. We utilize all of the imaging from these programs with the exception of GRB 021202, GRB 020124, GRB 020321, and GRB 020531, which are GRBs where the host galaxies was not identified. We also exclude an analysis of GRB 980425, a large nearby spiral galaxy, due to its small redshift, and difficulty in retrieving structural parameters, and GRB 000210 which has no late-time image. We also do not consider GRBs 980326, 990308 and 000301 in our analysis as the host galaxy is either too faint for a morphological analysis with , or the host is not detected, or unambiguously identified. We also do not include GRB 000131 in our analysis, due to its extremely low surface brightness, given its high redshift of . It is also not known, except for GRB 000301 what redshift these hosts are at, thus including them in our analysis and interpretations is difficult. It is however possible that not including these GRBs could bias our results, although there are only four, and thus not likely to be a significant bias. In any case, our sample is essentially complete for bursts at , and we analyze our incompleteness in §4.4.
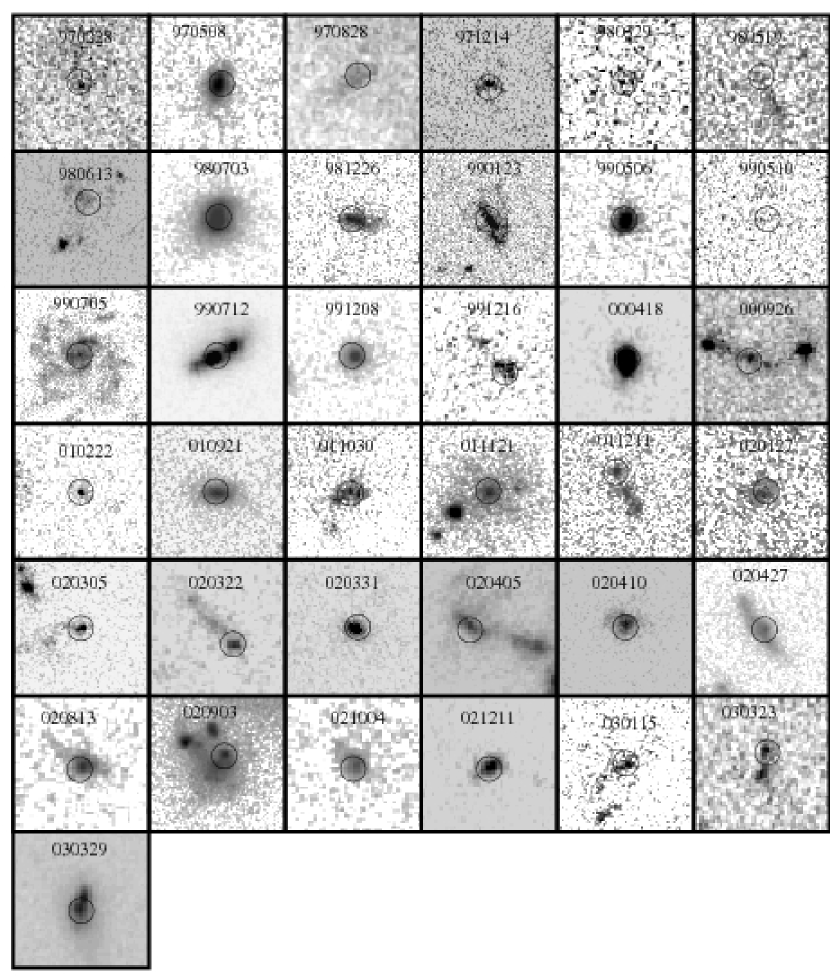
The GRB hosts included in our study are listed in Table 1 and are displayed in Figure 1. Table 1 also lists the instrument used to image each GRB host and the date of the HST observation we use. All of the hosts were observed months after the GRB event, giving us a clean image of the host. Many hosts were imaged with STIS in the clear (50CCD) and longpass (LP) filters, while others were imaged with WFPC2 and ACS in several filters. We used the 50CCD and F606W images for hosts imaged with WFPC2 or ACS. The images were bias-subtracted and flat-field corrected by the HST pipeline, and then drizzled (Fruchter & Hook 2002), resulting in images with half the original pixel scales of 00254, 005 and 003 for STIS, WFPC2 and ACS, respectively. All images used were taken sufficiently long after the burst, such that the contamination from the early afterglow is negligible.
3 Size, Structural and Morphological Analyses
One of the primary methods for comparing galaxies at different, and within similar, redshifts, is to study their stellar light distributions (e.g., Conselice 2003) and sizes (e.g., Ferguson et al. 2004). The manner in which the stellar light in galaxies is distributed can reveal the most salient features of a galaxy’s evolution and its characteristics, including: star formation, the presence and history of interactions/mergers, and a galaxy’s scale or relative total mass. Here we examine these features in a few ways - first we look at gross light profiles by fitting exponential and de Vaucouleurs r1/4-law functions. Later we utilize model independent CAS (Conselice 2003) parameters to compare the structures of the gamma-ray burst selected galaxies with other galaxies at similar redshift to look for evolution with redshift. We also analyze the size distribution of GRB hosts as a function of redshift.
3.1 Profile Fitting
3.1.1 Method
We fit exponential and de Vaucouleurs models to the surface brightness profiles of eight bright galaxies, with and with spectroscopic redshifts , from our sample of GRB hosts imaged with STIS. The noise in the images of the fainter galaxies becomes too large for a meaningful comparison between the two models. We perform these fits to determine if GRB host galaxies have similar light distributions to present day ellipticals or disks. Most elliptical galaxies and bulges of spiral galaxies are well-fit with a de Vaucouleurs r1/4-law profile: I(r)=Ie exp (7.669((r/Re)1)), where Re is the effective radius corresponding to the isophote which contains half of the galaxy light, and Ie is the surface brightness at Re. Disks of spiral galaxies, however, are best fit with an exponential profile: I(r)=I0 exp (r/Rd), where Rd is the disk scale length, and I0 is the central surface brightness.

Our fitting method is similar to the one used by Fruchter et al. (2000), who fitted exponential and r1/4-law profiles to the host of GRB 970508. For each image we first cut out a small area around the host galaxy, from which we build a Poisson error image. During each iteration in the fitting process, we create a 2-dimensional model image based on six parameters for both models. These parameters are: the central or effective surface brightness (I0 or Ie, respectively), the disk scale length or effective radius (Rd or Re, respectively), position angle (PA), axis ratio, and x and y pixel position. The model image is then convolved with the point spread function (PSF) before fitting it to the observed object image. To create a PSF image that approximates the real PSF of the telescope and instrument as closely as possible, we drizzle several model PSFs (as many as there are dithered individual object images that were used to create the final object image). Such a “raw” model PSF can be produced with Tiny Tim software (Krist 1995)111see http://www.stsci.edu/software/tinytim/. This subsampled PSF image is given a random offset in x- and y-position several times, just as the raw object images are offset with respect to each other, typically by 10-20 pixels. These images are then rebinned to the original pixel size, convolved with the charge diffusion kernel and drizzled to the final PSF image using the same parameter values, such as the scale and rotation, as in the drizzling run of the object image. As expected, the resulting PSF is similar to the PSF of stars in the STIS images. After convolution of the model image with this PSF, we used the IDL-amoeba, fits, also known as the down-hill simplex method (Nelder & Mead 1965; Press et al. 1992) to minimize
The error for each fit parameter in Table 2 is estimated by changing it in small increments from its best fit value while allowing all the other parameters to vary. The change for which the resulting increases by unity is taken to be the error in the parameter value.
3.1.2 Results of the Profile Fitting
The results of these fits for eight of the brightest host galaxies at imaged with STIS are listed in Table 2 and are graphically displayed in Figure 2. This is not the first study of GRB host galaxy structure, but most previous work contained an analysis of only single objects, which generally agree with our fits. For example, the host of GRB 970508, (Fruchter et al. 2000) was best fit with an exponential disk with a scale length of 0046 0006, and an ellipticity of 0.70 0.07. We find almost the same result: the of the exponential disk profile is clearly lower (0.57 vs. 0.85 for the r1/4 profile). The axis ratio that we find (0.39) corresponds to an ellipticity of 0.61, which is also consistent with the result of Fruchter et al. (2000). Although Figure 2 seems to graphically show that the exponential and de Vaucouleur profiles are equally well fit, the central part of the profile is better fit with the exponential. However, this is partially misleading, as although GRB 970508 is better fit by an exponential model, the r1/4 model cannot be ruled out by the data (with =0.85). Other examples can be seen from Table 2, and the model independent CAS parameters (§3.2) are perhaps a better way to quantify and compare the structures of faint high-z systems.
With this caveat in mind, we find that the exponential model provides the best fit for the hosts of GRB 970508, GRB 980703 and GRB 990712 (see Table 2 where the values for these galaxies are listed for both fits). In the cases of GRB 991208 and GRB 000418, the data are better fit with a de Vaucouleurs profile, although for these galaxies the difference in between the two models is not very large. An early type interpretation however agrees with that found using the CAS methodology (Table 1; §3.2). For the other three galaxies, both models fit the data nearly equally well (Table 2), and are more irregular/peculiar in appearance (§3.2). It appears from this that the structures of GRB host galaxies are not all identical, but have a diversity in profile shapes, which is confirmed by visual impressions and the analysis in §3.2.
3.2 CAS and Size Parameters
3.2.1 Background
The CAS (concentration, asymmetry, clumpiness) parameters are useful for characterizing the structural properties of galaxies using model independent measurements. Unlike surface brightness fits, CAS parameters can be measured for most of the GRB hosts, even the fainter systems. Previously, Schade et al. (1995), Abraham et al. (1996), Conselice (1997), Bershady et al. (2000), Conselice et al. (2000a,b), Conselice (2003) and Mobasher et al. (2004) have shown that galaxies can be roughly classified in three broad morphological classes: E/S0, spiral, and peculiar/irregular/merging galaxies on the basis of their central concentration and asymmetry. We apply the methods of Conselice (2003) to determine CAS parameters for our GRB host galaxies and compare these with previous measurements of nearby and high redshift galaxies. The resulting values and types are listed in Table 1.
We also measure the sizes of the GRB host galaxies through the CAS method which utilizes the Petrosian radius (e.g., Petrosian 1976; Bershady et al. 2000). The radius we measure for each galaxy is 1.5 times the radius where the inverse Petrosian index reaches .
3.2.2 Measurements
The definition of the central concentration () we used in this paper, following Bershady et al. (2000), is: = 5 log10 (r80/r20), where r80 (r20) is the radius that contains 80% (20%) of the galaxy light. A galaxy with a steep profile, such as an elliptical, will show a relatively large value for the concentration parameter (), while galaxies with a more shallow light profile, such as spiral and irregular galaxies, will have lower values.
The asymmetry parameter () is determined by rotating a galaxy by 180 from its center, and subtracting the rotated image from the original image. A perfectly symmetric galaxy will show no residuals in the difference image, while a galaxy with asymmetric features such as bright star-forming regions, or an interacting galaxy, will have large residuals. The absolute value of the pixels in the difference image, normalized by the pixel values in the original image, and corrected for the background, gives a measure of the asymmetry parameter (Conselice et al. 2000a, Conselice 2003),
where and are the pixel intensities in the original and rotated image, respectively, and the corresponding values represent the blank field (background) region used to account for the intrinsic asymmetry due to the background noise. Determination of the center of rotation is important, as is the radius in which the parameter is measured (see Conselice et al. 2000a). The asymmetry routine computes the asymmetries on a grid of centers around an initial center value until a minimum asymmetry is found (within 5 pixels). We always used for the asymmetry computations. The clumpiness index (), which is defined in a similar way, is too difficult to measure for most of the GRB hosts due to their faintness, and we do not consider this parameter in our analysis. To calculate the concentration and asymmetry parameters we place the initial center for our analysis on the location shown by the circles on Figure 1. The code measures the Petrosian radii and then measures the parameters within this determined radius (Conselice 2003). For the irregular and merger systems shown in Figure 1 the other ‘parts’ of the host are included if they are within this radius. This is the same method used on the Hubble Deep Field data sets, and thus allows for a fair comparison.
3.2.3 Biases
Although this classification method is very promising, there are some caveats. One is that when observing high-redshift galaxies, one has to be careful when comparing values with those of local galaxies because of bandshifting effects: the rest-wavelength probed is bluer and therefore galaxies may appear more asymmetric due to the dominant patchy younger stellar populations (e.g., Windhorst et al. 2002). However, from a multi-wavelength study of a small sample of nearby starburst galaxies Conselice et al. (2000c) find that starburst galaxy morphology changes little from the visible to the ultra-violet (UV) wavelength regimes, suggesting that the inferred morphology of starburst galaxies at high redshift is likely similar to their local classification. Investigating the wavelength-dependent morphology of nearby galaxies, Kuchinski et al. (2000) and Windhorst et al. (2002) also find that the change in apparent morphology from the visible to UV is dramatic for early-type spirals with prominent bulges, but modest for late-type spirals and irregulars. These results suggest that the change in inferred morphology with increasing redshift for GRB host galaxies, which on the basis of their star-formation rate are thought to be actively star-forming galaxies, is unlikely to be very large.
To understand quantitatively the systematics in measuring parameters at high redshifts, we carried out a series of simulations of nearby galaxies to determine how CAS and size parameters change with distance. These simulations include surface brightness dimming, reduced resolution, and increased amounts of added noise. We degrade the images of nearby galaxies, to be at the GRB redshifts used in this paper, with the same exposure time used to image the GRB hosts. We used these new images to determine how changes in redshift result in different CA measurements. We carried out these simulations using 82 nearby normal galaxies of all Hubble types, the same used in the simulations discussed in Conselice (2003). We find that the concentration and asymmetry values decline, on average, by and due to redshift effects. These values change only slightly at higher and lower redshifts than the median redshift. Furthermore, we find that on average, a galaxy will appear 25% smaller in the STIS/ACS/WFPC2 host imaging due to surface brightness dimming. Unless specified we however do not generally apply these corrections to the CAS and radii values.
4 Results
4.1 GRB Host Comparison with Field Galaxies
![[Uncaptioned image]](/html/astro-ph/0508197/assets/x3.png)
The concentration versus asymmetry diagram for galaxies brighter than in the HDF. The different symbols correspond to the broad Hubble type bins into which the galaxies were visually classified: ellipticals are shown as filled circles, spirals as filled triangles, peculiar galaxies as stars and unclassified galaxies with as dots. Although there is some overlap, three different regions can be distinguished, which are separated by the solid lines. Local galaxies with an asymmetry larger than 0.35 tend to be mergers. The line separating the elliptical from the spiral region is a “best estimate” by eye.
We used three galaxy samples to compare the measured asymmetries and central concentrations of the GRB host galaxies. The first one is a BVI summed image of the Hubble Deep Field North (HDF-N) (Williams et al. 1996), for which a visual classification is available for galaxies between and (van den Bergh et al. 1996). We used a BVI combined image of the HDF-N to match the wide wavelength range of the GRB host observations, although using individual bands gives the same results. We have performed two CAS measurement runs on the HDF: one with the full depth, in order to compare the concentration-asymmetry (CA) values that we find with the visual classification of HDF galaxies (Figure 3), and one where we have degraded the HDF-N image to match the typical noise level of the images containing the GRB hosts (Figure 4). We did not rebin the images to match the pixel-size of the STIS images (00254) with that of the HDF (004). We add noise to this sum to scale it to the typical exposure time of the host galaxy images (exposure time ratio is roughly 25), and calculate the CA values for the detected galaxies (crosses in Figure 4). For a second comparison sample we have measured CA values for all the galaxies that are detected in the GRB host images. This second sample allows for a direct comparison of the morphology of the hosts with that of an unbiased sample of galaxies that were imaged with the same pixel size, depth, and filter. A third comparison is Hubble Deep Field galaxy rest-frame CAS parameters with redshifts from Conselice et al. (2005).
We used the SExtractor code (Bertin & Arnouts 1996) to detect objects on both the GRB and HDF images, and we used these positions as input for the CAS code to calculate asymmetry and concentration indices. For the object detection the images are first smoothed with a Gaussian function, after which we included objects in our catalog that have at least 3 contiguous pixels that are each 2 above the sky background. For the full depth HDF we relaxed this condition to 10, as we are not interested in the very faintest objects. We used SExtractor’s star-galaxy separator stellaricity index to eliminate stars, by removing objects with values . The remaining objects are checked for saturation, and put into the CAS routines. SExtractor sometimes finds several “centers” (peaks) for the same galaxy. We investigated if there is another peak present within a radius of 05 for these systems. If so, we choose the peak with the lowest value for the asymmetry, and discard the other peak. We perform the same exercise for the host galaxies. As an example, for GRB 991208, SExtractor picks up a peak eastward of the presumed host. Centering at this peak, the asymmetry routine measures a much larger asymmetry, and is therefore discarded. We also removed all foreground stars and background/foreground galaxies near each host galaxy before measuring and values.
The results of these analyses are shown in Figure 3 where we plot a C-A diagram for the galaxies brighter than roughly =24 in the HDF-N. As shown by Conselice (2003) and Conselice et al. (2003), galaxies of different Hubble types are located in different parts of this diagram. These broad bins can be roughly separated by the shown solid lines. The vertical line at an asymmetry value of corresponds to the threshold above which nearly all galaxies are mergers (see Conselice et al. 2000b; Conselice 2003; Hernandez-Toledo et al. 2005). In Figure 4 we show the CA values for 37 host galaxies compared with all the other galaxies detected in the same images (solid dots).
Examining Figures 3 and 4 and applying the concentration and asymmetries corrections discussed in §3.2.3 places a few more GRB hosts in the region of major mergers than what their measured location suggests. This reveals that GRB hosts have a slightly higher than average merger rate at compared with photometrically selected field samples (e.g., Conselice et al. 2003a; Lin et al. 2004; Bundy et al. 2004), although mergers cannot account for all GRB hosts.
4.2 GRB Host Galaxy Structures
It appears from Figures 1-4, and the discussion in §3, that GRB host galaxies arise in all types of field galaxies, not just irregular or peculiar starbursts. For the sample of eight bright hosts which we fit exponential and de Vaucouleur profiles, we find that the GRB hosts are not uniformly either spiral galaxy-like or elliptical-like, but are a mix of all types. The scale lengths of the hosts also range from very small, 0.14 kpc in the case of GRB 991208, to a value that is comparable to the Galactic scale length: 4.7 kpc for the host of GRB 990705. This effectively also spans the range in the sizes of field galaxies at these redshifts (§4.3).
We used the value of the central concentration and asymmetry of a galaxy as a rough indication for its morphology, and as a means of quantifying the differences between GRB hosts and other field galaxies. Both the HDF and field galaxy comparison samples occupy roughly the same regions in the C-A space as the GRB hosts (Figures 3 & 4), which suggests that GRB host galaxies are typical field galaxies, and are not exclusively mergers or peculiars, such as sub-mm galaxies and bright Lyman-break galaxies (Conselice et al. 2003a,b). Many hosts have C-A values in the spiral region close to the “border” with the local merger population. For example, the host of GRB 990705 is clearly a “grand-design” late-type spiral (Le Floc’h et al. 2002), in agreement with its position in the C-A diagram.
![[Uncaptioned image]](/html/astro-ph/0508197/assets/x4.png)
The concentration versus asymmetry diagram for our sample of host galaxies, together with all other galaxies that are present in the GRB host galaxy images (solid dots), and galaxies in a BVI sum of the images of the HDF (crosses), with added noise to mimic the typical exposure time of the host-galaxy images. The systems which are circled are those for which we performed surface brightness fits (§3.1). The host GRB 970828 is not plotted here due to its negative asymmetry value.
Several of the GRB hosts studied in this paper has been examined previously. Odewahn et al. (1998) analyzed the morphology of the host of GRB 971214 using surface brightness fits and apparent morphology. Odewahn conclude, as we do, that this host has a compact but irregular structure. Similarly, the host of GRB 980703, studied by Holland et al. (2001) with STIS on HST, is found to be a late-type disk with asymmetric structures, similar to what we find. The host of GRB 980613 was previously studied by Hjorth et al. (2002), who find an asymmetric and chaotic structure, while Gorosabel et al. (2003) argue that the host of GRB 000418 is compact and smooth, both in agreement with our results (Table 1). In total, we find that the hosts of GRB 980613, GRB 010222, GRB 020405 and GRB 020903 are all located in the peculiar section/merger area of the C-A diagram. For GRB 980613, GRB 020405 and GRB 020903 this is not unexpected, since these all appear very peculiar. For GRB 010222 this is less obvious, although for this galaxy a sub-mm flux is measured that is consistent with the host being an intense starburst galaxy (Frail et al. 2002).
Interestingly, the CA values for twelve hosts are consistent with an early type morphology. Two of these, GRB 000418 and GRB 010222, have a very high star-formation rate inferred from sub-mm observations (Frail et al. 2002; Berger et al. 2003), which might seem contradictory to their elliptical appearances. Low luminosity ellipticals at are however generally blue with star formation throughout their structures (Stanford et al. 2004). Furthermore, Arp 220-like galaxies, probable ellipticals in formation, have light profiles with a r1/4 form, and contain high light concentrations. Assuming that GRBs are related to the deaths of massive stars, and that nuclear starbursts mimic an elliptical appearance, the concentrated hosts may contain nuclear starbursts. In fact, the projected afterglow position of GRB 970508 is so close to the center of the galaxy, that Fruchter et al. (2000) suggested that the burst may originate from such a nuclear starburst forming into an early-type galaxy.
In conclusion, from both surface brightness profile fitting and through measuring the central concentration and asymmetry of a sample of GRB host galaxies, we find that GRB hosts do not fit into one clear single morphological class of galaxy. In the concentration-asymmetry diagram, most GRB hosts are consistent with spirals or irregular galaxies, although galaxies consistent with being mergers and early types are also found. This likely reveals that massive star formation is not produced in one single method, but in several different ways, such as major and minor mergers, and the accretion of gas from the intergalactic medium.
4.3 Evolution of Host Galaxy Sizes
We measure the sizes of our GRB host galaxy sample utilizing the Petrosian radius (Bershady et al. 2000; Graham et al. 2005), which for our purposes is defined as 1.5 r() = 0.2 (Table 1). We also compute the identical radius for galaxies within the HDF (Conselice et al. 2005). The GRB host galaxy sizes have been corrected by adding an additional amount to the measured sizes, based on the redshift of the host and the results of our simulations (see §3.2.3). This procedure adds on average an additional 25% to the sizes of the GRB hosts. We also perform a similar, but smaller, correction to the measured sizes of the HDF galaxies (see Conselice et al. 2005 for details).
As can been seen from Table 1, there are many GRB host galaxies with very small Petrosian radii kpc, although there are a few exceptions (GRBs 970828, 990705, 011121, 020405). The average Petrosian radius of the GRB hosts at is 6.7 kpc (quoted errors are the standard error of the mean), after removing systems which are merging based on the asymmetry index. This is smaller than the average Petrosian radius of 12.08.5 kpc for field galaxies at . The average GRB host size at reduces even further to 4.5 kpc if we remove the GRB 990705 host, which is a large spiral system at . On the other hand, the GRB host galaxy sizes at tend to be roughly the same as the average size of field galaxies at these redshifts. The average Petrosian radius for GRB hosts at is 6.84.0 kpc, compared with an average field galaxy Petrosian radius of 7.12.0 kpc. Thus, it appears that the sizes of GRB hosts may not change significantly, but that the general field population does, such that GRB hosts are less representative of the galaxy population at lower redshift, than at higher redshift.
4.4 Evolution of GRB Host Galaxy Structure
We have a large enough sample of host galaxies to study the evolution of CAS parameters as a function of redshift. We can also compare GRB host properties to the properties of field galaxies in the HDF at similar redshifts. As discussed in §4.1 we find little difference between the concentration () and asymmetry parameters () for the GRB hosts compared with HDF galaxies in general. This extends when we compare HDF field galaxies at low redshift to the GRB hosts found at . For this comparison we divide our GRB sample into two redshift ranges at and which contains roughly the same number of hosts. We find that the hosts at are different from the general galaxy population in terms of their light concentrations.

Concentration and asymmetry values are plotted as function of redshift for the GRB hosts (circled crosses) and for HDF galaxies (tiny dots) on Figure 5. From this figure, it can be seen that the GRB hosts occupy the high-C range at . A two-dimensional K-S test shows that there is only a 2.5 chance that the values of the GRB hosts, and those of HDF field galaxies, arise from the same distribution, and our sample size is large enough to make this result statistically meaningful. This probability becomes higher when we apply the corrections discussed in §3.2.3. It thus appears that at the majority of detected GRB hosts are highly concentrated galaxies, suggesting that they are forming into elliptical galaxies, or are blue compact galaxies. These highly concentrated galaxies are also fairly large, with a few among the largest GRB hosts known. The concentration index also broadly correlates with stellar mass such that higher concentrated objects contain a higher stellar mass (Conselice et al. 2005), suggesting that these galaxies could be more massive than average field galaxies at .
There are several things which could be biasing this result. The first is that not all GRB hosts have redshifts and some are therefore not included in our analysis. However, as Table 1 shows, many of the hosts without redshifts have high concentration indices, with GRBs 020127, 020322, 020427, 030115 all with , and because these GRB hosts are faint, they are more likely at higher redshifts. There is also no correlation between the magnitude of the host galaxies and the concentration index, thus it is unlikely that the faint hosts we are not including are predominately of lower concentration. Thus, not including these few systems is not likely to bias our results. Our results are also unlikely to be the result of a morphological k-correction bias, as high redshift galaxies become less concentrated when viewed in the rest-frame UV, and starbursting galaxies look very similar in the UV and optical (Conselice et al. 2000c; Windhorst et al. 2003; Papovich et al. 2003). The structures of GRB hosts are therefore not expected to change much with wavelength, as they are for the most part starbursting systems (see also Christensen, Hjorth & Gorosabel 2004).
This is another indication that GRB hosts are involved in star formation, and importantly trace out galaxies undergoing rapid star formation. The logic behind this is based on a comparison to HDF galaxies, as follows. It appears that at high redshift () the most concentrated galaxies account for a significant fraction of all ongoing star formation, while at lower redshift the star formation density is occupied by lower mass systems (Conselice et al. 2005). This is also seen in the GRB hosts, under the assumption that GRB hosts are star forming galaxies. This is likely a signature of the down-sizing of galaxy formation seen in other aspects as well (e.g., Cowie et al. 1996; Bundy et al. 2005).
This evolution in starburst behavior can be seen by examining the stellar mass and luminosity attached to galaxies in the HDF-N with concentrations as large as the ones found for the GRB hosts. In the HDF between , only 92% of the stellar mass is attached to galaxies with values as high as the GRB hosts (see Conselice et al. 2005). The rest-frame B-band luminosity fraction for galaxies with concentrations this high is 173%. Thus, the ratio of luminosity to stellar mass for field galaxies with concentrations as large as the GRB hosts at these redshifts is about a factor of two, suggesting that highly concentrated galaxies are undergoing a disproportionate amount of star formation for their stellar mass, and GRB hosts at are among these systems. There is also a suggestion that other starbursting populations at high redshift have similar CAS, particular high concentration, values (Chapman et al. 2003; Conselice et al. 2003b). We still only have a limited number of GRB host images however, and future observations are required before we can definitely place constraints on the entire GRB population. Other properties such as direct measurements of stellar masses are needed to make definite comparisons to field galaxies selected by other methods at . The Swift satellite, combined with deep HST imaging or ground based adaptive optics, should revolutionize our knowledge of GRB host galaxies in the coming years, and potentially extend these results to even high redshifts.
5 Discussion
Our results can be summarized by the following: first, the morphological distribution of GRB hosts includes all galaxy morphological types, including spirals, ellipticals, irregulars and peculiars/mergers. There is not a single morphological type where GRBs are likely to trigger. Second, we claim that the structures of GRB hosts changes with time, such that hosts found at are more concentrated. Because highly concentrated galaxies in both the nearby and distant universe are typically early-types, or early-types in formation, and tend to have a larger stellar mass than less concentrated galaxies, we conclude that the higher redshift GRB hosts are possibly more massive than a typical field galaxy. Stated another way, galaxies in which GRBs are found change with redshift, such that at the highest redshifts, they may not be small low mass systems, as they tend to be at lower redshifts. We however are not claiming that GRB hosts at are situation within the most massive starbursting systems, such as sub-mm sources, but that they are among the more massive average field galaxies at these redshifts. Our morphological and size measurements for GRB hosts at is consistent with the interpretation of these systems as mostly small, lower mass galaxies.
There has been some previous work on the higher redshift GRBs studied in this paper that may contradict the interpretation of these systems as galaxies. It is fairly clear that GRB hosts are not all dusty starbursts, as revealed through a lack of sub-mm detections for most known hosts (Tanvir et al. 2004; Smith et al 2005). However, some GRB hosts, such as GRB 010222, are detected in the sub-mm, with a large inferred star formation rate and a large bolometric flux (Frail et al. 2002). There are also examples of radio luminous hosts, such as GRB 980703, which have total infrared luminosities of L⊙ and star formation rates approaching 1000 M⊙ yr (Berger et al. 2001). Furthermore, Chary et al. (2002) examined the spectral energy distributions of 12 GRB hosts and concluded that three have infrared luminosities comparable to infrared luminous galaxies.
There is also some evidence that GRBs are situated in regions of low dust extinction. For example, Vreeswijk et al. (2004) studied the properties of the gas in GRB 030323 and found a low metallicity environment, and a high column density of neutral hydrogen in the region around the burst. Hjorth et al. (2003b) find a similar pattern for GRB 020124 located in a damped lyman-alpha system at . Also, GRB hosts are more often Lyman-alpha emitters than Lyman-break galaxies (Fynbo et al. 2003). These results tend to imply that GRB host galaxies are largely dust-free systems, yet GRBs may be situated in low-metallicity regions of distant galaxies, or the intense energy ejecta from GRBs destroys any nearby dust (e.g., Galama et al. 2003). Also, Savaglio et al. (2004) find that some GRB hosts contain evidence for large dust depletion, thus it is not clear if GRB hosts are all dust free systems.
Finally, several studies have argued that GRB host galaxies are sub-massive and blue systems (e.g., Le Floc’h et al. 2003) based on near infrared imaging. The Le Floc’h et al. (2003) study, and others (e.g., Chary et al. 2002) are based on small samples of GRB hosts, most of which are at . Our results agree with the conclusion from these studies, as we find that GRB hosts at tend to be taken from the smallest field galaxies at . However, these studies do not contain a significant number of sources at the highest redshifts, those at , which tend to have higher luminosities. In fact, the highest redshift source in Le Floc’h et al. (2003), GRB 971214, at , is the most luminous in their sample with an absolute magnitude of M.
Our results indicate that the hosts at are indeed small star forming galaxies, with a range of morphologies. At , the situation is different, such that the hosts are more concentrated than the average field galaxy at similar redshifts at a confidence of %. The average size for hosts at is 6.84.0 kpc, similar to within the errors of the average Petrosian radius for field galaxies at similar redshifts, and for galaxies with similar concentration indices. At lower redshifts, the concentration index for hosts becomes lower, and the sizes become smaller, relative to the average field galaxy. This implies that the sizes of GRB host galaxies do not change significantly with time, while the general field galaxy population becomes larger. On the other hand, the higher concentration index could either imply that these are progenitors of massive galaxies, or that they are blue compact galaxies, which also tend to have similar high concentration values (Jangren et al. 2005 in prep). In either case, the type of galaxy in which GRBs are found changes with redshift into the population that dominates the star formation.
6 Summary
In this paper we study the structural parameters of 37 Gamma-ray bursts (GRB) host galaxies imaged by the Hubble Space Telescope. We used two methods to characterize the structures of these galaxies. For the brightest systems at we fitted exponential and de Vaucouleur r1/4 profiles, determining that GRB hosts are not uniform, as some are better fit with the exponential than the de Vaucouleur profile, and vice versa. We also measured the concentration and asymmetry parameters for all 37 host galaxies, finding that the hosts are not selected from one type of galaxy, but span a range from highly concentrated systems resembling ellipticals in formation, disk like galaxies, and systems undergoing merging.
After dividing the sample into two redshift ranges we find that the higher redshift () GRB hosts have a higher concentration index than field galaxies at similar redshifts, at a significance level %, yet they have similar sizes. Using the Hubble Deep Field North we also show that systems with concentration values this high at are undergoing a disproportionate amount of star formation. On the other hand, lower redshift systems at are found to span all morphological types, and have sizes smaller than the average field population within the same redshift range. This is perhaps an indication that the nature of GRB hosts changes as a function of redshift. While lower redshift GRB hosts are smaller and perhaps lower mass bluer galaxies (e.g., Le Floc’h et al. 2003), higher redshift hosts are more concentrated and have typical field galaxy sizes. This is likely due to the fact that galaxies in which star formation occurs changes with redshift, with the most massive systems undergoing the most formation at higher redshifts (e.g., Cowie et al. 1996; Conselice et al. 2003; Heavens et al. 2004; Bundy et al. 2005). This further suggests that GRBs are potentially one of the best ways to locate the first galaxies forming at in the densest areas of the universe.
References
- (1)
- (2) Abraham, R.G., Tanvir, N.R., Santiago, B.X., Ellis, R.S., Glazebrook, K., & van den Bergh, S. 1996, MNRAS, 279, L47
- (3) Barth, A.J., et al. 2003, ApJ, 584, 47L
- (4) Berger, E., Cowie, L.L., Kulkarni, S.R., Frail, D.A., Aussel, H., & Barger, A.J. 2003, ApJ, 588, 99
- (5) Berger, E., Kulkarni, S.R., & Frail, D.A. 2001, ApJ, 560, 652
- (6) Bershady, M.A., Jangren, A., & Conselice, C.J. 2000, AJ, 119, 2645
- (7) Bertin, E., & Arnouts, S. 1996, A&AS, 117, 393
- (8) Bloom, J.S., Djorgovski, S.G., & Kulkarni, S. 2001, 554, 678
- (9) Bloom, J.S., Kulkarni, S.R., & Djorgovski, S.G. 2002, AJ, 123, 1111
- (10) Bloom, S.J., Berger, E., Kulkarni, S., Djorgovski, S., & Frail, D. 2003, ApJ, 125, 999
- (11) Bloom, J.S., et al. 1999, Nature, 401, 453
- (12) Budavári, T., Szalay, A.S., Connolly, A.J., Csabai, I., Dickinson, M. 2000, AJ, 120, 1588
- (13) Bundy, K., Fukugita, M., Ellis, R.S., Kodama, T., & Conselice, C.J. 2004, ApJ, 601, 123L
- (14) Bundy, K., Ellis, R., Conselice, C.J., 2005, ApJ, 625, 621
- (15) Castro-Tirado, A., et al. 2001, A&A, 370, 398
- (16) Castro, S., Galama, T.J., Harrison, F., Holtzman, J., Bloom, J.S., Djorgovski, S., & Kulkarni, S. 2003, ApJ, 586, 128
- (17) Chapman, S.C., Windhorst, R., Odewahn, S., Yan, H., Conselice, C. 2003, ApJ, 599, 92
- (18) Chary, R., Becklin, E.E., Armus, L. 2002, ApJ, 566, 229
- (19) Christensen et al. 2004, astro-ph/0407066
- (20) Christensen, L., Hjorth, J., & Gorosabel, J. 2004, A&A, 425, 913
- (21) Conselice, C.J. 1997, PASP, 109, 1251
- (22) Conselice, C.J., Bershady, M.A., & Jangren, A. 2000a, ApJ, 529, 886
- (23) Conselice, C.J., Bershady, M.A., & Gallagher, J.S. 2000b, A&A, 354, 21L
- (24) Conselice, C.J., Gallagher, J.S., Calzetti, D., Homeier, N., & Kinney, A. 2000c, AJ, 119, 79
- (25) Conselice, C.J. 2003, ApJS, 147, 1
- (26) Conselice, C.J., Bershady, M.A., Dickinson, M., & Papovich, C. 2003a, AJ, 126, 1183
- (27) Conselice, C.J., Chapman, S.C., Windhorst, R.A. 2003b, ApJ, 596, 5L
- (28) Conselice, C.J., et al. 2004, ApJ, 600, 139L
- (29) Conselice, C.J., Blackburne, J., & Papovich, C. 2005, ApJ, 620, 564
- (30) Daddi, E., et al. 2004, ApJ, 600, 127L
- (31) Dickinson, M., et al. 2000, ApJ, 531, 624
- (32) Djorgovski, S.G., Kulkarni, S.R., Bloom, J.S., Goodrich, R., Frail, D.A., Piro, L., & Palazzi, E. 1998, ApJ, 508, 17L
- (33) Djorgovski, S.G., Frail, D.A., Kulkarni, S.R., Bloom, J.S., Odewahn, S.C., & Diercks, A. 2001, ApJ, 562, 654
- (34) Djorgovski, S.G., Bloom, J.S., & Kulkarni, S. 2003, 591, 13L
- (35) Ferguson, H.C., et al. 2004, ApJ, 600, 107L
- (36) Frail, D.A., et al. 2002, ApJ, 565, 829
- (37) Franx, M., et al. 2003, ApJ, 587, 79L
- (38) Fruchter, A.S., & Hook, R.N. 2002, PASP, 114, 144
- (39) Fruchter, A.S., et al. 2005, in prep
- (40) Fruchter, A.S., et al. 2000, ApJ, 545, 664
- (41) Fruchter, A.S., et al. 1999, ApJ, 516, 683
- (42) Fruchter, A.S., Vreeswijk, P., Rhoads, J., & Burud, I. 2001, GCN, 1200
- (43) Fynbo, J.P.U., et al. 2003, A&A, 406, 63L
- (44) Galama, T.J., et al. 1998, Nature, 395, 670
- (45) Galama, T.J., et al. 2000, ApJ, 536, 185
- (46) Galama, T.J., et al. 2003, ApJ, 587, 135
- (47) Gorosabel, J., et al. 2003, A&A, 409, 123
- (48) Heavens, A., Panter, B., Jimenez, R., & Dunlop, J. 2004, Nature, 428, 625
- (49) Hernandez-Toledo, H.M., Avila-Reese, V., Conselice, C.J., & Puerari, I. 2005, AJ, 129, 682
- (50) Hjorth, J., et al. 2003a, Nature, 423, 847
- (51) Hjorth, J., et al. 2003b, ApJ, 597, 699
- (52) Hjorth, J., et al. 2002, ApJ, 576, 113
- (53) Holland, S., Bjornsson, G., Hjorth, J., & Thomsen, B. 2000, A&A, 364, 467
- (54) Holland, S., et al. 2001, A&A, 371, 52
- (55) Hughes, D.H., et al. 1998, Nature, 394, 241
- (56) Jha, S., et al. 2001, ApJ, 554, 155L
- (57) Krist, J. 1995, in ASP Conf. Series 77, Astronomical Data Analysis Software and Systems IV, Vol. 4, 349
- (58) Kuchinski, L.E., et al. 2000, ApJS, 131, 441
- (59) Kulkarni, S.R., et al. 1998, Nature, 393, 35
- (60) Kulkarni, S.R., et al. 1999, Nature, 398, 389
- (61) Lehmer, B.D. et al. 2005, AJ, 129, 1
- (62) Le Floc’h, E., et al. 2003, A&A, 400, 499
- (63) Le Floc’h, E., et al. 2002, ApJ, 581, 81L
- (64) Lin, L. et al. 2004, ApJ, 617, 9L
- (65) MacFadyen, A.I., & Woosley, S.E. 1999, ApJ, 524, 262
- (66) Masetti, N., et al. 2003, A&A, 404, 465
- (67) Metzger, M., et al. 1997, Nature, 387, 878
- (68) Mirabel, N., et al. 2003, ApJ, 595, 935
- (69) Mobasher, B., Jogee, S., Dahlen, T., de Mello, D., Lucas, R.A., Conselice, C.J., Grogin, N.A., Livio, M. 2004, ApJ, 600, 143L
- (70) Moustakas, L., et al. 2004, ApJ, 2004, 600, 131L
- (71) Nelder, J. & Mead, R. 1965, Computer Journal, 7, 308
- (72) Odewahn, S.C., et al. 1998, ApJ, 509, 5L
- (73) Papovich, C., Dickinson, M., Giavalisco, M., Conselice, C.J., Ferguson, H.C. 2003, ApJ, 598, 827
- (74) Petrosian, V. 1976, ApJ, 209, 1L
- (75) Press, W.H., Teukolsky, S. A., Vetterling, W. T., & Flannery, B. P. 1992, Numerical Recipes in C (New York: Cambridge Univ. Press)
- (76) Price, P., et al. 2002, ApJ, 571, 121L
- (77) Reichart, D.E. 1999, ApJ, 521, L111
- (78) Rhoads, J.E., & Fruchter, A.S. 2001, ApJ, 546, 117
- (79) Schade, D., Lilly, S.J., Crampton, D., Hammer, F., Le Fevre, O., & Tresse, L. 1995, ApJ, 451, L1
- (80) Soderberg, A.M., et al. 2004, ApJ, 606, 994
- (81) Smith, I., et al. 2005, astro-ph/050357
- (82) Somerville, R.S., et al. 2004, ApJ, 600, 135L
- (83) Stanek, K.Z., et al. 2003, ApJ, 591, 17L
- (84) Stanford, S.A., Dickinson, M., Ferguson, H.C., Lucas, R.A., Conselice, C.J., Budavari, T., & Somerville, R. 2004, AJ, 127, 131
- (85) Steidel, C.C., & Hamilton, D. 1992, AJ, 104, 941
- (86) Savaglio, S., & Fall, F.M. 2004, ApJ, 614, 293
- (87) Tanvir, N.R., et al. 2004, MNRAS, 352, 1073
- (88) van den Bergh, S., Abraham, R.G., Ellis, R.S., Tanvir, N.R., Santiago, B.X., & Glazebrook, K.G. 1996, AJ, 112, 359
- (89) Vreeswijk, P.M., Fruchter, A., Ferguson, H., & Kouveliotou, C. 2000, GCN, 751
- (90) Vreeswijk, P.M., et al. 2001, ApJ, 546, 672
- (91) Vreeswijk, P., Fruchter, A., Hjorth, J., Kouveliotou, C. 2003, GCN, 1785
- (92) Vreeswijk, P.M., et al. 2004, A&A, 419, 927
- (93) Williams, R.E., et al. 1996, AJ, 112, 1335
- (94) Windhorst, R.A., et al. 2002, ApJS, 143, 113
- (95) Woosley, S.E. 1993, ApJ, 405, 273
![[Uncaptioned image]](/html/astro-ph/0508197/assets/x6.png)
![[Uncaptioned image]](/html/astro-ph/0508197/assets/x7.png)