Globular Clusters in NGC 4365: New -band Imaging and a Reassessment of the Case for Intermediate-age Clusters ††thanks: Based on observations collected at the European Southern Observatory, Chile under programmes 70.B-0289A and 71.B-0303A, and with the NASA/ESA Hubble Space Telescope, obtained at the Space Telescope Science Institute, which is operated by the Association of Universities for Research in Astronomy, Inc., under NASA contract NAS 5-26555 ,††thanks: Table 3 is only available in electronic form at the CDS via anonymous ftp to cdsarc.u-strasbg.fr (130.79.128.5) or via http://cdsweb.u-strasbg.fr/cgi-bin/qcat?J/A+A/
We study the globular cluster (GC) system of the Virgo giant elliptical galaxy NGC~4365, using new wide-field -band imaging from the ESO 3.5 m New Technology Telescope, archive and imaging from FORS1 on the ESO VLT and HST/WFPC2+ACS data. As in most other large ellipticals, the GC colour distribution has (at least) two peaks, but the colours of the red GCs appear more strongly weighted towards intermediate colours compared to most other large ellipticals and the integrated galaxy light. The intermediate-color/red peak may itself be composed of two sub-populations, with clusters of intermediate colours more concentrated towards the centre of the galaxy than both the blue and red GCs. Nearly all GCs in our sample fall along a well-defined narrow sequence in the (,) two-colour diagram, with an offset towards red and/or blue colours compared to simple stellar population models for old ages. This has in the past been interpreted as evidence for an intermediate-age population of GCs. The offset is however seen for nearly all metal-rich clusters within the SOFI field, not just those of intermediate colours. We combine our data with previously published spectroscopy resulting in a sample of 25 GCs with both spectroscopy and photometry. The differences between observed and model colour-metallicity relations are consistent with the offsets observed in the two-colour diagram, with the metal-rich GCs being too red (by mag) in and too blue (by mag) in compared to the models at a given metallicity. These offsets cannot easily be explained as an effect of younger ages. We further compare the colour-metallicity relation for GCs in NGC 4365 with previously published data for NGC~3115 and the Sombrero galaxy, both of which are believed from spectroscopic studies to host exclusively old GC populations, and find the colour-metallicity relations for all three galaxies to be very similar. We review the available evidence for intermediate-age GCs in NGC 4365 and conclude that, while this cannot be definitively ruled out, an alternative scenario is more likely whereby all the GCs are old but the relative number of intermediate-metallicity GCs is greater than typical for giant ellipticals. The main obstacle to reaching a definitive conclusion is the lack of robust calibrations of integrated spectral and photometric properties for stellar populations with near-solar metallicity. In any case, it is puzzling that the significant intermediate-colour GC population in NGC 4365 is not accompanied by a corresponding shift of the integrated galaxy light towards bluer colours.
Key Words.:
galaxies: elliptical and lenticular, cD — galaxies: evolution — galaxies: star clusters — galaxies: individual (NGC 4365)1 Introduction
One of the main motivations for the numerous studies of extragalactic globular cluster (GCs) carried out over the past 1-2 decades is the expectation that GCs can be used as tracers of (major) star formation episodes in their host galaxies. To first order, it is probably safe to assume that the apparent ubiquity of bi-modal colour distributions in GC systems (Larsen et al. lar01 (2001) - L2001; Kundu & Whitmore kw01 (2001); Gebhardt & Kissler-Patig gk99 (1999)) reflects corresponding multiple episodes/mechanisms of star formation. Assuming a one-to-one relation between “field” star populations and GCs in general may be dangerous, however. Metal-poor and metal-rich GCs appear to form (or survive!) with different efficiencies relative to field stars of the corresponding metallicities, as shown directly from photometry of resolved stars in the nearby giant elliptical NGC~5128 (Cen A) by Harris et al. (hhp99 (1999)). Harris & Harris (hh02 (2002)) find that the specific frequency of blue GCs in NGC 5128 is 3–5 times higher than for the red ones. In the giant Fornax elliptical NGC~1399, Forte et al. (ffg05 (2005)) have shown that the integrated galaxy colours and GC colour distributions suggest specific frequencies of for the red GCs and for the blue ones with respect to field stars of the same metallicities, i.e. there are about 4 times as many metal-poor GCs per metal-poor field star. While this assumes that the GCs and field stars follow the same radial distributions, the results are consistent with those for NGC 5128. This makes the integrated colours of early-type galaxies generally redder than the average colours of their GC systems. It is also worth keeping in mind that while some 2/3 of the known GCs in the Milky Way appear to be associated with the stellar halo (Zinn zinn85 (1985); Harris har96 (1996)), that component accounts for only % of the stellar mass in our Galaxy. The disk or our galaxy is about an order of magnitude more massive than the bulge (Dehnen & Binney db98 (1998)), so naively scaling from the bulge GCs one might expect about 500 GCs to have formed in the disk over its lifetime, or about one every 20 Myr on average. Few if any young clusters with masses greater than have in fact been identified so far in our Galaxy (the cluster Westerlund 1 may be one example, see Clark et al. cl05 (2005)), although they are frequently observed in many starbursts, mergers, and even some apparently normal spirals (see Larsen lar05 (2005) for a review). Real physical differences in the cluster mass functions can be difficult to disentangle from size-of-sample effects (Billett et al. bhe02 (2002); Larsen larsen02 (2002); Hunter et al. hun03 (2003); Whitmore whit03 (2003); Weidner et al. wkl04 (2004); Gieles et al. gie05 (2005)) and it remains unclear whether or not formation of massive star clusters is favoured relative to low-mass “open” clusters under certain conditions (e.g. intense starbursts). If we wish to use GCs as tracers of galaxy evolution, a necessary prerequisite will be to achieve a better understanding of the relationship between (massive) cluster formation/survival and star formation in general.
Among the GC systems of early-type galaxies, a particularly puzzling case is NGC 4365. The galaxy itself appears to be a typical giant elliptical galaxy in the Virgo cluster. It is among the 10 brightest early-type galaxies in Virgo (Binggeli et al. bin85 (1985)), but appears otherwise unremarkable. Tonry et al. (ton01 (2001)) derived a distance modulus of from surface brightness fluctuation (SBF) measurements, placing NGC 4365 about 0.5 mag ( Mpc) behind the M49 subcluster in the direction of the Virgo W cloud. NGC 4365 has a kinematically decoupled core (KDC; Surma & Bender sb95 (1995)), but this is not unusual among early-type galaxies and no relation has been found between the presence of KDCs and the overall properties of GC systems (Forbes et al. for96b (1996)). Surma & Bender derived a mean age of Gyr for the stellar population in NGC 4365 but this has later been revised to about Gyr by Davies et al. (dav01 (2001)) who also showed (based on SAURON data) that there are no age gradients across the central region where the KDC is located. The difference between the age estimates was mostly due to the use of different population synthesis models and in fact the H line-index measurements of Davies et al. were in good agreement with those of Surma & Bender. Brodie et al. (bro05 (2005)) quote similar H line-index measurements for NGC 4365 to those of Davies et al. and Surma & Bender, but also include the H and H lines. Depending on which lines are used, these data suggest ages between 7 and 14 Gyrs compared with simple stellar models by Thomas et al. (tmk04 (2004)). A critical difficulty in the interpretation of these results is the poor empirical constraints on simple stellar population (SSP) models at high metallicities. This problems also applies to the globular cluster system.
Only the innermost region ( pc) of NGC 4365 shows some evidence for a younger (by 3–4 Gyr) stellar population, but this accounts for no more than (Carollo et al. car97 (1997)). In other words, the stellar population in NGC 4365 appears to be uniformly very old, and if the KDC is the result of a merger event then this must have happened very long ago. Surma & Bender (sb95 (1995)) argue that a dissipationless (“dry”) merger of two early-type galaxies cannot have produced the observed kinematical properties of NGC 4365, because an infalling stellar system cannot avoid phase mixing and thus would not be observable as a kinematically distinct component.
In the context of these results, the GC system of NGC 4365 displays some quite remarkable characteristics. A rather large amount of data have now been collected, sometimes yielding contradictory results, so in the following we give a reasonably comprehensive review of the current status:
Ajhar et al. (aj94 (1994)) first noted that the colour distribution of GCs in NGC 4365 was relatively narrow compared to NGC~4472. This result has been confirmed by many studies based on imaging with the Hubble Space Telescope (Forbes for96 (1996); Gebhard & Kissler-Patig gk99 (1999); Larsen et al. lar01 (2001)) and must now be regarded as fairly secure. Initially, no evidence was found for bimodality in the colour distribution of NGC 4365 GCs, which appeared better fit by a single broad distribution with a centroid at intermediate colours. However, the WFPC2 photometry used in much of the early work on NGC 4365 was only moderately sensitive to metallicity differences, and the colour distribution could still be composed of a blue peak at the “normal” location ( or for an old stellar population) and a red peak shifted somewhat towards the blue with respect to the peak observed in most other large ellipticals (e.g. L2001). Since optical colours are degenerate in age and metallicity, an unusually blue colour for the red “peak” might be interpreted either as a result of lower metallicity, or younger age. We show below (§3) that bimodality is in fact visible even in the colour distribution.
The age-metallicity degeneracy can in principle be lifted by including multiple broad-band colours, each with different relative sensitivities to age and metallicity. Puzia et al. (puz02 (2002); P02) combined -band imaging of NGC 4365, obtained with the ISAAC instrument on the ESO VLT, with WFPC2 and imaging, and found the distribution of the NGC 4365 GCs in a vs. two-colour diagram to be different from those in NGC 3115, the Milky Way and M31, being shifted to bluer and/or redder colours. From a comparison with various SSP models, this was attributed to about 40%-80% of the clusters in their sample belonging to a population with ages in the range 2–8 Gyrs. However, spatial and photometric completeness did not permit strong constraints on the total number of candidate intermediate-age clusters. Supplementing the P02 data with deep -band imaging, Hempel & Kissler-Patig (2004b ) again found suggestions of an intermediate-age GC population in NGC 4365, but with even weaker constraints on the total number of clusters belonging to this population.
In Larsen et al. (lar03 (2003); hereafter Paper I) we presented Keck/LRIS spectroscopy for 14 confirmed GCs in NGC 4365, including 10 objects from P02. A comparison of Balmer line indices (H, H and H) with SSP models by Thomas, Maraston & Bender (tmb03 (2003)) and R. Schiavon seemed to confirm that some of the GCs had intermediate ages (–5 Gyrs). Since most of the GCs were selected as having colours suggestive of intermediate ages, this spectroscopic study also did not allow an estimate of the actual fraction. However, it was noted that the presence of a large number of intermediate-age GCs in NGC 4365 would be puzzling considering the uniformly old, luminosity-weighted age of the underlying stellar light. In Paper I we estimated that at most 5% of the total stellar mass at any given location within the galaxy could belong to a 5 Gyr population without noticeable effect on the H measurements of Davies et al. (dav01 (2001)). For a younger population, the limit is even lower.
Additional spectra were presented by Brodie et al. (bro05 (2005); Paper II). The candidates were selected from VLT/FORS1 and imaging, whose larger field of view allowed selection of a sample of 22 GCs. The P02 band data only covered a small fraction of the FORS1 field, and the spectroscopic sample of Brodie et al. was thus selected without regard to the colours of the clusters, although an effort was made to make sure the full range of colours was covered. Still, the Paper II sample included 12 objects with -band photometry from P02. In contrast to the Paper I study, and H line index measurements for all GCs in this new sample indicated old ( Gyr) ages (again using the Thomas et al. (tmb03 (2003)) SSP models), although significant scatter was present around the 12-Gyr isochrone. The H line index measurements were suggestive of somewhat younger ages for both GCs and the integrated galaxy light. Curiously, three clusters in common between the Paper I and Paper II samples all shifted towards older ages in the Paper II data. We return to this issue below (§4.8).
In this paper we present new -band imaging of GCs in NGC 4365, obtained with the SOFI imager on the ESO New Technology Telescope (NTT). We combine the new -band data with and imaging from the FORS1 instrument on the ESO Very Large Telescope for a new analysis of the , two-colour diagram, independent of the work by Puzia et al. (puz02 (2002)). While less deep than the ISAAC imaging, the combined SOFIFORS1 data cover a larger field of view, allowing us to better constrain whether an intermediate-age population (if present) is restricted to the central parts of the galaxy. Furthermore, the SOFI data are deep enough to comfortably include all clusters for which spectroscopy was obtained in Paper I and II so that a comparison of photometric and spectroscopic age indicators, as well as other properties, can be carried out. In order to keep our analysis as model-independent as possible, we compare the NGC 4365 data with previously published spectroscopy and photometry for NGC 3115 (P02; Kuntschner et al. kunt02 (2002)) and the Sombrero galaxy (Larsen et al. lar02 (2002)). We also include F850LP () and F475W () band photometry from the ACS Virgo Cluster Survey (Côté et al. cot04 (2004)), and compare the F850LP, F475W, F555W and F814W HST data for GCs in NGC 4365 with similar data for three other large Virgo ellipticals, NGC~4406, NGC~4649 and NGC~4486, which have about the same luminosity.
2 Observations and data reduction
A realistic assessment of the limitations of the photometry will be important for the discussion later on. In the following we therefore discuss our observational strategy and data reduction in some detail.
2.1 SOFI -band imaging: data
| Date | N(exp) | Seeing | Airmass | ||
|---|---|---|---|---|---|
| Mean | Min | Max | |||
| 2004-04-04 | 40 | 1.247 | 1.244 | 1.253 | |
| 2004-04-05 | 146 | 1.406 | 1.244 | 1.936 | |
| 2004-04-09 | 6 | 1.611 | 1.592 | 1.631 | |
| 2004-04-29 | 38 | 1.390 | 1.320 | 1.479 | |
| 2004-04-30 | 35 | 1.318 | 1.278 | 1.370 | |
Imaging in the -band was obtained in service mode with the SOFI (Son of ISAAC) imager on the ESO 3.5 m NTT at La Silla, Chile, during 5 non-consecutive nights in April 2004. We used the large field configuration, providing an image scale of pixel-1 and a field size of . We made 265 exposures, each consisting of 10 co-adds for an integration time of 6 = 60 s per exposure and a total of 15900 s (4h25m). A summary of the SOFI observations is given in Table 1, which lists for each night the number of exposures, the median seeing (measured on the science images) and the airmass range.
Our strategy for sky subtraction deserves a few explanatory notes: for uncrowded fields, sky subtraction in the near-IR is usually done by constructing a combined sky frame from several dithered exposures, using some rejection algorithm (e.g. median combination) to eliminate stars and other compact sources. If the target fills a significant fraction of the field, dithering becomes impractical and separate sky frames must be obtained by nodding the telescope to an empty sky region. In our case, the GCs are unresolved at ground-based resolution and the field is sufficiently uncrowded that a dithering approach would work well apart from the presence of NGC 4365. Although NGC 4365 does fill a significant fraction of the field of view, the profile is smooth and over most of the field the surface brightness of the sky dominates completely over the contribution from the galaxy. Thus, we opted not to obtain separate sky exposures and instead maximize the time spent on-target, dithering the observations by applying a random offset within a box before each new exposure. The penalty paid for this approach is that we cannot perform proper sky subtraction near the very centre of the field where the contribution from NGC 4365 becomes significant, but we considered this less of a problem since that region was already covered by the -band imaging of P02.
The standard SOFI calibration plan provides two standard stars per night, but to ensure the best possible photometric calibration we requested that 4 standard stars be observed on one photometric night together with some of the science exposures. These four stars (S860-D, S791-C, S273-E and S870-T in the list of Persson et al. per98 (1998)) were observed on 2004-04-30.
2.2 SOFI -band imaging: initial reductions and calibration
First, the shifts between exposures were determined by measuring the centroids of 3 bright, isolated stars in each image using the IMEXAMINE task in IRAF111IRAF is distributed by the National Optical Astronomical Observatories, which are operated by the Association of Universities for Research in Astronomy, Inc. under contract with the National Science Foundation. We then constructed a model of the galaxy by flat-fielding the images with dome-flats, shifting and co-adding all the individual images, and fitting an elliptical model of the galaxy light with the ELLIPSE and BMODEL tasks in the STSDAS package in IRAF. Even after flat-fielding with dome flats, non-uniformity of the background dominated over the galaxy light profile at radii greater than from the centre, so we did not attempt to model the galaxy light at larger radii. The elliptical model was then shifted and subtracted from each of the raw frames.
Next, each exposure (now with the central cusp of galaxy light removed, to the extent possible) was reduced following the standard procedure: A “running mean” of the 4 exposures obtained closest in time (2 before and 2 after) was constructed for each frame by scaling each exposure to the same median value, rejecting any outliers (e.g. stars), and then forming the mean. For each exposure the corresponding running mean was then subtracted, and finally a flat-field correction was performed (using a dome-flat).
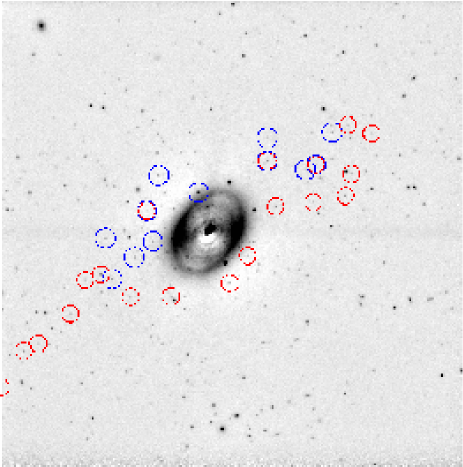
The 265 exposures were then shifted and average combined. Fig. 1 shows the combined image. The residuals of the galaxy core are still clearly visible within the central arcsec radius, but over most of the field there are no remaining traces of the galaxy. The circles mark objects with spectroscopy from Paper I and Paper II.
A photometric calibration was established using the four standard stars observed on 2004-04-30. We used the PHOT task in the DAOPHOT package (Stetson stet87 (1987)) in IRAF to perform aperture photometry within a radius of 8 pixels, measuring the sky background in an annulus with inner and outer radii of 20 and 30 pixels. We assumed a transformation of the following form
| (1) |
where and are the standard and instrumental magnitudes and and are the extinction coefficient and airmass. For the default PHOT zero-point of zmag=25 and assuming mag (unit airmass)-1, we found with an r.m.s. scatter of only 0.016 mag. We did not attempt to perform an illumination correction, but each standard star was observed at 5 positions across the detector and repeating the zero-point determinations for each position separately we found all measurements to agree within 0.03 mag. As a check we also derived for the other nights and found the zero-points for all nights to agree within 0.03 mag. We thus consider the -band photometric zero-points to be accurate within mag across the SOFI field.
Photometry on the co-added science frame was done with a smaller () aperture (see below). The zero-point offset between the photometry of the combined frame and the pixels standard calibration of 2004-04-30 was determined in two steps: First an aperture correction from to pixels was derived for the combined frame using a standard curve-of-growth analysis as implemented in the MKAPFILE task in DAOPHOT. Applying MKAPFILE to 13 bright, isolated objects distributed across the SOFI field we found this correction to be mag. As a check, we also calculated the mean difference between photometry in and pixel apertures directly and got mag. Next, the zero-point difference between the combined frame and the night of 2004-04-30 was estimated by combining all exposures from 2004-04-30 and comparing photometry in an aperture with the combined frame. This difference was found to be mag. This is somewhat larger than the scatter in the zero-points determined from the standard star observations, but may be attributed to the fact that the science data were obtained over a range of airmasses and transparency variations may have occurred (we only required photometric conditions for the night when standard stars were observed). We thus added an offset of mag to the zero-point in Eq. (1).

In the top panel of Fig. 2 we compare our -band magnitudes for a set of isolated, bright objects in the NGC 4365 field with the ISAAC data of P02. The SOFI magnitudes are on average mag brighter than those of P02, with a hint of a systematic trend with magnitude in the sense that the absolute difference becomes smaller with fainter magnitudes. As an independent check, we also downloaded a subset of the ISAAC data from the ESO-VLT archive and re-reduced them ourselves. The only purpose of this exercise was to compare the photometric calibrations for bright objects in the ISAAC and SOFI frames, so we used a large aperture radius or pixels () for both the GC and standard star observations and thereby eliminated the step of determining aperture corrections for the ISAAC data. The middle panel in Fig. 2 shows the comparison between our ISAAC reduction and the SOFI data. While the trend with magnitude persists, the mean offset with respect to the SOFI data is reduced to mag in our re-reduction of the ISAAC data. Finally, the bottom panel shows the comparison between the P02 data and our ISAAC reduction. In this case there is no systematic trend, and the mean offset ( mag) between the two reductions is consistent with the differences in the mean offsets with respect to the SOFI data.
The comparison between the various -band measurements illustrates the difficulty of accurately calibrating near-IR data due to issues such as uncertain photometric zero-points, aperture corrections, and the bright sky background. Even for the brightest GCs in the field, the count rate from the object is generally less than 1% of the sky background. Variations in the background itself of a similar magnitude occur over timescales of a few minutes, so accurate background subtraction is a critical issue which might be compromised e.g. by non-linearities in the detector. We have argued that our photometric zero-points are likely accurate to better than 0.03 mag, with an additional 0.03 mag uncertainty on the aperture corrections. These could be underestimates, however. P02 argue that their photometric calibration is accurate to mag, but given the mag offset in the bottom panel of Fig. 2 it seems likely that this might also be somewhat underestimated. We believe that these differences simply reflect the inherent difficulty of accurately calibrating near-infrared photometry, due in large part to the less well-behaved infrared detectors (compared to CCDs). Like our SOFI data, the ISAAC data were also obtained over several nights, and it is not a priori clear to us that the calibration of one dataset should be considered more reliable than the other. Rather, we infer from this comparison that the true calibration uncertainty on either dataset is probably on the order of 0.1 mag.
It is hard to tell whether the trend with magnitude seen in the two top panels of Fig. 2 is caused by the ISAAC or the SOFI data. The overall sense of the offset between the two datasets makes it most likely that the SOFI magnitudes are slightly too bright, which would tend to make the colours systematically too red. The implications are discussed in more detail below (§4).
2.3 FORS1 and -band imaging
| Date | Texp | Seeing | Airmass | |
|---|---|---|---|---|
| -band | 2003-01-01 | s | 1.50 | |
| -band | 2002-12-30 | s | 1.35 |
The SOFI data were combined with and imaging from the FORS1 instrument on the ESO VLT (Table 2). These data were originally obtained as pre-imaging for a (never completed) spectroscopic study (70.B-0289, P.I. Kuntschner) and are not very deep (3140 s and 3 s in and ) but are well matched to our data. The FORS1 image scale was pixel-1 and the field of view , completely including the SOFI field.
Initial processing of the CCD images (bias subtraction, flat-fielding) was done using standard IRAF tools and the flat-fields (sky flats) and bias exposures provided by the ESO archive. For the photometric calibration we used observations of two standard fields (PG0231 and Rubin 152 from Landolt lan92 (1992)), observed on 2002-12-29, 2003-01-01 and 2003-01-06. As the standard star exposures were strongly defocused (in order to avoid saturation), we used a large ( pixels) aperture for the standard star photometry. The transformations from FORS1 instrumental to standard Johnson-Cousins and magnitudes were assumed to be of the form (using the same notation as in Eq. 1):
| (2) |
and
| (3) |
where and . We found zero-points of mag and mag and colour terms and , assuming and and the default PHOT zero-point of zmag=25. We found it necessary to eliminate the bluest star in the PG0231 field (), or otherwise a simple linear colour term did not give a good fit. The remaining stars had colours between and 1.951, adequately bracketing the typical colours of GCs. Aperture corrections from the to pixels apertures used for photometry on the science frames were again determined with the MKAPFILE task, and were found to be mag and mag. Our formal errors on the photometric calibration are thus smaller than 0.02 mag in both and . Note the smaller aperture correction in , due to the better seeing.
2.4 Photometry of the NGC 4365 GC system

The FORS1 and images were registered to a common reference system and the galaxy light profile was modelled and subtracted using the ELLIPSE and BMODEL tasks in STSDAS. Objects were then detected in the band image using the DAOFIND task in DAOPHOT, adopting a 4 threshold above the background noise estimated in the outer parts of the image. Closer to the centre where the background noise is higher, this led to a large number of false detections and the initial object list was cleaned by only including objects which represented a 5 or better detection above the local background noise, measured in a small annulus around each object.
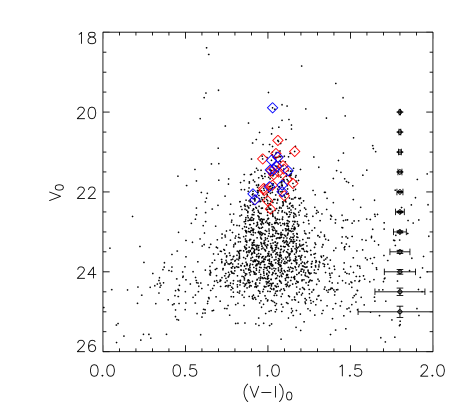
Photometry was then obtained for each source using the PHOT task with an aperture radius of 4 pixels and calibrated as described above. Fig. 3 shows the resulting vs. colour-magnitude diagram, corrected for Galactic foreground extinction (Table 4). The GC population is the dominant feature in the plot, with colours between and and extends over the entire magnitude range between . In L2001 we found the turn-over of the GC luminosity function to be at so here we are just barely reaching down to the turn-over. The GCs with spectroscopy from Papers I and II are marked with diamond symbols and sample the GC colour range quite well, though perhaps with some bias towards intermediate and red colours (where most candidate intermediate-age GCs would be expected).
| ID | X,Y (FORS1) | RA (2000.0) | Decl (2000.0) | FWHM | |||||||
|---|---|---|---|---|---|---|---|---|---|---|---|
| 131 | 1482.6 | 244.3 | 12:24:21.76 | 7:16:26.6 | 21.754 | 0.009 | 19.819 | 0.005 | 17.791 | 0.013 | 0.33 |
| 132 | 1767.5 | 243.8 | 12:24:17.93 | 7:16:26.3 | 24.277 | 0.067 | 23.295 | 0.087 | 1.58 | ||
| 133 | 1386.6 | 246.3 | 12:24:23.05 | 7:16:27.1 | 24.388 | 0.075 | 23.251 | 0.082 | 20.353 | 0.157 | 0.19 |
A coordinate transformation between the FORS1 and SOFI data was established by identifying 21 objects common to both datasets and measuring their coordinates with the IMEXAMINE task in IRAF. The transformation was then computed using the GEOMAP task in the IRAF IMMATCH package. The r.m.s. residuals around the transformation were about 0.2 pixels in both and . The FORS1 object list was transformed to the SOFI frames and photometry was obtained for each object using an aperture radius of 4 pixels. The central radius region of the SOFI image, where the background subtraction is poor, was masked out. The instrumental magnitudes were calibrated to standard magnitudes as described in §2.2. Table 3 lists a few rows from the combined photometry data file. The full version of the table is available electronically. The photometry in the table is not corrected for foreground reddening but for our subsequent analysis we use the Schlegel et al. (sch98 (1998)) value of mag and the reddening law in Cardelli et al. (car89 (1989)), i.e. , and . Note that Table 3 in Cardelli et al. gives the ratio for the Johnson filter centered at 900 nm, whereas our photometry is calibrated to the Kron-Cousins band which is centered at about 825 nm (Landolt lan83 (1983)). We have adopted the corresponding value for the ratio, using the general expressions for given in Cardelli et al.
Because the objects were detected in the FORS1 images the detection completeness is not formally dependent on the -band data. However, at a given magnitude the photometric errors are always dominated by the -band data (Fig. 4) and rise rapidly below (corresponding to for typical GC colours).
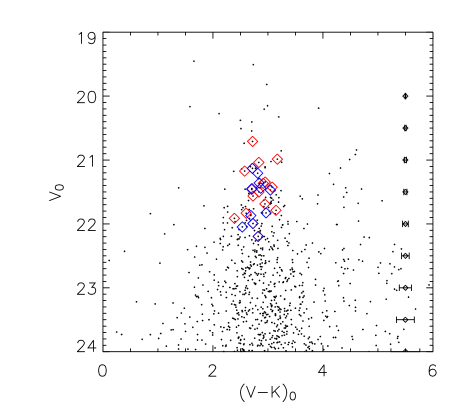
The vs. colour-magnitude diagram is shown in Fig. 5. As in Fig. 3, objects with spectroscopy are indicated with diamond symbols. A few of these fall within the central masked-out region or outside of the SOFI field and hence are not plotted. A total of 25 objects have both photometry and spectroscopy (11 from Paper I and 17 from Paper II, with three objects in common between the two papers) and again the colour range is well sampled by the combined spectroscopic samples.
2.5 HST WFPC2 imaging


In addition to the SOFI and FORS1 data, we use data taken with the Wide Field Camera 2 (WFPC2) and Advanced Camera for Surveys (ACS) on board the Hubble Space Telescope (HST). The homogeneity and stability of HST data allow us to carry out a robust comparison of GCs in NGC 4365 with three other large Virgo ellipticals with rich GC systems: NGC 4406 (M86), NGC 4486 (M87) and NGC 4649 (M60).
The WFPC2 data are the same data that were used in L2001 and we refer to that paper for details concerning the reductions. Briefly, the data sets consist of deep (1 orbit or 2400 s) CR-SPLIT exposures in each of the F555W () and F814W () bands. For NGC 4365 we used the two pointings from programmes 5920 and 6554 (P.I. Brodie). A very large number of pointings are available for NGC 4486 but we restricted our analysis to the two closest to the centre (from programmes 5477 and 6844, P.I. Macchetto) labelled NGC 4486 and NGC 4486-O1 in L2001. For each of NGC 4406 and NGC 4649 only one pointing was available.
Most of the exposures are accurately aligned at the sub-pixel level but, as noted in L2001 shifts are present between the exposures in the central NGC 4365 pointing. A re-analysis of this data showed that the resampling of the data prior to the co-addition demanded more relaxed cosmic-ray rejection parameters than those used in L2001 in order to avoid artifacts near the centre of bright sources.
We have also revised the aperture corrections for the WFPC2 data by directly measuring the difference between photometry in an pixels () aperture and our pixels apertures used for colours. We find some differences from one dataset to another, ranging between mag and mag. In L2001 we used a constant aperture correction for of 0.026 mag. For the apertures used for magnitudes we find mag to mag. The Holtzman et al. (hol95 (1995)) photometric calibration of WFPC2 includes an implicit mag correction from to infinity, although this may be an underestimate for extended sources such as GCs. In L2001 we added a mag correction to account for the fact that some fraction of the light from a typical GC will extend beyond the aperture, but this correction was actually derived for a smaller distance than that of the four galaxies studied here and is thus likely to be an overestimate (as noted in L2001). For our present purpose a small uncertainty on the WFPC2 magnitudes is unimportant, as we are mainly interested in the colour distributions. Thus, we do not include this additional zero-point correction here.
The different aperture corrections lead to shifts of a few times 0.01 mag in the colour distributions with respect to L2001, while the improved CR-rejection parameters for NGC 4365 cause a systematic shift of almost 0.05 mag in as well as a decreased scatter. This shift is clearly seen when comparing the new colour distribution (Fig. 8) with Figure 4 in L2001. We have verified that no residuals are present near the centres of bright objects in our new reduction of the NGC 4365 WFPC2 data and our WFPC2 colours for NGC 4365 agree with those of P02 (derived from the same data) within a mean difference of mag. Since we used similar apertures to those of P02 (r=2 pixels) for the colours, the source of the remaining difference is unclear, but may be related to the fact that we used DAOPHOT for the photometry whereas P02 used SExtractor. Somewhat more worrisome is a systematic difference of mag between our WFPC2 magnitudes and those of P02. In order to be less sensitive to uncertainties in the aperture corrections, we used an pixels aperture for our magnitudes, while P02 used the same aperture for the magnitudes as for colours. As a check, we derived aperture corrections between and pixels () for our photometry and compared with the aperture corrections given by P02. Our aperture corrections ( mag in F555W) are about mag larger than those in P02 ( mag), leaving an additional mag unaccounted for.
In Figs. 6 and 7 we compare our WFPC2 and photometry with the FORS1 data. There is excellent agreement between the FORS1 and WFPC2 colours, with a mean and median systematic difference of mag and mag, consistent with our estimated calibration uncertainties. The FORS1 and WFPC2 magnitudes also agree very well, with a mean and median difference of mag and mag, the FORS1 magnitudes being slightly brighter. This difference could be partly due to the extended nature of the GCs. Note, however, that the offset of our FORS1 photometry with respect to the P02 WFPC2 data is larger, about mag. Incidentally, this is similar to the difference between the two sets of -band measurements, making our colours similar to those of P02.
An additional WFPC2 F555W and F814W dataset is available for NGC 4365 (programme 5454). We have also downloaded and reduced this dataset, and find excellent agreement (within the errors) with the deeper data used here. Specifically, the mean colour and magnitude differences are mag and mag.
2.6 HST ACS imaging
The ACS data were all obtained as part of the ACS Virgo Cluster Survey (Côté et al. cot04 (2004)) and use the F850LP (Sloan ) and F475W (Sloan ) filters. The wider separation in central wavelength of these filters compared to allows better resolution of features in the GC colour distributions. The exposure times in F850LP and F475W were 1210 and 750 seconds, split into 3 and 2 exposures for cosmic-ray rejection. The data were obtained with the wide field channel on ACS, which has a pixel scale of pixel-1 and a field of view of .
ACS images of NGC 4365, NGC 4406, NGC 4486 and NGC 4649 were downloaded from the archive at the Space Telescope European Coordinating Facility (ST-ECF). The pipeline processed images were combined with the MULTIDRIZZLE task (Koekemoer et al. koek02 (2002)) in the STSDAS.DITHER package which removes the significant geometric distortion in ACS images and normalises the images to count rate.
Objects were detected with SExtractor (Bertin & Arnouts ba96 (1996)) and photometry was obtained with PHOT, using an aperture radius of 5 pixels. Aperture corrections were derived by computing the mean difference between the pixels aperture and a reference aperture for objects with . We found mean aperture corrections of mag and mag to be adequate for all galaxies (within 0.02 mag). The photometry was calibrated to AB magnitudes using the zero-points on the December 16, 2004 version of the ACS Web Page222http://www.stsci.edu/hst/acs/analysis/zeropoints (ZAB(F475W)=26.068 mag, ZAB(F850LP)=24.862 mag). The ACS F850LP and F475W filters do not exactly match the Sloan and filters but for this paper we only use the ACS data to compare the colour distributions of GCs in the four galaxies in a relative sense. In order to avoid the regions near the centre of the galaxies, objects with a background level higher than 0.75 counts s-1 pixel-1 in F850LP were excluded from the analysis.
3 The GC system of NGC 4365 - peculiar colour distribution?
| Type | (ACS) | |||||||
|---|---|---|---|---|---|---|---|---|
| NGC 4365 | E3 | 0.95 | 1.222 | 31.55 | 0.091 | 10.50 | 476 | |
| NGC 4406 | S0/E3 | 0.90 | 1.167 | 31.17 | 0.128 | 9.80 | 267 | |
| NGC 4486 | E0-1 | 0.93 | 1.244 | 31.03 | 0.096 | 9.50 | 1124 | |
| NGC 4649 | E2 | 0.95 | 1.232 | 31.13 | 0.114 | 9.80 | 533 |


We begin our analysis by comparing the NGC 4365 GC system with those of NGC 4406, NGC 4486 and NGC 4649, chosen as representative comparison cases. A complete discussion of the general properties of GC systems in different galaxies is not intended here and we refer to previous work by many authors (Gebhardt & Kissler-Patig gk99 (1999); Kundu & Whitmore kw01 (2001); L2001). We concentrate on aspects relevant to the comparison with NGC 4365.
Some basic properties of the four galaxies are listed in Table 4. They are all members of the Virgo cluster and have comparable absolute luminosities although NGC 4365 is the fainter of the four if we adopt the distance moduli of Tonry et al. (ton01 (2001)). The last column, , lists the number of GC candidates brighter than and with F475F850LP detected in the ACS images. This does not include any completeness corrections and is by no means intended to give a complete estimate of the number of GCs in each galaxy, but merely serves to illustrate relative differences in the richness of the GC systems within the central few arcmin. Of particular interest here are the integrated colours of the four galaxies. The colours are taken from Tonry et al. (ton01 (2001)) and are measured within an aperture radius of (except for NGC 4486 where a radius of was used), while the colours are total asymptotic colours from RC3 (de Vaucouleurs et al. rc3 (1991)). NGC 4365, NGC 4486 and NGC 4649 have similar colours, while NGC 4406 is bluer in both and . According to the NASA/IPAC Extragalactic Database (NED) all galaxies except NGC 4406 are classified as ellipticals, while NGC 4406 is listed as S0/E3.
Fig. 8 shows the colour distributions of GC candidates with in the four galaxies. Contrary to our previous finding (L2001), the histogram for NGC 4365 does show a clearly bimodal structure in our re-reduced data with a narrow blue peak at and a broader peak at (read off by eye from the figure). NGC 4486 and NGC 4649 also show bimodal colour distributions with blue peaks at about the same colour as in NGC 4365 or perhaps slightly redder. The red peaks in these two galaxies are significantly redder than in NGC 4365. In NGC 4406 the evidence for bimodality is weaker although there is still a hint of a blue peak at about the same colour as in the other galaxies.
The vertical dashed lines in Fig. 8 indicate the integrated galaxy colours from Table 4. The mean colour of the red GCs in NGC 4365 is shifted towards the blue with respect to the galaxy light, although the tail of the colour distribution includes some objects with colours as red as the galaxy. This is quite different from the situation in NGC 4486 and NGC 4649 where the red GCs have mean colours which are more similar to the galaxy light. Though the overall GC colour distribution in NGC 4406 appears bluer than in NGC 4486 and NGC 4649, this also seems consistent with the bluer colour of the galaxy itself.
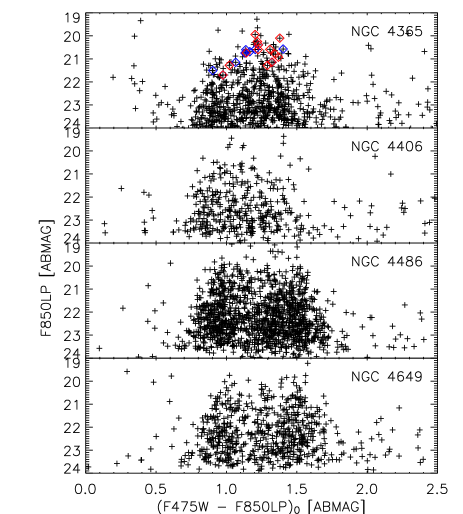
In Figs. 9 and 10 we show the ACS colour-magnitude diagrams and corresponding colour distributions for objects with m(F850LP)23.5. The colour distributions mimick those seen in Fig. 8 with clear bimodality in NGC 4365, NGC 4486 and NGC 4649. Again, the blue peaks are at about the same colour (perhaps slightly bluer in NGC 4365), and the red GCs in NGC 4365 appear more strongly weighted towards intermediate colours compared to NGC 4486 and NGC 4649. As in Fig. 8, distinct peaks are difficult to identify in NGC 4406, but there is a relative paucity of very red clusters compared to NGC 4486 and NGC 4649. Brodie et al. (bro05 (2005)) suggested that the colour distribution in NGC 4365 may actually be tri-modal; we cannot confirm that here but the red peak does appear quite broad and there are hints that the GCs with intermediate colours are concentrated closer towards the centre of NGC 4365 (§4.5). Based on the histograms, three peaks might also be present in NGC 4486 (as suggested by Lee & Geisler lg93 (1993)) and NGC 4649, and trimodality has even been claimed for NGC 4406 (Rhode & Zepf rz04 (2004)).
Another interesting feature to note from the colour-magnitude diagrams is that the brightest intermediate-colour and red GCs in NGC 4365 are mag brighter than the brightest blue clusters. The brightest red GCs have , while the brightest blue ones have . Since the number of clusters per colour bin is roughly similar for blue and intermediate colours, this cannot simply be a size-of-sample effect. In the other galaxies, the brightest blue and red GCs are comparable in magnitude and few if any clusters are brighter than . Considering the somewhat greater distance of NGC 4365, the brightest red GCs in this galaxy may be slightly over-luminous compared to those in NGC 4486, NGC 4649 and NGC 4406. This difference would be expected if a significant population of intermediate-age GCs were present in NGC 4365, due to the increase in mass-to-light ratio with age. Indeed, this effect has been used in several previous studies in attempts to identify candidate intermediate-age GC populations in suspected merger remnants (Whitmore et al. whit97 (1997); Brown et al. bro00 (2000)). Of course, an alternative possibility is that the mass distribution of the red GCs in NGC 4365 simply extends to higher masses.
At any rate, the nature of the brightest GCs in galaxies remains unclear. The brightest GC in the Milky Way, Cen, displays a range of peculiarities including a large flattening, a wide metallicity distribution and at least two distinct stellar populations (Piotto et al. pio04 (2005)). A similar wide metallicity distribution has been noted for G1, one of the brightest GCs in M31 (Meylan et al. mey01 (2001)). In the giant Virgo elliptical NGC~4636, Dirsch et al. (dir05 (2005)) found a larger proportion of intermediate-color GCs at the bright end of the luminosity distribution than at fainter magnitudes and Mieske et al. (mie02 (2002)) suggested a smooth transition from the brightest GCs in NGC 1399 to Ultra Compact Objects. In NGC 1399, Richtler et al. (tom05 (2005)) have noted 8 bright globular cluster-like objects with peculiar morphological properties. Thus, the very brightest objects in NGC 4365 (and other galaxies) might not be directly related to the normal, fainter GCs.
4 The case for an intermediate-age population?
4.1 SOFI/FORS1 photometry
We restrict the following analysis to objects brighter than , for which the random photometric errors in all bands are less than about 0.1 mag (Fig. 4). As a result, all of the GC candidates are brighter than and about 85% of the sample fall in the magnitude range (cf. Fig. 2) with a peak around .
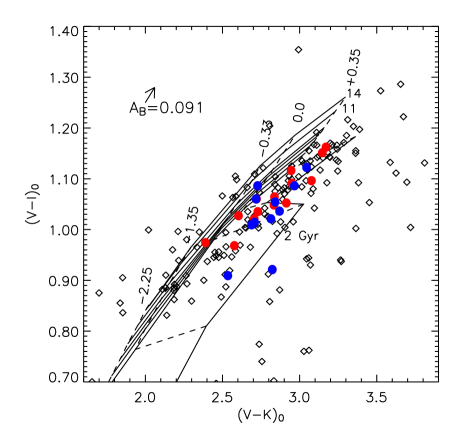
Fig. 11 shows the (, ) two-colour diagram for the combined SOFI/FORS1 data, corrected for foreground extinction (Schlegel et al. sch98 (1998)). Also shown are SSP models from Maraston (mar04 (2004)) for ages between 2 Gyrs and 14 Gyrs and metallicities . Like P02 we note that most of the data points fall to the right/below the model tracks for old ages, and some data points scatter towards the lower right-hand part of the plot. Objects with spectroscopy from Paper I and II are shown with filled circles. Many of the data points, including those representing clusters with spectroscopic data, fall along a well-defined, narrow sequence which is about parallel to, but offset from the model tracks for old ages and lies between the 2 Gyr and 3 Gyr models.
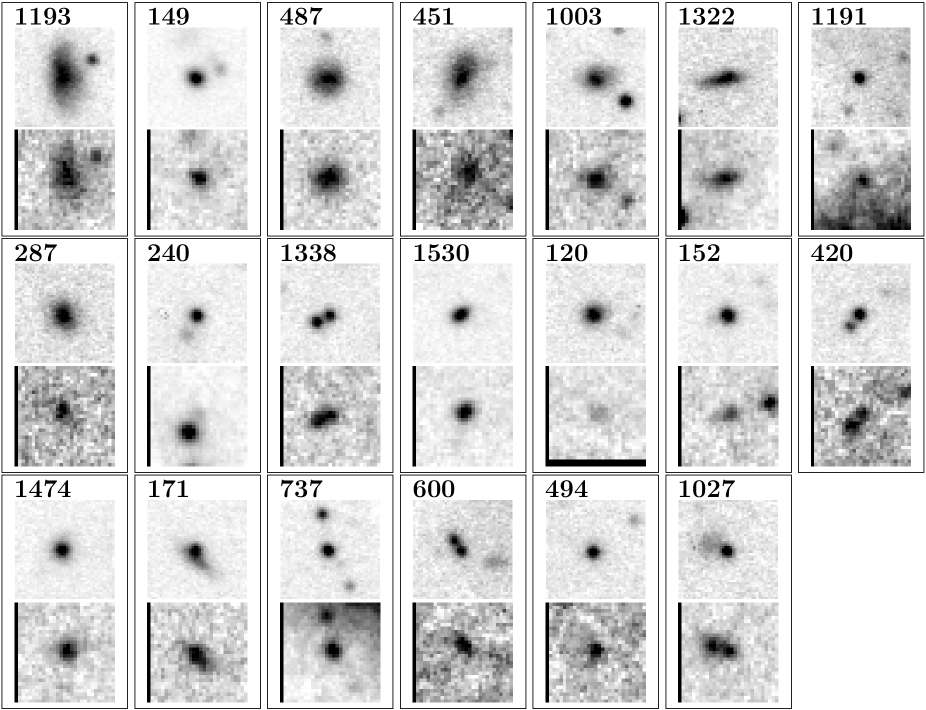
To investigate the nature of objects with very red colours, we drew a line at (shown as a dotted line in Fig. 12). The FORS1 -band and SOFI -band images of objects falling below this line are shown in Fig. 13 in order of decreasing distance from the line. At the distance of NGC 4365, one arcsec corresponds to a linear scale of about 100 pc, so most GCs are unresolved at ground-based resolution. Few if any of the objects in Fig. 13 are likely GC candidates - nearly all are clearly extended, have close companions, or in a few cases are located close to the centre of NGC 4365 (ID 1191 and 737).
A visual inspection inspection of the FORS1 images reveals that the field is indeed rich in background galaxies, and a further selection of GC candidates based on size was therefore deemed necessary. To this end we measured the sizes of each object in the FORS1 -band images using the ISHAPE code (Larsen lar99 (1999)), assuming King (king62 (1962)) profiles with concentration parameter . The input PSFs for ISHAPE were generated with DAOPHOT, using bright unresolved objects in the field. The ISHAPE size estimates are listed in the last column of Table 3.
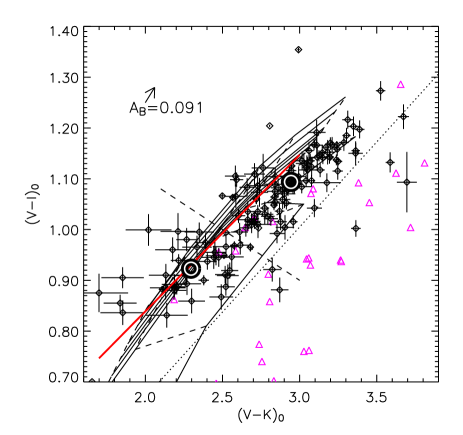
Fig. 12 shows the (, ) diagram after the size selection. We rejected objects with an intrinsic FWHM0.5 pixels or pc (i.e. corrected for the PSF), which corresponds to a half-light radius of about 15 pc for the assumed King profiles. Objects which passed the size criterion are shown with diamond symbols and error bars while the rejected objects are shown with triangles. The larger errors (especially in ) for the bluer clusters are due to the fact that these tend to be fainter overall (cf. Fig. 9 and §3), and in in particular (as a consequence of their blue colours). There is a strong preference for the rejected objects to fall below the dotted line, leading us to the conclusion (reinforced by Fig. 13) that most of the objects with very red colours for a given colour are likely background interlopers, as also noted by P02.
The circles in Fig. 12 show the mean colours of “blue” and “red” clusters, where the dividing line (shown as a dashed line) is at . Additional GC selection criteria are , bluer colours than the dotted line, and . The mean colours of the blue and red GCs are , and , . The errors do not include uncertainties on the photometric zero-points. We have not applied individual weights when computing the average colours. This would cause red objects (with better S/N in ) to be weighted systematically more strongly, resulting in a biased estimate of the mean.
Both the red and blue mean colours are shifted towards redder and/or bluer colours with respect to the oldest isochrones, but the offset is larger for the red clusters. There may be a small group of about 10 objects with intermediate colors around which are somewhat offset from the main group and do appear quite consistent with old ages. An inspection of the images does not reveal anything special about these objects other than that all except one are located within of the nucleus of NGC 4365.
4.2 Comparison with NGC 3115
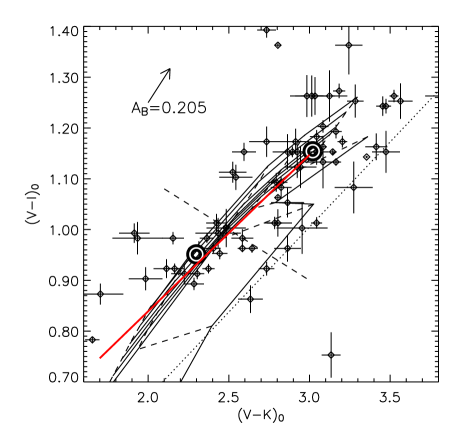

The GC system of NGC 3115 was studied spectroscopically by Kuntschner et al. (kunt02 (2002)) who found the two GC populations there to be old and coeval within 2–3 Gyr uncertainties. Fig. 14 shows the (, ) plot for GCs in NGC 3115, using data from P02. A correction for foreground extinction of mag (Schlegel et al. sch98 (1998)) has been applied and we have used the same size cuts as P02, i.e. objects with FWHM measured on the HST images were rejected. As in Fig. 12 we show the mean colours of blue and red clusters with circles, using the same dividing line and selection criteria. For NGC 3115 these mean colours are , and , . Although the formal errors on these mean values are relatively small, there is a large scatter, both real and due to random errors, and the representation of the red GCs as a single population may be an oversimplification, especially in NGC 4365 (see below).
Comparing Figs. 12 and 14, the overall difference between the two-colour diagrams for NGC 3115 and NGC 4365 does not appear as striking as in the study by P02 (their Fig. 6). The main difference is that the region corresponding to the most metal-rich (), old (age5 Gyrs) model tracks is not populated at all in NGC 4365, while NGC 3115 has some clusters in this part of the two-colour diagram. However, many of these have large error bars and there are also objects which scatter to quite young (according to the models) ages. The mean colours of the blue GCs in NGC 3115 coincide nicely with the SSP models for old ages, but the red GCs show an offset (though smaller than in NGC 4365) with respect to the models also in this galaxy. Generally, one gets the impression that the NGC 3115 two-colour diagram has more scatter, which makes it difficult to compare the two plots directly. This is in spite of the combination of HST imaging and ISAAC on the VLT for NGC 3115, compared to our FORS1/SOFI data (the exposure times in are nearly identical).
The offset between GC colours and models for old ages is larger in NGC 4365 than in NGC 3115, but this appears to be due to a systematic shift affecting both the blue and red GCs. Interpolating in the 13-Gyr isochrones, the offsets in between models and the average GC colours (for fixed colour) are mag and mag for NGC 4365. For NGC 3115 we find mag and mag. The difference is about 0.2 mag in both galaxies, specifically mag in NGC 4365 and mag in NGC 3115. A shift of about 0.1 mag towards bluer colours would make both the red and blue GCs in NGC 4365 show essentially the same average offset with respect to the 13-Gyr models as those in NGC 3115. Such a shift can be easily accommodated when uncertainties on the photometric zero-points and the overall scatter are taken into account. In particular, we remind the reader that our SOFI magnitudes are systematically brighter than those based on the ISAAC data of P02 (§2.2), and an attempt to bring the SOFI magnitudes in closer agreement with the ISAAC data could shift the colours towards the blue by a sufficient amount to make the red GC populations appear virtually coeval in the two galaxies. For NGC 3115, the larger scatter means that the average colours depend more strongly on the exact selection criteria than in NGC 4365. In particular, there are more GC candidates falling below the dotted line and having , and many objects in the P02 catalog have colours outside the plotted range. If the selection criteria are modified such that no colour cuts are applied, the difference is mag for NGC 3115. For NGC 4365, we get mag if the colour cuts are omitted.
It is sometimes overlooked that the foreground extinction corrections are also uncertain - we have used the Schlegel et al. (sch98 (1998)) value of mag for NGC 3115, but the Burstein & Heiles (bh82 (1982)) value is only mag (both from NED). For NGC 4365 the corresponding values are mag and 0 mag. Adopting different foreground extinctions could shift the mean colours around by a few times 0.01 mag, although the direction of the reddening vector means that the offsets with respect to the SSP models will be much less affected.
4.3 Comparison with Puzia et al.
In Fig. 15 we compare the P02 ISAAC/HST and our SOFI/FORS1 data for NGC 4365 directly. The datapoints for the smaller field in Fig. 15 appear somewhat more concentrated towards intermediate colours compared to the full sample in Fig. 12. This makes the well-defined narrow GC sequence in the full sample harder to recognise, although the objects in Fig. 15 do fall along the same locus. This difference suggests a deficiency of the most metal-rich and metal-poor objects in the central regions, as discussed further below (§4.5). The open squares and filled triangles in Fig. 15 show our photometry and that of P02 for objects in common between the two samples. No systematic differences are seen between the two sets of measurements, although the scatter may be slightly larger for the ISAAC/HST than for the SOFI/FORS1 data. Recall that this excellent agreement is a result of similar offsets of about 0.16 mag between our and magnitudes and those of P02 cancelling out when the colour is formed (§2.2 and §2.5). The scatter in around the best-fitting straight line is 0.06 mag and 0.05 mag for the two samples. The plus markers indicate all GC candidates in the P02 data, which show an even larger scatter (0.16 mag). This is most likely because these objects tend to be fainter and/or located closer to the centre of the galaxy, where the background is higher.
4.4 Intermediate ages? Calibration and Model Uncertainties
Before interpreting the above results in terms of age differences, uncertainties in the models need to be carefully considered. Comparing SSP models from a variety of sources, P02 and Hempel & Kissler-Patig (2004a ) found substantial differences, but none of the existing models are in agreement with the colors of GCs in NGC 4365 if the GCs are indeed old. Maraston (mar04 (2004)) compares her models with observations of Milky Way globular clusters and finds generally good agreement, but the comparison of colours at metallicities is limited by the small number of suitable objects and a shift of 0.1–0.2 mag in the colour at does not appear to be ruled out (her Fig. 21). A shift of about 0.2 mag in at the metal-rich end would make the (,) two-colour diagram consistent with old ages for virtually all GCs within the SOFI field.
Would a substantial shift towards redder colours make the SSP models incompatible with other existing data? Hempel & Kissler-Patig (2004a ) show (,) two-colour diagrams for GCs in 6 galaxies. These include NGC 4365 and NGC 3115 (same data as P02), ISAAC/HST observations of NGC 5846 and NGC 7192, and Keck/NIRC and WFPC2 data for NGC 4478 and M87. The M87 and NGC 4478 data include only relatively few objects because of the small () NIRC field of view and relatively short exposure times of about 10 min for each of two fields on M87 and 55 min for each of three fields on NGC 4478 (Kissler-Patig et al. kbm02 (2002)). The largest number of clusters were detected in NGC 5846, which shows a similar offset with respect to the models as NGC 4365. The colour distributions in the remaining three galaxies appear similar to that of NGC 3115, all showing substantial scatter. The conclusion of Hempel & Kissler-Patig (2004a ) is that intermediate-age populations are present in both NGC 4365 and NGC 5846, while the data for the remaining galaxies are too sparse to put strong constraints on the age distributions. However, redder model colours would make the GCs in both NGC 4365 and NGC 5846 appear mostly old, and does not appear to be strongly incompatible with the data for the remaining galaxies.
Barmby et al. (bar00 (2000)) derived relations between various broad-band colours and spectroscopic metallicities of Milky Way globular clusters. They find and , which can be combined to a relation between and : . This relation is drawn as solid straight lines in Figs. 12 and 14. In both NGC 4365 and NGC 3115, the mean colours of the metal-poor clusters fall very close to this line. In NGC 3115 the agreement is also excellent for the metal-rich clusters, while a small offset remains in NGC 4365. However, the Barmby et al. colour-metallicity relations themselves are also affected by the lack of suitable calibrators at high metallicities.
4.5 Radial trends

In Fig. 16 we show the , and colours of GC candidates in NGC 4365 as a function of projected radial separation from the centre of the galaxy. Selection criteria are the same as in Figs. 10 and 12. For radii less than we are plotting data from P02. Note also that the data do not include the central due to the limit on surface brightness. The blue GC sequence is again clearly visible, especially in , and appears to become less dominant near the centre.
The integrated and colours of NGC 4365 itself, measured on the ACS and FORS1 images, are also shown (solid lines). These should only be taken as approximate, since the limited field sizes do not allow us to measure the true sky background. We have used the largest possible aperture radii for the background measurements ( and for ACS and FORS1) and the photometric transformations from §2.3. Within 30 we get mag, in virtually perfect agreement with the value in Table 4. It is clear that the entire GC system remains bluer than the galaxy light at all radii where we can measure it.
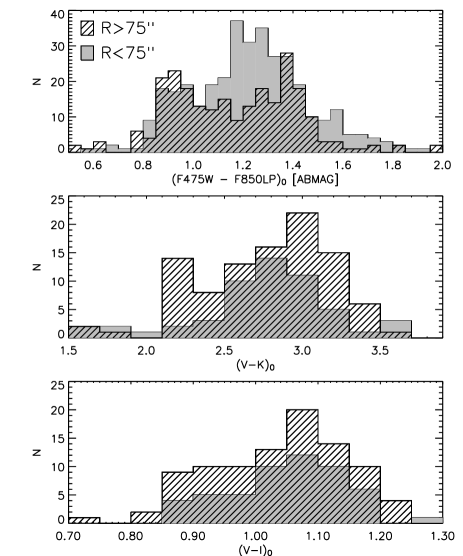
In Paper II and in the discussion of Fig. 15 we noted a hint of a larger concentration of intermediate-colour objects within the central parts of the galaxy. This is not easily confirmed by looking at Fig. 16, but becomes clearer in Fig. 17 which shows the , and colour distributions for an “inner” and “outer” sample, divided at . The overall ratio of outer to inner clusters is greater for the ISAAC/SOFI data because of the greater area covered at large radii by these data. Apart from that, two main differences are seen between the inner and outer samples, most clearly in the colours: First, the blue peak is relatively weaker in the inner sample, as noted above. Second, the red peak is weighted towards redder colours in the outer sample. This is consistent with the claim in Paper II of three GC populations with mean colours at 0.90, 1.22 and 1.34, with the intermediate-colour population dominating at small radii and the red population dominating further out. The difference between the inner and outer samples is statistically most significant in colours, with a Kolmogorov-Smirnov test returning a less than probability that the two samples could have been drawn from the same parent distribution.
It is worth emphasizing that the offset in the (,) two-colour diagram between the GC colours and the models for old ages is not driven particularly by the intermediate-colour objects which are concentrated near the centre. Instead, nearly all clusters except the bluest ones show this offset.
4.6 Comparison of Spectroscopy and colours
| Name / ID | (x,y) FORS1 | Fe/H (PCA) | ||||||
|---|---|---|---|---|---|---|---|---|
| BRO05-2 / 328 | 1309.5, 513.1 | 21.901 | 0.010 | 20.844 | 0.010 | 19.237 | 0.042 | |
| BRO05-3 / 402 | 1337.1, 587.6 | 21.632 | 0.009 | 20.567 | 0.009 | 18.843 | 0.033 | |
| BRO05-4 / 389 | 1181.6, 576.1 | 21.855 | 0.010 | 20.674 | 0.010 | 18.648 | 0.027 | |
| BRO05-5 / 408 | 1111.7, 595.3 | 21.493 | 0.008 | 20.367 | 0.008 | 18.356 | 0.021 | |
| BRO05-6 / 494 | 1209.9, 688.0 | 22.263 | 0.015 | 21.312 | 0.018 | 19.380 | 0.056 | |
| BRO05-7 / 505 | 1091.6, 697.5 | 21.981 | 0.012 | 20.977 | 0.014 | 19.531 | 0.063 | |
| BRO05-8 / 677 | 1222.7, 843.2 | 21.199 | 0.007 | 20.109 | 0.007 | 18.421 | 0.024 | |
| BRO05-9 / 645 | 1079.1, 816.8 | 21.106 | 0.007 | 20.028 | 0.007 | 18.212 | 0.022 | |
| BRO05-11 / 766 | 922.1, 906.1 | 22.164 | 0.030 | 21.035 | 0.027 | 0.000 | 0.000 | |
| BRO05-12 / 858 | 835.9, 961.7 | 20.777 | 0.007 | 19.687 | 0.007 | 17.996 | 0.020 | |
| BRO05-13 / 1235 | 1064.4, 1225.5 | 22.062 | 0.014 | 20.946 | 0.015 | 19.274 | 0.066 | |
| BRO05-14 / 1129 | 793.6, 1148.2 | 21.434 | 0.009 | 20.352 | 0.009 | 18.460 | 0.031 | |
| BRO05-15 / 1301 | 792.9, 1276.5 | 21.756 | 0.010 | 20.610 | 0.010 | 18.751 | 0.032 | |
| BRO05-16 / 1402 | 863.6, 1370.6 | 21.055 | 0.006 | 19.863 | 0.005 | 17.824 | 0.014 | |
| BRO05-17 / 1452 | 845.1, 1420.4 | 21.529 | 0.008 | 20.478 | 0.009 | 18.763 | 0.030 | |
| BRO05-18 / 1493 | 738.7, 1467.9 | 21.412 | 0.007 | 20.291 | 0.007 | 18.402 | 0.021 | |
| BRO05-19 / 1564 | 644.3, 1569.4 | 21.568 | 0.008 | 20.474 | 0.008 | 18.671 | 0.026 | |
| BRO05-20 / 1609 | 621.3, 1614.3 | 21.241 | 0.006 | 20.243 | 0.006 | 18.604 | 0.026 | |
| BRO05-21 / 1672 | 506.8, 1688.7 | 22.495 | 0.016 | 21.450 | 0.019 | 0.000 | 0.000 | |
| BRO05-22 / 1749 | 631.1, 1794.5 | 22.291 | 0.013 | 21.263 | 0.015 | 0.000 | 0.000 | |
| BRO05-23 / 1840 | 603.6, 1921.7 | 22.028 | 0.010 | 21.021 | 0.012 | 0.000 | 0.000 | |
| LAR03-1 / 448 | 1313.1, 637.5 | 21.896 | 0.011 | 20.780 | 0.010 | 18.870 | 0.032 | |
| LAR03-2 / 494 | 1210.0, 688.2 | 22.263 | 0.015 | 21.312 | 0.018 | 19.380 | 0.056 | |
| LAR03-3 / 536 | 1194.9, 721.9 | 22.116 | 0.014 | 21.177 | 0.017 | 19.521 | 0.069 | |
| LAR03-4 / 678 | 1296.3, 843.0 | 21.937 | 0.011 | 20.898 | 0.012 | 19.188 | 0.046 | |
| LAR03-5 / 677 | 1222.8, 843.3 | 21.199 | 0.007 | 20.109 | 0.007 | 18.421 | 0.024 | |
| LAR03-8 / 1010 | 1123.4, 1061.3 | 19.960 | 0.007 | 18.902 | 0.007 | 0.000 | 0.000 | |
| LAR03-9 / 1182 | 1177.2, 1187.4 | 21.428 | 0.008 | 20.344 | 0.008 | 18.527 | 0.029 | |
| LAR03-11 / 1235 | 1064.8, 1225.1 | 22.062 | 0.014 | 20.946 | 0.015 | 19.274 | 0.066 | |
| LAR03-12 / 1211 | 968.2, 1205.0 | 21.275 | 0.009 | 20.224 | 0.010 | 18.401 | 0.045 | |
| LAR03-13 / 1290 | 917.2, 1263.8 | 21.509 | 0.010 | 20.443 | 0.011 | 18.579 | 0.029 | |
| LAR03-14 / 1383 | 977.8, 1355.4 | 21.538 | 0.008 | 20.386 | 0.008 | 18.433 | 0.027 | |
| LAR03-15 / 1358 | 848.8, 1334.4 | 21.516 | 0.009 | 20.472 | 0.009 | 18.748 | 0.033 |
In the following we compare spectroscopic metallicities and broad-band colours for GCs in NGC 4365 and two other galaxies, NGC 3115 and the Sombrero galaxy (NGC~4594). For NGC 4365 we use the Paper I and II spectra, for NGC 3115 we use the Lick index measurements on VLT/FORS2 spectra published by Kuntschner et al. (kunt02 (2002)) and for the Sombrero we use our Keck/LRIS data from Larsen et al. (lar02 (2002)). Both the Sombrero and NGC 3115 GC spectra were found by the previous studies to be consistent with uniformly old ages for both the metal-poor and metal-rich sub-populations. We first look at some general properties of the NGC 4365 data and compare these with SSP models and various empirical colour-metallicity relations. In §4.7 we carry out a differential comparison between the different GC systems.
Spectroscopic metallicities were derived using the principal components analysis (PCA) method described in Strader & Brodie (sb04 (2004), hereafter SB04). SB04 found that the strongest principal component for a set of Lick index measurements is strongly correlated with metallicity, and they established a metallicity calibration based on 39 Milky Way GCs with Lick/IDS index measurements from Schiavon et al. (rps04 (2004)) and metallicities from the McMaster catalogue (Harris har96 (1996)). According to the notes to the catalogue, these metallicities are mostly on the scale of Zinn & West (zw84 (1984)), so the PCA metallicities should also be roughly on this scale. Table 5 lists the clusters in NGC 4365 which have both photometric and spectroscopic data.
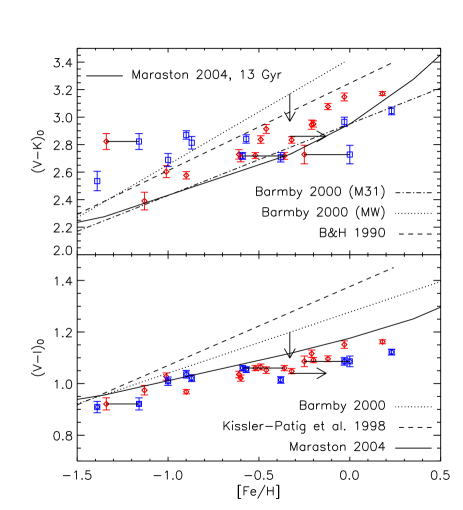
In Fig. 18 we plot the and colours versus the PCA metallicities for the NGC 4365 GCs. The 13-Gyr Maraston (mar04 (2004)) SSP models are drawn as solid curves. In the upper panel we also show the Barmby et al. (bar00 (2000)) and Brodie & Huchra (bh90 (1990)) calibrations for versus Fe/H, and in the bottom panel we show the Kissler-Patig et al. (kp98 (1998)) and Barmby et al. (bar00 (2000)) relations for vs. Fe/H. The Barmby et al. relations are based on photometry and spectroscopy of Milky Way GCs from Harris (har96 (1996)), so they should also be on the Zinn & West scale. The Kissler-Patig et al. relation is based on Keck spectroscopy of GCs in the giant Fornax elliptical NGC 1399, with spectroscopic metallicities derived from the Brodie & Huchra calibration which, in turn, is also on the Zinn & West scale. Thus, all the spectroscopic and photometric calibrations can be traced back to the Zinn & West scale and should produce comparable results (whether or not the Zinn & West scale actually measures true Fe abundance).
While the PCA metallicities and GC colours show a fairly tight correlation, the metallicities and the observed colours do not agree well with any of the empirical colour-metallicity relations in a quantitative sense. The Barmby et al. and Kissler-Patig et al. relations are too red compared to both the Maraston models and the NGC 4365 data except at the lowest end of the metallicity range. The 13-Gyr SSP models agree better with the GC colours, though the models remain slightly redder than the GCs or, equivalently, the PCA metallicities are too high. This small mag difference might be partly due to a combination of uncertainties on the photometric zero-points and the foreground reddening correction, but systematic effects in the PCA metallicities are also possible (e.g. due to resolution effects).
For the empirical relations are also redder than the metal-rich clusters, but here the Maraston models are actually bluer than the GCs. For the metal-poor clusters there is a larger scatter, though much of this is driven by one object LAR03-2=BRO05-6 with an anomalously red colour. Inspection of the images does not reveal any particular complications for this object (nearby neighbours, high background etc.) except that it is the faintest object in and and the second-faintest in (Table 5). Part of the difference between data and models could again be due to uncertainties on the photometric zero-points, in particular on the -band photometry. A shift of 0.1 mag towards bluer colours would bring the NGC 4365 data closer to the models, though still not in perfect agreement. However, errors on the metallicity calibration cannot simultaneously explain the offsets in and . Overall, the NGC 4365 GCs appear somewhat bluer in and redder in for their PCA metallicities compared to the Maraston models, consistent with the behaviour seen in the (,) two-colour diagrams.
The accurate calibration of colour-metallicity relations is severely hampered by the paucity of high-metallicity GCs in the Milky Way which at the same time have low reddenings. The relations in Barmby et al. (bar00 (2000)) are based on only a handful of Milky Way GCs with . Including M31 GCs with spectroscopic metallicities (based on the calibration in Brodie & Huchra bh90 (1990)) Barmby et al. find a shallower vs. Fe/H relation, indicated by the dotted-dashed line in Fig. 18. This relation is in fact too shallow to fit the NGC 4365 data but agrees rather well with the Maraston (2004) models. A corresponding relation for based on the M31 clusters is not given. The substantial differences between the various colour-metallicity relations mostly likely reflect the lack of suitable calibrators at high metallicities.
Because the spectroscopic metallicity calibrations can be traced back to the Zinn & West (zw84 (1984)) scale for Milky Way GCs, it is implicitly assumed that the ages of the objects to which these calibrations are applied are similar to those of GCs in the Milky Way. It is therefore worthwhile to ask how Fig. 18 will change if the NGC 4365 GCs are intermediate-age. For younger ages, metallicity sensitive spectral features will generally be weaker and a calibration scaled to Milky Way GCs will therefore tend to underestimate the metallicities for intermediate-age and young populations. Using the TMB03 models, we estimate that the change in Fe/H (vs. only Mg2 and Fe5270, for simplicity) is nearly linear in age over the range 3–12 Gyr and can be approximated as for a metallicity of (at 12 Gyr). Metallicities for a moderately metal-rich population based on these line indices will then be underestimated by about 0.2 dex if applied to a 5 Gyr population. The same models also predict that the and colours for an object with will change by mag and mag between 12 Gyr and 5 Gyr.
If the metal-rich GCs in NGC 4365 are 5 Gyr old then the metallicities are underestimated and the datapoints in Fig. 18 should be shifted towards the right by about 0.2 dex. The vs. Fe/H and vs. Fe/H relations should be shifted down by about 0.1 mag and 0.2 mag at the metal-rich end, respectively. These shifts are indicated by arrows in the figure. The net effect of younger ages is modest and in the case of actually works in the “wrong” direction, shifting the datapoints slightly further away from the SSP models. This remains true for all ages greater than 3 Gyr. For ages between 1 Gyr and 3 Gyr the current models turn redder in due to the TP-AGB phase transition (Maraston mar04 (2004)), but there are no reliable predictions for the corresponding behaviour of Lick indices. However, the predicted colour changes are very rapid and even if there exists an age where the combination of colours and line index strengths would fit Fig. 18 it would presumably require all GCs to be confined to a narrow age range. This seems unlikely, given the large metallicity spread, and consequently it appears difficult to explain the differences between observed and model colour-metallicity relations as a result of young ages.
4.7 Comparison with Spectra for GCs in Other Galaxies
Next, we compare colours of GCs in the Sombrero galaxy and NGC 3115 with the spectroscopic PCA metallicity estimates. For the Sombrero we use the HST photometry from Larsen et al. (lar02 (2002)). For NGC 3115, Kuntschner et al. (kunt02 (2002)) gave HST/WFPC2 photometry but only for a subset of the clusters in their spectroscopic sample. Here we use and data from the DFOSC instrument on the Danish 1.54 m telescope at ESO, La Silla, which were reduced and calibrated using similar techniques to those described for the FORS1 data in §2.3. The data were obtained in December 1999, and were exposed for about 2 hrs in each of the and bands. This provides and photometry for 17 GCs in NGC 3115 with spectroscopic S/N10.
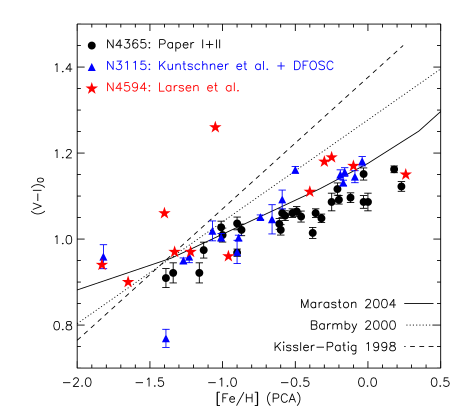
Fig. 19 shows the vs. Fe/H plot for the NGC 4365, NGC 3115 and Sombrero data. All metallicities were derived using the PCA technique. We note at most a small overall offset of a few times 0.01 mag between the NGC 4365 and NGC 3115 data, although there may be a slight systematic trend in the sense that this offset becomes larger at the metal-rich end (). The most metal-rich clusters in NGC 3115 tend to be about 0.05 mag redder on average than those in NGC 4365 or, equivalently, about 0.3 dex more metal-poor. These differences might be ascribed to uncertainties on the photometric calibrations and the foreground reddening correction, although the same trends are seen if we plot the smaller sample of clusters with HST/WFPC2 colours from Kuntschner et al. (not shown). Note, however, that the FORS1 colours for NGC 4365 are slightly redder than our WFPC2 photometry, again with a possible slight colour dependence (Fig. 6). If a shift of 0.02-0.03 mag is applied to the NGC 4365 data then essentially no significant offset is left with respect to NGC 3115. Alternatively, there might be small differences in the metallicity scales, e.g. due to the use of different instruments although attempts have been made to calibrate all measurements to the Lick/IDS system. The Sombrero clusters show more scatter, which may be partly due to reddening internally in the Sombrero. In particular, the outlying object at (Fe/H, ) () is located close to a dust lane.
While differences between the datasets in Fig. 18 are marginal, the data for all three GC systems are clearly offset with respect to the Barmby et al. and Kissler-Patig et al. colour-metallicity relations. In this context, it is interesting to note that Kuntschner et al. found their metallicity estimates for NGC 3115 based on MgFe index measurements to agree well with the colours (they compared with the Kundu & Whitmore kw98 (1998) calibration for vs. Fe/H, which is very similar to that of Barmby et al.). Likewise, in Larsen et al. (lar02 (2002)) we found the Sombrero GC metallicity estimates based on the Brodie & Huchra (bh90 (1990)) calibration to agree well with the HST/WFPC2 colours and the Kissler-Patig et al. (kp98 (1998)) relation. Indeed, a comparison of the PCA and Brodie & Huchra metallicity estimates for the Sombrero GCs (from Larsen et al. lar02 (2002)) shows that the PCA analysis yields systematically higher metallicities at the metal-rich end. We find that the relation can be approximated as . If the PCA metallicities are converted to the B&H scale, the agreement with the Barmby et al. colour-metallicity relation improves substantially with essentially no offset for NGC 3115 and the Sombrero, while the metal-rich NGC 4365 GCs remain slightly too blue. A similar transformation would also bring the NGC 4365 data in better agreement with the Barmby et al. vs. Fe/H relation in the upper panel of Fig. 18. Such a correction, however, would make all the clusters too red in both and compared to the Maraston SSP models.
Here we do not intend to imply a preference for one metallicity scale over the other, but simply wish to point out that the uncertainties in calibrating these relations are still substantial. In a strictly differential sense, the NGC 4365 GCs do not appear to behave very differently from their counterparts in NGC 3115 and the Sombrero. The possible small offsets towards bluer colours for NGC 4365 GCs are in the direction expected for younger ages, but might also be attributed to calibration differences in colour and/or metallicity between the various datasets. Indeed, Fig. 18 suggests that some systematic differences are present even between the two Keck/LRIS datasets for NGC 4365, particularly at high metallicities.
4.8 Spectroscopic ages revisited
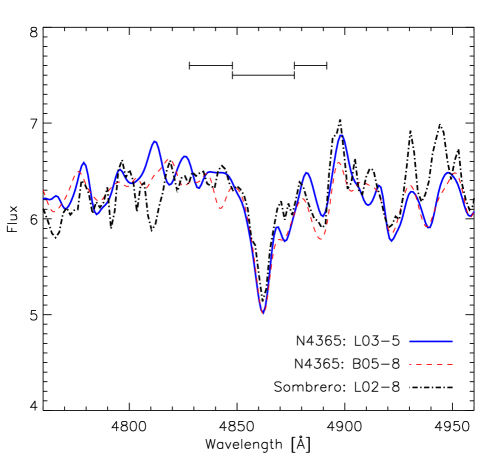
Different conclusions regarding the GC ages were reached based on the two Keck/LRIS datasets. The spectra presented in Paper I appeared to confirm the presence of intermediate-age clusters, while the Paper II dataset indicated old ages. These conclusions rest on the ability to measure Balmer line indices to an accuracy of a few times 0.1 Å. In Fig. 20 we show Keck/LRIS spectra from the two datasets for the same object, L03-5=B05-8, which showed a large decrease in H equivalent width from Paper I to Paper II. A spectrum for a GC of similar metallicity in the Sombrero galaxy is also included. The figure shows the region around the H feature for the three spectra smoothed to similar resolution. Also shown are the Lick/IDS H feature and pseudo-continuum bandpasses. For the cluster in NGC 4365 the Paper I and II data yield equivalent widths of EW(H)=2.7Å and 1.9Å, while for the Sombrero GC we measure EW(H)=1.6 Å. The uncertainty from photon noise alone is about 0.3Å in all cases.
The difference between the Paper I and Paper II H measurements corresponds to a large shift in the age from Gyr to Gyr for this particular object, but from Fig. 20 it is clear that the actual difference in the spectra is quite small and the stronger H EW in the Paper I data actually results from the continuum passbands being slightly less depressed rather than any noticeable change in the feature itself. While the changes in the line index measurements are uncomfortably large, this is one of the few cases where repeated measurements of the same GC have been compared. The objects in common between the Paper I and II samples were in fact chosen to be those having the strongest Balmer line EW measurements of the Paper I sample, and were thus believed to be the best cases for intermediate-age clusters. If instead these strong Balmer line EWs are simply due to measurement errors, we would also expect these objects to be the ones showing the largest shifts in a new independent set of measurements.
To further investigate the difference between the two datasets, M. Beasley kindly applied the fitting analysis by Proctor et al. (pfb04 (2004)) to the Paper I and II spectra. This method minimizes the difference between all Lick index measurements and Thomas et al. (tmk04 (2004)) SSP model predictions as a function of age and metallicity. While the method remains subject to possible systematic uncertainties in the models, it does provide an independent set of constraints on possible systematic problems with spectroscopic data. For the Paper I data the analysis fails to reach a stable solution, and yields ages between 1 Gyr and 15 Gyrs depending on which indices are included. For the Paper II data, on the other hand, the analysis yields consistently old ages (15 Gyrs; Paper II). This suggests that the problem may be with the Paper I spectra, although several re-reductions of the data have failed to produce any significant changes in the line index measurements. However, the Paper I spectra also show the largest offset with respect to the NGC 3115 data in Fig. 20.
5 Summary and Conclusions
The GC system of NGC 4365 originally gained attention because of its unusual colour distribution. By now it seems clear that the broad-band colour distribution of the GCs is indeed unlike those typically seen in other large ellipticals. While the colour distribution is not unimodal as thought initially, there is a dominant population of GCs with intermediate optical colours between the usual “blue” and “red” peaks. These intermediate-colour clusters may themselves encompass two sub-populations with slightly different mean colours and the bluer ones concentrated closer towards the centre of NGC 4365. The question is whether these features are due to a population of intermediate-age clusters, or clusters which are intermediate-metallicity but still old.
Our SOFI data confirm the finding by P02 that the distribution of the GCs in the (,) two-colour diagram is shifted towards redder colours and/or bluer colours compared to SSP model tracks for old ages. If the models are interpreted literally, this makes the majority of the intermediate-colour and red GCs within our SOFI field appear as young as 2–3 Gyrs. However, we argue that the offset is most likely due to a combination of calibration and model uncertainties, reducing or eliminating the need to invoke intermediate ages to explain the colour distribution.
As discussed in §4.2, the mean colours of metal-rich GCs in NGC 3115 also appear shifted with respect to the models for old ages, suggesting that the exact location of the model tracks in the (,) two-colour diagram is still rather uncertain. This is unsurprising, as there are few suitable calibrators to test the models empirically. If the models are shifted by about 0.2 mag towards redder colours at the metal-rich end the cluster colours in both NGC 3115 and NGC 4365 would be consistent with uniformly old ages. While the metal-rich GCs in NGC 4365 show a larger offset (by 0.1 mag in ) with respect to the models than those in NGC 3115, this is also true for the metal-poor clusters. Accounting also for calibration uncertainties in the -band photometry, we are reluctant to take the colours as evidence for an intermediate-age population in NGC 4365.
Our comparison of spectroscopic metallicities and broad-band colours (§4.6) reveals discrepancies between observed GC colours and models for old ages similar to those seen in the two-colour diagrams. At a given fixed metallicity, the observed colours for GCs in NGC 4365 are too red (by 0.2 mag) compared to the Maraston 13-Gyr SSP models, while the colours are slightly too blue (by mag). Especially the offset in colour is very unlikely to be due to an age difference.
Compared to the empirical colour-metallicity relations in Barmby et al. (bar00 (2000)), both the integrated and GC colours in NGC 4365 are too blue at the metal-rich end. However, the interpretation of these differences is unclear as both the spectroscopic and photometric metallicity calibrations are uncertain at high ( Solar) metallicities. Bluer colours compared to spectroscopic metallicity estimates might also be expected if the GCs are indeed younger, and we do see hints of a slight offset between the colour-metallicity relations in NGC 4365 and NGC 3115. We doubt the significance of this offset, however, as offsets are also seen between the two NGC 4365 datasets as well as between the data for GCs in NGC 3115 and the Sombrero GCs even though the latter two are both thought to be uniformly old.
We have compared spectroscopic metallicity estimates with photometry for GCs in NGC 4365, NGC 3115 and the Sombrero. The colour-metallicity relations for the GCs in all three galaxies agree better with the Maraston SSP models than with the empirical relations by Barmby et al. However, it is clear that large uncertainties remain in the calibration of the broad-band colour-metallicity relations at high metallicities.
Considering the uncertainties on the -band zero-points, the SOFI/FORS1 colours might be too red by up to mag. A correction for this would reduce the need for a shift in the models, but probably cannot account for the entire difference.
The exact origin of the difference between spectroscopic age estimates derived in Paper I and II remains unclear. While the Paper II data tend to have slightly better S/N due to the longer integration times and better seeing, the difference between the two datasets is clearly systematic and not just an effect of larger random errors in either one. We have performed several re-reductions of the Paper I data and have been unable to achieve line-index measurements consistent with those in Paper II. Applying the analysis of Proctor et al., we fail to find a stable solution for the Paper I spectra while the Paper II spectra are consistent with uniformly old ages. We note that not only H, but also the higher-order Balmer lines and other features tend to appear stronger in the Paper I spectra. Ideally, it would be desirable to obtain an additional independent set of high S/N spectra for GCs in NGC 4365. Currently, we conclude that the spectroscopic evidence for an intermediate-age population is questionable.
We briefly summarize the arguments for and against an intermediate-age GC population in NGC 4365:
Arguments for intermediate-age GCs:
-
•
(,) and (,) two-colour diagrams show offsets between SSP model tracks for old ages and data for NGC 4365, implying ages as young as 2-3 Gyrs if current models are interpreted literally.
-
•
Keck/LRIS spectra from Paper I showed Balmer line indices suggesting ages in the 2–5 Gyr range (by comparison with SSP models) for some clusters.
-
•
The red/intermediate-colour GCs extend to brighter magnitudes than the blue ones.
-
•
The (, ) two-colour diagram does show a small number of objects which have colours consistent with old ages and intermediate () metallicities.
Arguments against intermediate-age GCs:
-
•
Strong Balmer lines were not confirmed by Paper II spectra. The Proctor et al. (pfb04 (2004)) analysis, while yielding old ages for the Paper II spectra, fails to provide robust age determinations when applied to the Paper I data.
-
•
SOFI/FORS1 data presented here show that an intermediate-age population, if present, would have to constitute a major fraction of the NGC 4365 GC system. There are very few objects which have colours consistent with an old, metal-rich population. This is difficult to reconcile with the uniformly old age for the galaxy itself inferred from spectroscopy and lack of any other evidence for a major event (e.g. merger) within the last few Gyrs.
-
•
The differences between various empirical and model predictions for the GC broad-band colours (especially ) as a function of age and metallicity are at least comparable to the difference between the models for old ages and the NGC 4365 data.
-
•
A comparison of the offsets between SOFI/FORS1 mean colours of metal-rich and metal-poor GCs in NGC 4365 with respect to the SSP models shows little or no significant difference with respect to data for NGC 3115 whose GCs are believed to be uniformly old.
-
•
Offsets between observed and model colour-metallicity relations for the NGC 4365 GCs cannot easily be explained as an age effect but are again consistent with SSP model colours being too blue by mag for fixed age at high metallicities.
We suggest that most of the differences between our data for GCs in NGC 4365 and various theoretical and empirical colour-colour and colour-metallicity relations can be attributed to uncertainties in the model- and empirical relations, combined with general calibration uncertainties on the -band photometry. We hesitate to interpret the observed properties of the NGC 4365 GC system as due to intermediate- or young GC ages. Better calibrations of spectroscopic age and metallicity indicators (e.g. Lick system) and integrated colours (especially those involving near-IR bands) at near-solar metallicities, as well as comparison with high-quality data for GCs in larger samples of galaxies, will be required to reach more definitive answers. Systematic problems in spectroscopic data also need to be better understood.
While globular clusters may indeed be useful tracers of the evolutionary history of their host galaxies in many cases, NGC 4365 serves as a reminder that there may not always be a one-to-one correspondence between GC formation and the general stellar population in galaxies. There may be a range of field star metallicities in NGC 4365, likely covering about the same metallicity range as the GC system and sharing, to a large extent, a similar formation history. However, as in the case of NGC 5128, it appears that the specific frequency of globular clusters is a strong function of metallicity (although that is not necessarily the driving parameter). In particular, there can be only a small number of field stars associated with the intermediate-colour clusters (whether they are young or not), or otherwise the integrated colours of NGC 4365 itself should also have been shifted towards the blue.
Clearly, much more work needs to be done before we can claim to understand the relation between GC systems and their host galaxies. Future large space-based telescopes and 30–100 m ground-based telescopes equipped with adaptive optics should be able to resolve individual red giant branch stars in galaxies at the distance of Virgo and obtain high-dispersion, high S/N spectra of their GCs. Direct comparisons of field star metallicity distributions with those of GCs will almost certainly yield several surprises.
Acknowledgements.
We are grateful to Thomas Puzia for sending us his photometry for NGC 3115 and NGC 4365, to Harald Kuntschner for providing us with a table of his line-index measurements in machine-readable form, and to them both for helpful comments and discussions. We are also indebted to Mike Beasley for applying the Proctor et al. analysis to the Paper I spectra and to the La Silla staff for carrying out our SOFI observations in service mode. We thank Andrés Jordán and the anonymous referee for a number of useful suggestions which helped improve the paper. This research has made use of the NASA/IPAC Extragalactic Database (NED) which is operated by the Jet Propulsion Laboratory, California Institute of Technology, under contract with the National Aeronautics and Space Administration. JPB and JS acknowledge support from NSF grant AST-0206139.References
- (1) Ajhar, E. A., Blakeslee, J. P., & Tonry, J. L., 1994, AJ, 108, 2087
- (2) Barmby, P., Huchra, J. P., Brodie, J. P., et al., 2000, AJ, 119, 727
- (3) Bertin, E., & Arnouts, S., A&AS, 117, 393
- (4) Billett, O. H., Hunter, D. A., & Elmegreen, B. G. 2002, AJ, 123, 1454
- (5) Binggeli, B., Sandage, A., & Tammann, G. A., 1985, AJ, 90, 1681
- (6) Brodie, J. P., & Huchra, J. P., 1990, ApJ, 362, 503
- (7) Brodie, J. P. et al. 2005, AJ, in press (Paper II)
- (8) Brown, R. J. N., Forbes, D. A., Kissler-Patig, M., & Brodie, J. P., 2000, MNRAS, 317, 406
- (9) Burstein, D. & Heiles, C. 1982, AJ, 87, 1165
- (10) Cardelli, J. A., Clayton, G. C. and Mathis, J. S. 1989, ApJ, 345, 245
- (11) Carollo, C. M., Franx, M., Illingworth, G. D., & Forbes, D. A., 1997, ApJ, 481, 710
- (12) Clark, J. S., Negueruela, I., Crowther, P. A., & Goodwin, S. P., 2005, A&A, in press (astro-ph/0504342)
- (13) Côté, P., Blakeslee, J. P., Ferrarese, L., et al., 2004, ApJS 153, 223
- (14) Davies, R. L., Kuntschner, H., Emsellem, E., et al., 2001, ApJ, 548, L33
- (15) de Vaucouleurs, G., de Vaucouleurs, A., Corwin, H. G., et al., 1991, “Third Reference Catalog of Bright Galaxies”, Springer-Verlag New York
- (16) Dehnen, W., & Binney, J., 1998, MNRAS, 294, 429
- (17) Dirsch, B., Schuberth, Y., & Richtler, T., 2005, A&A, in press (astro-ph/0503283)
- (18) Forbes, D. A., 1996, AJ, 112, 954
- (19) Forte, J. C., Faifer, F., & Geisler, D., 2005, MNRAS, 357, 56
- (20) Forbes, D. A., Franx, M., Illingworth, G. D., & Carollo, C. M., 1996, ApJ, 467, 126
- (21) Gebhardt, K., & Kissler-Patig, M., 1999, AJ, 118, 1526
- (22) Gieles, M., Larsen, S. S., Bastian, N., & Stein, I. T., 2005, A&A, in prep.
- (23) Harris, W. E. 1996, AJ, 112, 1487
- (24) Harris, W. E., & Harris, G. L. H., 2002, AJ, 123, 3108
- (25) Harris, G. J. H., Harris, W. E., & Poole, G. B., 1999, AJ, 117, 855
- (26) Hempel, M., & Kissler-Patig, M., 2004a, A&A, 419, 863
- (27) Hempel, M., & Kissler-Patig, M., 2004b, A&A, 428, 459
- (28) Holtzman, J. A., Burrows, C. J., Casertano, S., et al., 1995, PASP, 107, 1065
- (29) Hunter, D. A., Elmegreen, B. G., Dupuy, T. J., & Mortonson, M., AJ, 126, 1836
- (30) King, I. R. 1962, AJ, 67, 471
- (31) Kissler-Patig, M., Brodie, J. P., Schroder, L. L., et al., 1998, AJ, 115, 105
- (32) Kissler-Patig, M., Brodie, J. P., & Minniti, D., 2002, A&A, 391, 441
- (33) Koekemoer, A. A., Fruchter, A. S., Hook, R. N., & Hack, W., 2002, in: “The 2002 HST Calibration Workshop: Hubble after the Installation of the ACS and the NICMOS Cooling System”, eds. S. Arribas, A. Koekemoer & B. Whitmore, Baltimore, MD: STScI, p. 339
- (34) Kundu, A. & Whitmore, B. C. 1998, AJ, 116, 2841
- (35) Kundu, A. & Whitmore, B. C. 2001, AJ, 121, 2950
- (36) Kuntschner, H., Ziegler, B. L., Sharples, R. M., Worthey, G., & Fricke, K. J., 2002, A&A, 395, 761
- (37) Landolt, A. U., 1983, AJ, 88, 439
- (38) Landolt, A. U., 1992, AJ, 104, 340
- (39) Larsen, S. S. 1999, A&AS, 139, 393
- (40) Larsen, S. S., Brodie, J. P., Huchra, J. P., et al., 2001, AJ, 121, 2974 (L2001)
- (41) Larsen, S. S., Brodie, J. P., Beasley, M. A., & Forbes, D. A., 2003, ApJ, 124, 8232
- (42) Larsen, S. S., Brodie, J. P., Beasley, M. A., et al., 2003, ApJ, 585, 767 (Paper I)
- (43) Larsen, S. S. 2002, AJ, 124, 1393
- (44) Larsen, S. S., 2005, in: Planets to Cosmology: Essential Science in Hubble’s Final Years, ed. M. Livio, STScI, May 2005 (astro-ph/0408201)
- (45) Lee, M. G., Geisler, D., 1993, AJ, 106, 493
- (46) Maraston, C., 2004, MNRAS, submitted (astro-ph/0410207)
- (47) Meylan, G., Sarajedini, A., Jablonka, P., et al., 2001, AJ, 122, 830
- (48) Mieske, S., Hilker, M., & Infante, L., 2002, A&A, 383, 823
- (49) Persson, S. E., Murphy, D. C., Krzeminski, W., Roth, M., & Rieke, M. J., 1998, ApJ, 116, 2475
- (50) Piotto, G., Villanova, S., Bedin, L. R., Gratton, R., et al., 2005, ApJ, 621, 777
- (51) Proctor, R. N., Forbes, D. A., & Beasley, M. A., 2004, MNRAS, 355, 1327
- (52) Puzia, T. H., Zepf, S. E., Kissler-Patig, M., et al., 2002, A&A, 391, 453 (P02)
- (53) Rhode, K. L., & Zepf, S. E., 2004, AJ, 127, 302
- (54) Richtler, T., Dirsch, B., Larsen, S. S., Hilker, M., & Infante, L., 2005, A&A, submitted
- (55) Schiavon, R. P., Rose, J. A., Courteau, S., & MacArthur, L., 2004, ApJ, 608, L33
- (56) Schlegel, D. J., Finkbeiner, D. P., and Davis, M. 1998, ApJ, 500, 525
- (57) Stetson, P. B., 1987, PASP, 99, 191
- (58) Strader, J., & Brodie, J. P., 2004, AJ, 128, 1671 (SB04)
- (59) Surma, P., & Bender, R., 1995, A&A, 298, 405
- (60) Thomas, D., Maraston, C., & Bender, R. 2003, MNRAS, 339, 897
- (61) Thomas, D., Maraston, C., & Korn, R. 2004, MNRAS, 351, L19
- (62) Tonry, J. L., Dressler, A., Blakeslee, J. P., et al., 2001, ApJ, 546, 681
- (63) Weidner, C., Kroupa, P., & Larsen, S. S., 2004, MNRAS, 350, 1503
- (64) Whitmore, B. C., Miller, B. W., Schweizer, F., & Fall, S. M., 1997, AJ, 114, 1797
- (65) Whitmore, B. C., 2003, in: STScI Symposium Series 14, editor: M. Livio (astro-ph/0012546)
- (66) Zinn, R. & West, M. J., 1984, ApJS, 55, 45
- (67) Zinn, R., 1985, ApJ, 293, 424