Near-IR photometry and spectroscopy of NGC 6539 and UKS 1: two intermediate metallicity Bulge Globular Clusters ††thanks: Photometric data have been taken at the ESO/NTT Telescope, within the observing programme 73.D-0313. Spectroscopic data were obtained at the W.M.Keck Observatory, which is operated as a scientific partnership among the California Institute of Technology, the University of California, and the National Aeronautics and Space Administration. The Observatory was made possible by the generous financial support of the W.M. Keck Foundation.
Abstract
Using the SOFI imager at ESO/NTT and the NIRSPEC spectrograph at Keck II, we have obtained J,K images and echelle spectra covering the range for the intermediate metallicity bulge globular clusters NGC 6539 and UKS 1. We find [Fe/H]=–0.76 and –0.78, respectively, and an average -enhancement of dex and dex, consistent with previous measurements of metal rich bulge clusters, and favoring the scenario of rapid chemical enrichment. We also measure very low isotopic ratios in both clusters, suggesting that extra-mixing mechanisms due to cool bottom processing are at work during evolution along the Red Giant Branch. Finally, we measure accurate radial velocities of and and velocity dispersion of 8 km/s and 11 km/s for NGC 6539 and UKS 1, respectively,
keywords:
Galaxy: bulge, globular clusters: individual (NGC 6539 and UKS 1) — stars: abundances, late–type — techniques: spectroscopic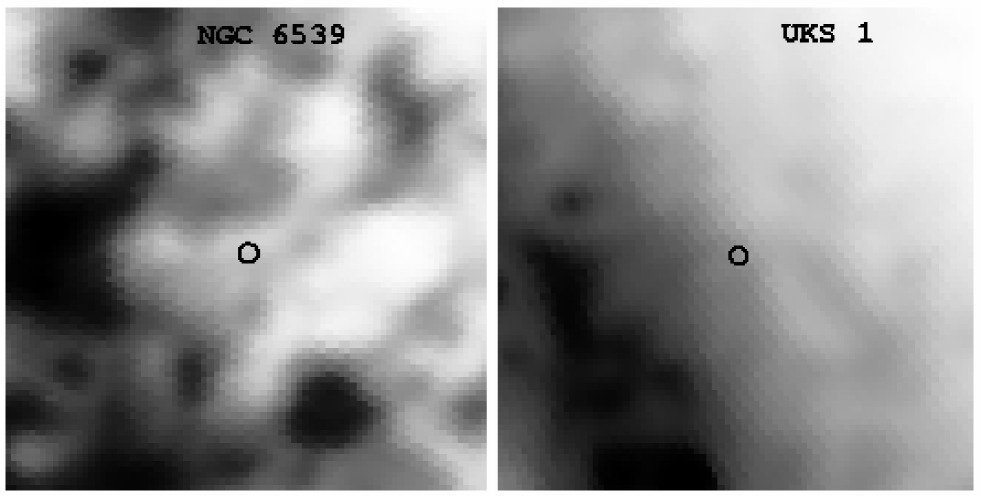
1 Introduction
Over the past few years we have commenced a survey of the Galactic bulge in the near-IR. We image the clusters using SOFI at the ESO/NTT to obtain accurate J,H,K photometry of globular clusters towards the bulge down to the base of the Red Giant Branch (RGB), to properly define their reddening, distance and photometric metallicity (Valenti, Ferraro & Origlia, 2004a, b; Valenti, Origlia & Ferraro, 2005). We use NIRSPEC, a high throughput infrared (IR) echelle spectrograph at the Keck Observatory (McLean et al., 1998) to measure their detailed chemical abundances. The near IR spectral range is indeed the most suitable to study obscured stellar populations, like the Galactic bulge and center.
H–band (1.5–1.8 m) spectra of cool giants contain several atomic and molecular lines for detailed abundance analysis of Fe, C, O and other -elements. The abundance and abundance pattern distributions in the cluster and field populations are indeed important in constraining the history of bulge formation and chemical enrichment (McWilliam, 1997). We have used this method to derive abundances for six bulge globular clusters: the results for NGC 6553 and Liller 1 are given in Origlia, Rich & Castro (2002), abundances for Terzan 4 and Terzan 5 are reported in Origlia & Rich (2004), while those for NGC 6342 and NGC 6528 are given in Origlia, Valenti & Rich (2005). We find -enhancement at a level of a factor between 2 and 3 over the whole range of metallicity spanned by the clusters in our survey, from [Fe/H]–1.6 (cf. Terzan 4) up to –0.1 (cf. NGC 6342, NGC 6553, Liller 1, Terzan 5, NGC 6528).
In this paper we present the analysis of NGC 6539 and UKS 1, two bulge globular clusters with high reddening, possibly with intermediate metallicity between Terzan 4 and the most metal rich ones observed so far. NGC 6539 is a poorly studied globular cluster located in the outer Bulge region (l=20.8, b=+6.8). A large dark cloud complex in the foreground is responsible for its high reddening (see Sandell, Stevens & Heiles, 1987). Fig. 1 (left panel) shows the IRAS 100 image of the field around the cluster, where the foreground dust complex is clearly visible. For this cluster Zinn & West (1984) found [Fe/H]=–0.660.15 from integrated optical spectra. More recently, Stephens & Frogel (2004) by means of low resolution IR spectroscopy of four giants found . UKS 1 is a very reddended globular cluster located in the inner Bulge (l=5.1, b=+0.8) and low onto the Galactic plane (see Fig. 1, right panel). It was discovered by Malkan (1980) and later on, both optical and near IR color-magnitude diagrams (CMDs) of the upper RGB have been published by Minniti (1995); Origlia et al. (1997); Ortolani et al. (2001). The photometric estimate of the cluster metallicity is strongly dependent on the reddening assumptions and controversial values of [Fe/H] between -1.2 and -0.3 have been suggested, that is either a metal poor or a metal rich object. Integrated optical spectroscopy by Bica et al. (1998) suggests a metallicity close to solar.
Both clusters lack high resolution measurements for accurate metallicity estimates, independent of reddening assumptions, and detailed abundance distributions. In the present work homogeneous metallicities and abundance patterns by means of near IR photometry and high resolution spectroscopy are derived for both clusters. Our observations and data reduction follow in Sect. 2. Sect. 3 discusses our abundance and radial velocity analysis and in Sect. 4 we discuss our findings.
2 Observations and Data Reduction
2.1 Photometry
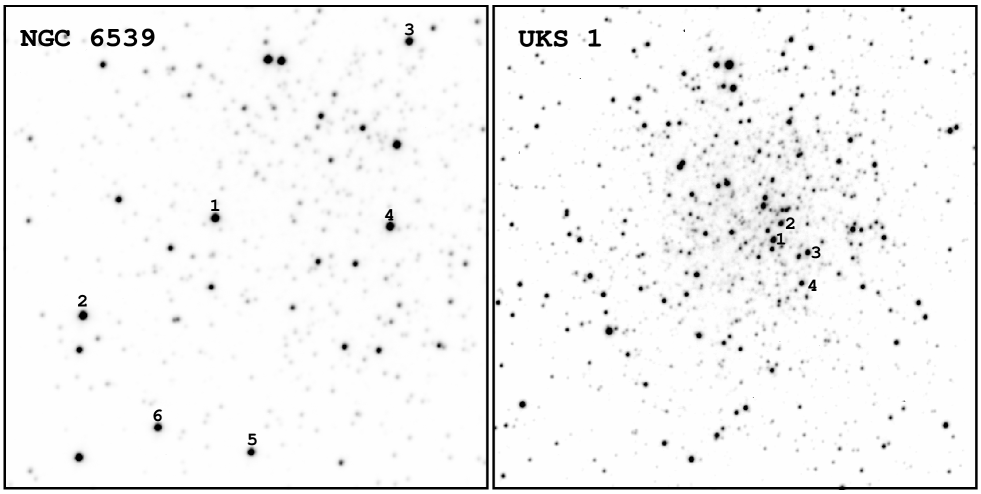
Near IR images of NGC 6539 and UKS 1 were obtained at the European Southern Observatory (ESO), La Silla on June 2004, with the near-IR imager SOFI, mounted at the ESO/NTT telescope. We used the large field camera coupled with the focal elongator, yielding a pixel size of and a total field of view of . In order to avoid saturation of the brightest RGB stars, we secured 30 single exposures of 1.2 sec in each filter. Every average image has been background-subtracted by using sky fields located several arcmin away from the cluster center, and flat-field corrected using a halogen lamp alternatively switched on and off, following the prescription of the standard SOFI calibration setup. Fig. 2 shows the H band images of NGC 6539 (left) and UKS 1 (right). The stars spectroscopically observed are numbered (cf. Table 1).
Standard crowded field photometry, including Point Spread Function (PSF) modeling, was carried out on each frame by using DAOPHOTII/ALLSTAR (Stetson, 1994). The photometric catalogues, listing the instrumental J, H and K magnitudes, were obtained by cross-correlating the single-band catalogues. By using the Second Incremental Release Point Source Catalogue of 2MASS, the instrumental magnitudes were then converted into the 2MASS photometric system. An overall uncertainty of mag in the zero-point calibration in all three bands has been estimated. The photometric catalogues have also been placed on the 2MASS astrometric system, using a procedure developed at the Bologna Observatory (P. Montegriffo, private communications) and successfully applied to other clusters (see e.g. Valenti, Origlia & Ferraro, 2005, and reference therein) providing rms residuals of 0.2 arcsec in both R.A. and DEC.
2.2 Spectroscopy
High-resolution echelle spectra of six bright giants in the core of the bulge globular clusters NGC 6539 and four in UKS 1 (see Fig. 2) have been acquired during two observational campaigns in July 2002 and April 2004. We used the infrared spectrograph NIRSPEC (McLean et al., 1998) which is at the Nasmyth focus of the Keck II telescope. The high resolution echelle mode, with a slit width of (3 pixels) and a length of 24″ and the standard NIRSPEC-5 setting, which covers most of the 1.5–1.8 micron H-band, has been selected. Typical exposure times (on source) ranged from 4 to 8 minutes.
The raw two dimensional spectra were processed using the REDSPEC IDL-based package written at the UCLA IR Laboratory. Each order has been sky subtracted by using the pairs of spectra taken with the object nodded along the slit, and subsequently flat-field corrected. Wavelength calibration has been performed using arc lamps and a second order polynomial solution, while telluric features have been removed by dividing by the featureless spectrum of an O star. At the NIRSPEC resolution of R=25,000 several single roto-vibrational OH lines and CO bandheads can be measured to derive accurate oxygen and carbon abundances. Other metal abundances can be derived from the atomic lines of Fe I, Mg I, Si I, Ti I and Ca I. Abundance analysis is performed by using full spectral synthesis techniques and equivalent width measurements of representative lines.
| NGC 6539 | UKS 1 | ||||||||||||
| star | #1 | #2 | #3 | #4 | #5 | #6 | #1 | #2 | #3 | #4 | |||
| 1.04 | 1.05 | 1.00 | 1.07 | 0.96 | 0.92 | 1.07 | 1.00 | 1.05 | 1.04 | ||||
| –3.0 | –2.9 | –2.6 | –2.9 | –2.3 | –2.6 | –3.0 | –2.7 | –2.9 | –2.6 | ||||
| [km s-1] | +43 | +27 | +33 | +24 | +27 | –135c | +45 | +67 | +58 | +187c | |||
| Ca 1.61508 | 146 | 146 | 149 | 144 | 126 | 166 | 156 | 121 | 143 | 267 | |||
| Fe 1.61532 | 174 | 178 | 188 | 170 | 188 | 216 | 164 | 168 | 166 | 269 | |||
| Fe 1.55317 | 153 | 164 | 165 | 141 | 171 | 194 | 149 | 157 | 154 | 228 | |||
| Mg 1.57658 | 401 | 400 | 401 | 388 | 404 | 426 | 372 | 386 | 385 | 453 | |||
| Si 1.58884 | 470 | 479 | 478 | 489 | 453 | 478 | 432 | 416 | 422 | 527 | |||
| OH 1.55688 | 264 | 270 | 264 | 302 | 200 | 228 | 257 | 181 | 243 | 329 | |||
| OH 1.55721 | 261 | 268 | 263 | 306 | 200 | 225 | 256 | 179 | 238 | 330 | |||
| Ti 1.55437 | 330 | 328 | 318 | 345 | 307 | 331 | 306 | 294 | 292 | 412 | |||
a Reddening corrected colors,
adopting Harris (1996)
E(B-V)=1.00 for NGC 6539 and E(B-V)=3.09 for UKS 1.
b Bolometric magnitudes adopting Harris (1996) distance moduli of (m-M)0=14.36
for NGC 6539 and (m-M)=14.39 for UKS 1 and bolometric correction from Montegriffo et al. (1998).
c Unlikely cluster members.
2.2.1 Abundance Analysis
We computed suitable synthetic spectra of giant stars by varying the stellar parameters and the element abundances using an updated version of the code described in Origlia, Moorwood & Oliva (1993). The main characteristics of the code have been widely discussed in our previous papers (Origlia, Rich & Castro, 2002; Origlia & Rich, 2004; Origlia, Valenti & Rich, 2005) and they will not be repeated here. The code uses the LTE approximation and is based on the molecular blanketed model atmospheres of Johnson, Bernat & Krupp (1980) at temperatures 4000 K and the ATLAS9 models for temperatures above 4000 K. Recently, the NextGen model atmospheres (Hauschildt et al., 1999) have been also implemented within our code and tested. However, when compared with the older models minor differences (well within a few hundredths dex) in the resulting abundances have been found. This is not surprising, since the major source of opacity in the H band spectra of cool stars is H- and small differences in the temperature structure of different model atmospheres have a minor impact on the overall abundance determination. The reference solar abundances are from Grevesse & Sauval (1998).
Photometric estimates of the stellar parameters are initially used as input to produce a grid of model spectra, allowing the abundances and abundance patterns to vary over a large range and the stellar parameters around the photometric values. The model which better reproduces the overall observed spectrum and the equivalent widths of selected lines is chosen as the best fit model. We measure equivalent widths in the observed spectrum (see Table 1), in the best fit model and in four additional models which are, respectively, 0.1 and 0.2 dex away from the best-fitting. This approach gives us the random errors in the inferred abundances listed in Table 2.

Stellar parameter uncertainty of 200 K in temperature (Teff), 0.5 dex in gravity (log g) and 0.5 km s-1 in microturbulence velocity (), can introduce a further systematic 0.2 dex uncertainty in the absolute abundances. However, since the CO and OH molecular line profiles are very sensitive to effective temperature, gravity, and microturbulence variations, they better constrain the values of these parameters, significantly reducing their initial range of variation and ensuring a good self-consistency of the overall spectral synthesis procedure (Origlia, Rich & Castro, 2002; Origlia & Rich, 2004; Origlia, Valenti & Rich, 2005). Indeed, our previous analysis of six globular clusters show that solutions with Teff200 K, log g=0.5 dex and 0.5 km s-1 and corresponding 0.2 dex abundance variations from the best-fitting one are indeed less statistically significant (typically at level only). Moreover, since the stellar features under consideration show a similar trend with variation in the stellar parameters, although with different sensitivity, relative abundances are less dependent on stellar parameter assumptions, reducing the systematic uncertainty to 0.1 dex.
In order to check further the statistical significance of our best-fitting solution, we also compute synthetic spectra with Teff200 K, log g=0.5 dex and 0.5 km s-1, and with corresponding simultaneous variations of 0.2 dex of the C and O abundances to reproduce the depth of the molecular features.
We follow the strategy illustrated in Origlia & Rich (2004); Origlia, Valenti & Rich (2005). As a figure of merit we adopt the difference between the model and the observed spectrum (hereafter ). In order to quantify systematic discrepancies, this parameter is indeed more powerful than the classical test, which is instead equally sensitive to random and systematic scatters. Since is expected to follow a Gaussian distribution, we compute and the corresponding standard deviation for our best-fitting solution and the other models with the stellar parameter and abundance variations quoted above. We then extract 10,000 random subsamples from each test model (assuming a Gaussian distribution) and we compute the probability that a random realization of the data-points around a test model display a that is compatible with an ideal best-fitting model with a =0. indicates that the model is a good representation of the observed spectrum. The statistical tests are performed on portions of the spectra mainly containing the CO bandheads and the OH lines which are the most sensitive to the stellar parameters.


| NGC 6539 | UKS 1 | ||||||||||||
|---|---|---|---|---|---|---|---|---|---|---|---|---|---|
| star | #1 | #2 | #3 | #4 | #5 | #6b | #1 | #2 | #3 | #4b | |||
| Teff [K] | 3800 | 3800 | 3800 | 3600 | 4000 | 4000 | 3800 | 4000 | 3800 | 3800 | |||
| log g | 0.5 | 0.5 | 0.5 | 0.5 | 0.5 | 0.5 | 1.0 | 1.0 | 1.0 | 0.5 | |||
| [km s-1] | 2.0 | 2.0 | 2.0 | 2.0 | 2.0 | 2.0 | 2.0 | 2.0 | 2.0 | 2.0 | |||
| –0.77 | –0.74 | –0.72 | –0.80 | –0.71 | –0.53 | –0.81 | –0.78 | –0.75 | –0.26 | ||||
| .07 | .07 | .07 | .08 | .07 | .07 | .09 | .08 | .08 | .11 | ||||
| +0.45 | +0.44 | +0.37 | +0.40 | +0.40 | +0.41 | +0.35 | +0.23 | +0.22 | +0.30 | ||||
| .09 | .10 | .08 | .10 | .12 | .08 | .10 | .09 | .09 | .12 | ||||
| +0.48 | +0.44 | +0.40 | +0.40 | +0.41 | +0.43 | +0.39 | +0.38 | +0.35 | +0.41 | ||||
| .12 | .12 | .12 | .13 | .13 | .12 | .17 | .17 | .17 | .14 | ||||
| +0.42 | +0.44 | +0.47 | +0.40 | +0.41 | +0.41 | +0.22 | +0.28 | +0.25 | +0.36 | ||||
| .18 | .18 | .18 | .19 | .16 | .16 | .18 | .17 | .17 | .19 | ||||
| +0.46 | +0.49 | +0.42 | +0.44 | +0.46 | +0.43 | +0.29 | +0.32 | +0.30 | +0.37 | ||||
| .18 | .18 | .18 | .17 | .16 | .16 | .16 | .19 | .15 | .16 | ||||
| +0.50 | +0.44 | +0.33 | +0.40 | +0.45 | +0.40 | +0.31 | +0.33 | +0.25 | +0.40 | ||||
| .19 | .19 | .19 | .16 | .19 | .18 | .19 | .18 | .18 | .15 | ||||
| +0.47 | +0.45 | +0.40 | +0.41 | +0.43 | +0.42 | +0.31 | +0.33 | +0.29 | +0.38 | ||||
| .11 | .11 | .11 | .12 | .12 | .11 | .12 | .12 | .12 | .14 | ||||
| –0.33 | –0.26 | –0.47 | –0.20 | -0.29 | -0.27 | –0.49 | –0.52 | –0.55 | –0.24 | ||||
| .10 | .10 | .10 | .11 | .10 | .10 | .12 | .11 | .11 | .13 | ||||
a is the average abundance ratio.
b Unlikely cluster members.
3 Results
3.1 IR Colour-Magnitude Diagrams
We use our IR photometric catalogs to construct suitable CMDs of the two clusters. Fig. 3 shows the de-reddened CMDs in the innermost region of the two clusters with superimposed the mean ridge lines a few reference clusters with different metallicities, reported at the adopted distance of NGC 6539 and UKS 1. In order to do this, for NGC 6539 we adopt E(B-V)=1.00 and (m-M)0=14.48 (Harris, 1996). The extinction of UKS 1 is huge: values between E(B-V)3 and 3.4 (Minniti, 1995; Harris, 1996; Origlia et al., 1997; Ortolani et al., 2001) and distance moduli between 14.2 (Harris, 1996) up to 15 (Minniti, 1995) have been suggested. We adopt E(B-V)=3.20 and (m-M)0=14.6 intermediate values. The RGB sequence in the CMD of NGC 6539 is rather well defined down to a couple of magnitudes below the Horizontal Branch. Its colors are most likely consistent with a metallicity somewhat in between NGC 6638 ([Fe/H]=0.99) and NGC 6342 ([Fe/H]=-0.65). The CMD of UKS 1 is less deep since the cluster is much more reddened and it is more sparse due to a higher degree of field contamination and possibly differential reddening, also in the innermost core region. Indeed, by using 2MASS photometry on an annular region between 2 and 6 arcmin around the cluster center, a up to 0.3 dex is present between the NW and NE sectors. The comparison of the UKS 1 RGB with the mean ridge lines of reference clusters (see Fig. 3), gives only a rough constraint of dex. As discussed in detail by Ferraro et al. (2000); Valenti, Ferraro & Origlia (2004a), a complete characterization of the RGB morphology, as a function of the cluster metallicity, can be obtained by computing a set of photometric indices, namely (i) the colours at fixed magnitudes; (ii) the magnitudes at constant colours and (iii) the RGB slope, using suitable CMDs and intrinsic ridge lines. The RGB slope is an interesting feature being both reddening and distance independent. Given the large reddening in both clusters we use this parameter as an indication of the photometric metallicity. By using the calibration of Valenti, Ferraro & Origlia (2004a) we constrain [Fe/H] between –0.8 and –0.7 in both clusters.
In each CMDs we also mark the position of the stars spectroscopically observed. They all lie in the innermost region of the clusters. In order to obtain a photometric estimate of the stellar temperatures and the bolometric magnitudes of these stars we adopt the color-temperature transformations and bolometric corrections of Montegriffo et al. (1998), specifically calibrated for globular cluster giants. By using the color, we constrain effective temperatures in the range 3600–4000 K, and bolometric magnitudes between -2 and -3 (see Table 1), their precise values depending on the adopted reddening and distance.
3.2 Chemical abundances
Detailed abundances and abundance patterns have been obtained
from the high resolution spectra, by combining full spectral synthesis
analysis with equivalent width
measurements.
We derive abundances of Fe, C, O
and 12C/13C for the observed
giants in NGC 6539 and UKS 1.
The abundances of additional elements Ca, Si, Mg and Ti are obtained
by measuring a few major atomic lines.
Stellar temperatures are both estimated from the
colors (see Table 1) and molecular lines,
gravity from theoretical evolutionary tracks,
according to the location of the stars on the RGB,
and adopting an average microturbulence velocity of 2.0 km/s
(see also Origlia et al., 1997).
The final adopted temperatures, obtained by best-fitting the CO and in
particular the OH molecular bands which are
especially temperature sensitive in cool giants, are reported in
Table 2.
Equivalent widths (see Table 1) are computed by Gaussian fitting
the line profiles and the overall uncertainty is 10%.
Fig. 4 shows our synthetic best fit models superimposed on the observed spectra of the six giants in NGC 6539. Stars #1 to #5 have similar heliocentric radial velocities, (cf. Table 1), the average value being and a velocity dispersion of 8 km/s. Star #6 has , so it is unlikely to be a member of the cluster. From our overall spectral analysis (cf. Table 2) we find the average cluster , and Star #6 has a slightly higher metal content but similar -enhancement. We also measure an average carbon depletion ([C/Fe]=–0.30 dex) and low . Fig. 5 shows our synthetic best-fitting superimposed on the observed spectra of the four giants in UKS 1. Stars #1 to #3 are likely cluster members (cf. Table 1), with an average and a velocity dispersion of 11 km/s. Star 4 has a significantly higher radial velocity, km/s. For this cluster our abundance analysis (cf. Table 2), give an average , and an overall average . We also measure an average carbon depletion ([C/Fe]=–0.52 dex), a low 12C/13C. Star #4 has a significantly higher iron abundance and slightly higher [/Fe] and [C/Fe] abundance ratios.
As shown in Figs. 6 and 7 our best-fitting solutions for both clusters have an average probability 0.99 to be statistically representative of the observed spectra. The other test models with slightly different assumptions for stellar temperatures, gravity, microturbulence and photospheric abundances (see Sect. 2.2.1) are only significant at level.


4 Discussion and Conclusions
We report near-IR photometry and high resolution spectroscopy for NGC 6539 and UKS 1. Both the RGB slope and abundance analysis of likely cluster members are consistent with them having similar iron abundance of 1/6 solar. Our iron abundance of NGC 6539 is fully consistent with the value found by Stephens & Frogel (2004). The significantly higher value suggested by Bica et al. (1998) for UKS 1 and obtained from integrated spectroscopy, can be easily explained in terms of field contamination. Indeed, our star #4, which is not a cluster member despite its position towards the cluster center and its luminosity typical of a RGB star near the tip, has a significantly higher metallicity, close to the value of Bica et al. (1998). According to our IR CMDS (cf. Fig.3) a [Fe/H]=–0.78 for UKS 1 is consistent with , e.g. , using a E(J–K)/E(B–V)=0.49 reddening law (Savage & Mathis, 1979). Both clusters show enhancement of -elements, confirming the scenario that the Bulge undergoes a rapid chemical enrichment from type II SNe ejecta.
The low abundance ratios measured in NGC 6539 and UKS 1 are similar to those found in our analysis of the other bulge clusters (see also Shetrone, 2003) as well as to those measured in the halo globular clusters (Shetrone, 1996; Gratton et al., 2000; Vanture, Wallerstein & Suntzeff, 2002; Smith, Terndrup & Suntzeff, 2002; Origlia et al., 2003). They can be explained by additional mixing mechanisms due to cool bottom processing in the stellar interiors during the evolution along the RGB (see e.g. Charbonnel, 1995; Denissenkov & Weiss, 1996; Cavallo, Sweigart & Bell, 1998; Boothroyd & Sackmann, 1999), and occurring over the entire metallicity range between one hundredth solar and solar.
Older measurements of radial velocities in NGC 6539, based on low resolution spectra (Zinn & West, 1984; Hesser, Shawl & Meyer, 1986) suggest somewhat different values (=–35 and –51 km/s, respectively) than those obtained here (see Table 1). However, since both the resolution and the quality of their spectra are low, as stated by the authors themselves, our new estimate of =+31 based on high resolution spectra should be more accurate.
Finally, we would like to note that stars #6 in NGC 6539 and star #4 in UKS 1, altough unlikely cluster members, have radial velocities and abundance patterns consistent with the field Bulge population (Rich & Origlia, 2005).
Acknowledgments
LO, EV and FRF acknowledge the financial support by
the Ministero dell’Istruzione, Università e Ricerca (MIUR).
RMR acknowledges support from grant number AST-0098739,
from the National Science Foundation.
The authors are grateful to the NTT staff
of the ESO Observatory.
They also acknowledge the Keck Observatory and
the NIRSPEC team.
The authors wish to recognize and acknowledge the very significant cultural
role and reverence that the summit of Mauna Kea has always had within
the indigenous Hawaiian community.
We are most fortunate to have the opportunity to conduct observations
from this mountain.
This publication makes use of data products from the Two Micron All Sky Survey,
which is a joint project of the University of Massachusetts and Infrared
Processing and Analysis Center/California Institute of Technology, founded by
the National Aeronautics and Space Administration and the National Science
Foundation.
References
- Bica et al. (1998) Bica, E., Claria, J. J., Piatti, A. E., Bonatto, C. 1998, A&AS, 131, 483
- Boothroyd & Sackmann (1999) Boothroyd, A. I., & Sackmann, I. J. 1999, 1999, ApJ, 510, 232
- Cavallo, Sweigart & Bell (1998) Cavallo, R. M., Sweigart, A. V., & Bell, R. A. 1998, ApJ, 492, 575
- Charbonnel (1995) Charbonnel, C. 1995, ApJ, 453, L41
- Denissenkov & Weiss (1996) Denissenkov, P. A, & Weiss, A. 1996, A&A, 308, 773
- Ferraro et al. (2000) Ferraro, F.R., Montegriffo, P., Origlia, L. & Fusi Pecci, F. 2000, AJ, 119, 1282
- Gratton et al. (2000) Gratton, R., Sneden, C., Carretta, E., & Bragaglia, A. 2000, A&A, 354, 169
- Grevesse & Sauval (1998) Grevesse, N., & Sauval, A. J. 1998, Space Science Reviews, 85, 161
- Hauschildt et al. (1999) Hauschildt, P. H., allard, F., Ferguson, J., Baron, E., & Alexander, D. R. 1999, ApJ, 525, 871
- Harris (1996) Harris, W. E. 1996, AJ, 112, 1487, for the 2003 updated version see http://physwww.mcmaster.ca/%7Eharris/mwgc.dat
- Hesser, Shawl & Meyer (1986) Hesser, J. E., Shawl, S. J., & Meyer, J. E. 1986, PASP, 98, 403
- Johnson, Bernat & Krupp (1980) Johnson, H. R., Bernat, A. P., & Krupp, B. M. 1980, ApJS, 42, 501
- Malkan (1980) Malkan, M., & Kleinmann, D. E. 1980, ApJ, 237, 432
- McLean et al. (1998) McLean, I. et al. 1998, SPIE, 3354, 566
- McWilliam (1997) McWilliam, A. 1997, ARA&A, 35, 503
- Minniti (1995) Minniti, D. 1995, AJ, 110, 1686
- Montegriffo et al. (1998) Montegriffo, P., Ferraro, F.R., Origlia, L., & Fusi Pecci, F. 1998, MNRAS, 297, 872
- Origlia, Moorwood & Oliva (1993) Origlia, L., Moorwood, A. F. M., & Oliva, E. 1993, A&A, 280, 536
- Origlia et al. (1997) Origlia, L., Ferraro, F. R., Fusi Pecci, F., & Oliva, E. 1997, A&A, 321, 859
- Origlia, Rich & Castro (2002) Origlia, L., Rich, R. M., & Castro, S. 2002, AJ, 123, 1559
- Origlia et al. (2003) Origlia, L., Ferraro, F. R., Bellazzini, M. & Pancino, E. 2003, ApJ, 591, 916
- Origlia & Rich (2004) Origlia, L., & Rich, R. M. 2004, AJ, 127, 3422
- Origlia, Valenti & Rich (2005) Origlia, L., Valenti, E., & Rich, R. M. 2005, MNRAS, 356, 1276
- Ortolani, Bica &Barbuy (1997) Ortolani, S., Bica, E., Barbuy, B. 1997, A&AS, 126, 319
- Ortolani et al. (2001) Ortolani, S. et al. 2001, A&A, 376, 878
- Rich & Origlia (2005) Rich, R. M., Origlia, L. 2005, ApJ, in press
- Sandell, Stevens & Heiles (1987) Sandell, G., Stevens, M. A., Heiles, C. 1987, A&A, 179, 255
- Savage & Mathis (1979) Savage, B. D. & Mathis, J. S. 1979, ARA&A, 17, 73
- Shetrone (1996) Shetrone, M. d. 1996, AJ, 112, 2639
- Shetrone (2003) Shetrone, M. d. 2003, ApJ, 585, 45
- Smith, Terndrup & Suntzeff (2002) Smith V. V., Terndrup, D. M., & Suntzeff, N. B. 2002, ApJ, 579, 832
- Stephens & Frogel (2004) Stephens, A. W., & Frogel, Jay A. 2004, AJ, 127, 925
- Stetson (1994) Stetson, P. B. 1987, PASP,99,191
- Valenti, Ferraro & Origlia (2004a) Valenti, E., Ferraro, F.R., & Origlia, L. 2004a, MNRAS, 351, 1204
- Valenti, Ferraro & Origlia (2004b) Valenti, E., Ferraro, F.R., & Origlia, L. 2004b, MNRAS, 354, 815
- Valenti, Origlia & Ferraro (2005) Valenti, E., Ferraro, F.R., & Origlia, L. 2005, MNRAS, in press, astro-ph/0505105
- Vanture, Wallerstein & Suntzeff (2002) Vanture, A. D., Wallerstein, G., & Suntzeff, N. B. 2002, ApJ, 569, 984
- Zinn & West (1984) Zinn, R., & West, M. J. 1984, ApJS, 55, 45