Charge Exchange Spectra of Hydrogenic and He-like Iron
Abstract
We present H-like Fe XXVI and He-like Fe XXV charge-exchange spectra resulting from collisions of highly charged iron with N2 gas at an energy of 10 eV amu-1 in an electron beam ion trap. Although individual high- emission lines are not resolved in our measurements, we observe that the most likely level for Fe25+ Fe24+ electron capture is , in line with expectations, while the most likely value for Fe26+ Fe25+ charge exchange is significantly higher. In the Fe XXV spectrum, the K emission feature dominates, whether produced via charge exchange or collisional excitation. The K centroid is lower in energy for the former case than the latter (6666 versus 6685 eV, respectively), as expected because of the strong enhancement of emission from the forbidden and intercombination lines, relative to the resonance line, in charge-exchange spectra. In contrast, the Fe XXVI high- Lyman lines have a summed intensity greater than that of Ly, and are substantially stronger than predicted from theoretical calculations of charge exchange with atomic H. We conclude that the angular momentum distribution resulting from electron capture using a multi-electron target gas is significantly different from that obtained with H, resulting in the observed high- enhancement. A discussion is presented of the relevance of our results to studies of diffuse Fe emission in the Galactic Center and Galactic Ridge, particularly with ASTRO-E2/Suzaku.
1 INTRODUCTION
Within the past decade, astrophysical X-ray emission via charge exchange (CX) has been recognized to occcur in comets, the atmospheres of planets including the Earth, throughout the heliosphere, and around other stars (see review by Cravens (2002) and references therein). Recently, observations with moderate spectral resolution by Chandra (Wargelin et al., 2004; Smith et al., 2005) and XMM-Newton (Snowden, Collier, & Kuntz, 2004) have detected clear signatures of geocoronal and heliospheric CX, most prominently in time-variable oxygen line emission, which may contribute a significant fraction of the soft X-ray background. All the aforementioned CX emission is from moderately ionized species such as He-like and H-like C, N, O, and Ne which originate in solar or stellar coronae. Those ions emit X rays when they CX with: neutral molecules such as H2O in comets; neutral H in the Earth’s outer atmosphere; and neutral interstellar H and He within the heliosphere or astrospheres around other stars.
CX has also been proposed (Tanaka, Miyaji, & Hasinger, 1999) to explain some and perhaps most of the line emission from more highly ionized species such as He-like and H-like Si, S, Ar, Ca, and Fe observed in diffuse emission from the Galactic Ridge (GR) and Galactic Center (GC) (Koyama et al., 1996; Kaneda et al., 1997; Ebisawa et al., 2001; Muno et al., 2004). According to this hypothesis, which is one of several competing explanations of GC/GR line emission (see Muno et al. (2004) and references therein), the highly charged ions are low-energy cosmic rays that CX with neutral gas in the plane of the Galaxy. This CX mechanism would naturally explain the remarkable similarity in the spectral shapes of GC and GR diffuse emission from widely separated regions of the Galaxy, since the emission arises from essentially the same population of ions with the intensity level primarily determined by the supply of neutral gas.
Galactic plane X-ray emission from cosmic-ray CX was in fact first considered by Silk & Steigman (1969). Subsequent studies of this idea, including those by Watson (1976), Bussard, Ramaty, & Omidvar (1978), and especially Rule & Omidvar (1979), concluded that the fraction of nearly fully ionized cosmic rays is negligible below several MeV amu-1, well above the energy at which CX cross sections begin a precipitous decline ( keV amu-1; Ryufuku & Watanabe (1979)). Most of the K-shell line flux was therefore predicted to be emitted from cosmic rays with kinetic energies of 1 MeV amu-1 or more (10 MeV amu-1 for Fe). For Fe lines this corresponds to Doppler widths of roughly 1 keV, much larger than the 170 eV FWHM broadening measured by Koyama et al. (1996) and Tanaka et al. (2000) in an ASCA spectrum of the GC. More recently, Muno et al. (2004) observed several GC fields with Chandra and deduced that Fe line broadening was probably no more than 100 eV and could be consistent with zero. For comparison, the Doppler broadening for Fe Ly in a plasma with keV is 7 eV. More importantly, because of the small CX cross sections at these high collision energies, CX line emission would be several orders of magnitude too weak to explain the Galactic plane emission.
Because of solar modulation, however, there are no measurements of the interstellar cosmic ray flux or ionization state below 1 GeV amu-1 (Fulks, 1975), so these predictions remain theoretical. Likewise, experimental cross section data for ion-ISM collisions in the MeV amu-1 energy range are sparse and theoretical calculations can have large errors. In addition, none of the studies to date have modeled more poorly understood processes such as multi-electron CX or multi-electron ionization. Although these effects were believed to be relatively minor, the last process in particular will extend the fully ionized regime to somewhat lower energies. Rule & Omidvar (1979) noted that multi-electron ionization may be especially important when the target nuclear charge is greater than that of the cosmic ray, and they also assumed for simplicity that the interstellar medium was entirely neutral. Heavy element abundance enhancements toward the center of the Galaxy, which were not considered, will also increase some effective cross sections, given that the importance of O, Fe, and other metals as neutral targets outweighs that of atomic H at the relevant collision energies.
Given these uncertainties, a cosmic-ray CX explanation for some of the Galactic Center and Galactic Ridge diffuse line emission should not yet be completely discounted, particularly for emission from lower charged cosmic-ray ions (e.g., -keV L-shell photons from CX of He-like through F-like Fe) which are more abundant at lower energies where CX cross sections are larger. It is also worth noting that consideration of the cosmic-ray ionization balance naturally leads to predictions of roughly two to three times as much He-like emission as H-like emission for all elements (Rule & Omidvar, 1979), in agreement with the ratios observed in ASCA spectra of the GC and GR (Tanaka, 2002).
Under certain conditions CX may also be a significant contributor to X-ray emission from highly charged ions that are thermally ionized. In addition to the many examples of solar wind CX described above, such conditions may occur in the Galactic Center as highly ionized plasma interacts with neutral gas on the boundaries of the dense molecular clouds that exist there. Another possibility is the mixture of shocked gas and evaporating clouds in supernova remnants, as has been considered by Wise & Sarazin (1989). The fraction of total emission in such cases is likely to be small, but CX emission can be distinguished from electron impact excitation by its unique spectral signatures, as discussed in §2. The XRS microcalorimeter detector on ASTRO-E2 (Mitsuda et al., 2004), which has 6-eV resolution, is particularly well suited to the study of supernova remnants given its non-dispersive spectral capability. The XRS also should be able to provide definitive measurements regarding the relevance of CX emission in the Galactic Center and Galactic Ridge, although its modest collecting area and small field of view will necessitate very long exposures to do so.
In the next section we briefly review the CX mechanism and discuss key diagnostics of CX emission that can be used in the analysis of ASTRO-E2 spectra. In §3 we describe our experiment, followed by an explanation of data analysis procedures in §4, discussion of results in §5, and conclusions in §6.
2 CHARGE EXCHANGE THEORY
CX is the radiationless collisional transfer of one or more electrons from a neutral atom or molecule to an ion. If the recipient ion is highly charged it is left in an excited state which then decays via radiative cascades, or if the neutral species donates more than one electron, by some combination of radiative decay and autoionization. Single-electron capture generally dominates for highly charged ions; multiple-electron CX is discussed in §5.4.
Since no photons are emitted during the electron transfer, the sum of the internal energies of the ion and atom/molecule are conserved, and the donated electron(s) can be transferred only to specific levels in the ion. The resonant character of the electron transfer is softened somewhat by distortion of the energy levels of ion and atom during the collision, so that a range of atomic states is accessible. For low collision energies (up to 100 keV amu-1), the level with the largest capture probability for single-electron transfer is given approximately by Janev & Winter (1985) (rewriting to explicitly include the neutral species ionization potential) as
| (1) |
where is the ion charge, is the ionization potential of the neutral species, and is the ionization potential of atomic H (13.6 eV). For Fe26+ and Fe25+ colliding with H at low energies, is therefore expected to be 12. Molecular nitrogen has an ionization potential of 15.6 eV (14.5 eV for atomic N), so for CX with N2 is nearly the same as with H. At low collision energies, the -distribution has a fairly sharp maximum, but gradually broadens to its widest at keV amu-1. At even higher energies, slowly decreases and the distribution narrows again (Ryufuku & Watanabe, 1979).
The angular momentum () distribution varies more strongly with collision energy. The details of this energy dependence are important because they affect how the excited ion can radiatively decay, e.g., directly to ground if , or via cascades for large values of initial . The distribution is especially important in the CX of fully stripped ions, which yields excited hydrogenic ions. For example, if the initial excited level is an state, it can decay directly to the ground state yielding a Ly photon. If the ion starts from an , , , , or other state, however, it cannot decay to ground because of the selection rule. Instead, the ion is likely to end up decaying along the “yrast chain” in sequential steps with (), ultimately resulting in Ly emission.
At low collision energies, low- states are most likely to be populated (Ryufuku & Watanabe, 1979) and the combined intensity of high- lines () may exceed that of Ly (Beiersdorfer et al., 2000). As energy increases, however, the distribution becomes more statistical in nature (in proportion to ) and fewer of the initial states can decay directly to ground, resulting in a higher fraction of Ly emission. The hardness ratio of high- versus Ly emission can thus be used as a diagnostic of collision energy, as illustrated for O VIII and Ne X by Beiersdorfer et al. (2001).
At the higher energies of relevance for cosmic-ray CX ( keV amu-1) only a few percent of the X-ray emission is from high- states. The absence of significant high- Fe lines in observations of diffuse emission from the Galactic Ridge and Galactic Center therefore does not necessarily indicate the absence of cosmic-ray CX emission (cf. Masai et al. (2002)). Enhanced high- emission is expected, however, when collision energies are low, e.g., in the highly ionized plasma/molecular cloud scenarios described in §1.
The hardness ratio of emission from He-like ions is much less sensitive to collision energy because the line (K) always dominates. From simple spin statistics, following electron transfer a He-like ion will have total spin about 3/4 of the time, and only 1/4 of the time. Since only transitions are allowed, none of the high- (triplet) states can decay to the (singlet) ground state, and instead the excited electron cascades to one of the triplet states from which it ultimately decays via a forbidden or semi-permitted transition.
Within the level, the triplet and states that give rise to the “intercombination” and “forbidden” lines, respectively, receive much more of the cascade-derived population than the singlet state that yields the “resonance” line. The triplet lines are therefore much stronger relative to the resonance line in CX spectra than they are in thermal plasmas. (See recent measurements by Beiersdorfer et al. (2003) and theoretical predictions by Kharchenko et al. (2003).) Given adequate energy resolution, this is an excellent indicator of CX emission, regardless of ion-neutral collision energy. As we illustrate in §5.1, even if the K lines are instrumentally blended one may still be able to use the energy centroid of the blend to distinguish between CX and thermal emission.
Intriguingly, Muno et al. (2004) report that in the two regions near the GC that yielded the most precise spectral fitting results, the Fe XXV K energy was measured to be and eV, significantly less than the 6700-eV energy of the resonance line that dominates collisional spectra, and very close to the centroid energy we measure in our CX spectrum (see §5). The energy calibration for these measurements, however, had to be shifted by 33 eV for reasons that are not well understood; the absolute uncertainty in energies is probably something like eV, so drawing firm conclusions about forbidden-line enhancement in the GC is risky.
3 EXPERIMENTAL METHOD
Our experiment used the Lawrence Livermore National Laboratory (LLNL) EBIT-II electron beam ion trap to collect Fe XXVI and Fe XXV CX spectra using N2 as the neutral gas. The operation of EBITs has been described extensively elsewhere (Levine et al., 1988) as has the magnetic trapping mode (Beiersdorfer et al., 1996a) used for these measurements. To briefly summarize, singly or doubly charged Fe ions are injected into the EBIT-II trap region from a metal vapor vacuum arc (MeVVA) where they are longitudinally confined by an electrostatic potential and radially confined by a 3-T magnetic field, as well as by electrostatic attraction of the narrow (60-m) electron beam. The beam, with a current of 140 mA for all our measurements, passes vertically through the short trap region (2 cm tall) where it collisionally ionizes and excites the relatively stationary ions. A neutral gas injector and several spectrometers are arrayed azimuthally around the ion/electron/gas interaction region.
The neutral target gas is injected directly into the trap where some N2 molecules CX with the trapped Fe ions before being ionized and dissociated themselves. Although CX cross sections are much larger than those for electron impact excitation and ionization (of order cm2 versus cm2 in this case), the neutral gas has a much lower density than the electron beam (– cm-3 versus cm-3) and the CX collision velocity (essentially equal to the ion velocity, – cm s-1) is much smaller than the electron beam velocity (cm s-1). The product of ion density and the effective emission volume (determined by the electron beam diameter when the beam is on and the ion cloud size when the beam is off) is roughly the same whether the beam is on or off, so the rate of CX interactions is only 1% that for electron-ion collisions.
CX spectra are therefore collected in the magnetic trapping mode with the electron beam turned off (response time 60 s) once the desired ion charge balance has been attained, which takes roughly 1 second. The ions are still confined (though less densely) within the trap region, where they collide with neutral nitrogen molecules, undergo CX, and emit photons. As illustrated in Figure 2 of Beiersdorfer et al. (2000), the magnetic trapping mode allows a weak CX spectrum, which would otherwise be swamped by the much stronger electron-impact collisional spectrum, to be revealed. Our measurements record the net result of all relevant CX processes, whether from single or multi-electron transfer, radiative decays, or autoionization, as manifested by their spectra.
Two high-purity Ge detectors with energy resolutions of eV and eV (FWHM at 7 keV), were used to collect spectra. The signal-processing lower level discriminators were set at 5 and 4 kev, respectively, to exclude unnecessary events and prevent event pile-up. All the results we present were obtained with the higher-resolution detector, but the second detector with its lower energy threshold was helpful in identifying trap contaminants.
Because the detector resolution was insufficient to directly separate the spectra of Fe XXVI and Fe XXV, data were collected in two measurements using different electron beam energies. The low-energy run (L) used keV, and the two high-energy runs (I and J) were at 17.2 keV. For comparison, the ionization potentials of Li-like Fe23+, He-like Fe24+, and H-like Fe25+ are 2.046, 8.828, and 9.278 keV, respectively (see Table 3). During run L most of the trapped ions were He-like, with a small fraction of H-like. The observed CX spectrum was therefore a nearly pure He-like spectrum. (The Li-like CX spectrum lies below 2 keV, well below the lower level discriminator setting.) In runs I and J (17.2 keV), the trap contained significant fractions of He-like, H-like, and bare ions, with a roughly 2:1 ratio of Fe25+ and Fe26+, resulting in a mixed CX spectrum of He-like Fe XXV and H-like Fe XXVI lines.
| Ion | Level | Energy | Reference | Line Energy Centroid | aaRR spectral peaks appear at energy . | ||||||
|---|---|---|---|---|---|---|---|---|---|---|---|
| (eV) | (eV) | (eV) | |||||||||
| Fe XXVI | 0 | 0 | |||||||||
|
(Ly) | ||||||||||
|
(Ly) | ||||||||||
|
(Ly) | ||||||||||
|
(Ly) | ||||||||||
|
(Ly) | ||||||||||
|
(Ly) | ||||||||||
| Fe XXVI | Ion. Pot. | 1 | |||||||||
| Fe XXV | 0 | ||||||||||
|
(K) measured | ||||||||||
|
(K) | ||||||||||
|
(K) | ||||||||||
|
(K) | ||||||||||
|
(K) | ||||||||||
| Fe XXV | 4 | (K) | |||||||||
| Fe XXV | Ion. Pot. | ||||||||||
|
below LLD | ||||||||||
|
below LLD | ||||||||||
|
below LLD | ||||||||||
|
below LLD | ||||||||||
|
below LLD | ||||||||||
|
below LLD | ||||||||||
| Fe XXIV | Ion. Pot. | 4 |
References. — (1) Erickson 1977; (2) Plante, Johnson, & Sapirstein 1994; (3) Vainshein & Safronova 1985; (4) This work; (5) D. Liedahl 1998 (private communication) using HULLAC.
Note. — Line energy centroids are the same (within uncertainties) for both EIE (beam-on) and CX (beam-off) spectra, with the exception of the energy for He-like K which is left free during spectral fitting. Energy-level weightings for RR into are based on cross sections listed in Table 2; weightings for higher- RR were extrapolated, as described in the text.
In the 31-hour L run, ions were electrostatically trapped and ionized for 3.5 seconds (the beam-on phase), followed by 2.5 seconds of magnetic trapping (the beam-off CX phase). In the I and J runs (18 and 20 hours) the beam-on phase lasted 4.5 seconds. The trap electric potential was 300 V for run L and 100 V for I and J; the difference in trap potentials was inadvertent and results in only a small difference in effective ion-neutral collision energies. Based on past measurements of ion energies as a function of trapping parameters (Beiersdorfer et al., 1996b), we estimate the average ion energy in both cases to be roughly 10 eV amu-1: between 5 and 20 eV amu-1 for runs I and J, and approximately double that for run L. The ions have a non-thermal energy distribution so one can’t strictly speak of an equivalent temperature, but setting (56 amu)(10 eV amu-1) yields K. Although the Fe XXV CX spectrum was collected under two different trap conditions, its weak dependence on collision energy, as explained in §2, means that the results from run L can be applied to runs I and J with little error.
4 DATA ANALYSIS
4.1 Energy Calibration
Because all the lines of interest are at least partially blended, precise knowledge of the line energies and the detector energy scale is essential for proper spectral fitting. Published line energies were weighted by theoretical cross sections to predict the centroid energies of all relevant emission line blends. Detector energy scales were calibrated by fitting the beam-on spectra (see Figure 1), which have far more counts than the beam-off (CX) data. The CX spectra were then fit using the derived energy calibrations and detailed spectral models.
To simplify analysis and increase the signal-to-noise ratio, and because their spectra were virtually identical, data from runs I and J were combined by scaling the energy/channel relationship of run J by 0.9980 with an offset of channels (2.7 eV) and rebinning to match run I. As explained below, the He-like Fe XXV K line was used as an absolute energy reference while radiative recombination (RR) “lines” in the beam-on spectra, which are widely separated with well known energy differences, were used to deduce the scaling factors (eV per detector channel).
4.1.1 Polarization and Effective Line Energies
During the beam-on phase, the unidirectional nature of the electron-ion collisions leads to polarization effects and non-isotropic emission. During the beam-off phase, however, there is no preferred direction for ion-neutral collisions and the resulting CX emission is unpolarized. Each emission line and RR feature is usually a blend of several transitions, so the strength of each transition and its polarization must be known in order to predict the energy centroid of the observed feature.
Table 3 lists theoretical energies of individual levels. Uncertainties are based on comparisons among different sources where possible. Polarization corrections were made according to the prescriptions described by Wong et al. (1995). These corrections have negligible effect on emission line centroids in nearly all cases, but polarization is more important for RR features, as described below.
In H-like Fe XXVI, the simple 2:1 intensity ratio of transitions from and levels is slightly modified by polarization adjustments to 2.1:1. For Ly this shifts the centroid from 6966.0 to 6966.2 eV. Energy shifts for higher- lines are even smaller.
For He-like emission from , selection rules dictate that transitions from to ground dominate, but there are also significant contributions from levels because of level mixing between states with the same and . The () ratio has been measured to be 1/3 at 8 and 10 keV (Smith et al., 2000). At higher energies, the excitation cross section for decreases rapidly while that for remains roughly constant for energies up to several times threshold. We therefore assume that is at 17 keV. For higher the ratio is smaller than for ; the actual values for are of little importance so we conservatively assume for both 9.2 and 17 keV.
For , emission from other triplet levels ( and ) is also important, and the relative intensities of all the lines, which have a relatively large energy spread, can not be predicted accurately. We therefore leave the energy free in spectral fits.
Line-energy centroids, appropriate for both the beam-on and beam-off phases, are listed in Table 3. Average energies for RR into and 2 are also listed and were derived from RR cross sections listed in Table 2. The RR cross sections include polarization effects appropriate for our instrumental geometry (with observations perpendicular to the electron beam axis) and were calculated (Scofield, 1989) using matrix elements obtained from a version of the GRASP Code (Parpia et al., 1996) that was modified to calculate the wave functions of the free electrons along with their phase shifts. The extension beyond a central potential model was needed to treat the recombination onto open subshells. Results were extrapolated from to higher using the same - and -state weightings and assuming that RR into -levels other than and is small. Errors in those assumptions become less important as increases because the energy spread within a given -level decreases, and the quoted uncertainties are conservative.
| keV | keV | keV | ||||||||||
|---|---|---|---|---|---|---|---|---|---|---|---|---|
| Ion | Level | |||||||||||
| Fe XXVI | 226.37 | 26.422 | 99.9 | 120.95 | 13.989 | 99.9 | 76.55 | 8.775 | 99.9 | |||
| Fe XXVI | 33.57 | 3.966 | 100.0 | 17.52 | 2.052 | 99.9 | 10.89 | 1.264 | 99.9 | |||
| Fe XXVI | 10.88 | 1.042 | 57.6 | 4.13 | 0.378 | 49.6 | 2.03 | 0.179 | 43.8 | |||
| Fe XXVI | 20.44 | 1.969 | 56.6 | 7.67 | 0.706 | 47.5 | 3.74 | 0.332 | 40.5 | |||
| Fe XXV | 112.84 | 13.195 | 99.9 | 60.60 | 7.023 | 99.9 | 38.45 | 4.418 | 99.9 | |||
| Fe XXV | 23.36 | 2.761 | 100.0 | 12.18 | 1.427 | 99.9 | 7.56 | 0.878 | 99.9 | |||
| Fe XXV | 2.44 | 0.234 | 57.3 | 0.92 | 0.084 | 49.1 | 0.45 | 0.040 | 43.2 | |||
| Fe XXV | 7.27 | 0.697 | 57.2 | 2.74 | 0.251 | 48.9 | 1.34 | 0.118 | 42.9 | |||
| Fe XXV | 8.31 | 0.982 | 100.0 | 4.36 | 0.512 | 99.9 | 2.72 | 0.316 | 99.9 | |||
| Fe XXV | 11.48 | 1.105 | 56.3 | 4.28 | 0.394 | 46.9 | 2.08 | 0.185 | 39.9 | |||
| Fe XXV | 6.91 | 0.665 | 56.4 | 2.58 | 0.237 | 47.1 | 1.26 | 0.111 | 40.2 | |||
| Fe XXIV | 29.75 | 3.517 | 100.0 | 15.55 | 1.823 | 100.0 | 9.67 | 1.124 | 99.9 | |||
| Fe XXIV | 8.69 | 0.831 | 56.9 | 3.26 | 0.297 | 48.5 | 1.59 | 0.140 | 42.5 | |||
| Fe XXIV | 16.37 | 1.575 | 55.9 | 6.07 | 0.558 | 46.4 | 2.94 | 0.261 | 39.3 | |||
| keV | keV | keV | ||||||||||
| Fe XXVI | 53.08 | 6.031 | 99.8 | 39.03 | 4.395 | 99.8 | 29.90 | 3.338 | 99.8 | |||
| Fe XXVI | 7.44 | 0.857 | 99.9 | 5.41 | 0.617 | 99.9 | 4.11 | 0.465 | 99.8 | |||
| Fe XXVI | 1.16 | 0.099 | 39.5 | 0.72 | 0.060 | 36.0 | 0.48 | 0.039 | 33.3 | |||
| Fe XXVI | 2.11 | 0.182 | 35.0 | 1.31 | 0.110 | 30.5 | 0.87 | 0.072 | 26.7 | |||
| Fe XXV | 26.71 | 3.041 | 99.9 | 19.65 | 2.218 | 99.8 | 15.06 | 1.685 | 99.8 | |||
| Fe XXV | 5.16 | 0.594 | 99.9 | 3.75 | 0.428 | 99.9 | 2.85 | 0.322 | 99.8 | |||
| Fe XXV | 0.26 | 0.022 | 38.8 | 0.16 | 0.013 | 35.4 | 0.11 | 0.009 | 32.7 | |||
| Fe XXV | 0.76 | 0.065 | 38.4 | 0.48 | 0.040 | 34.9 | 0.32 | 0.026 | 32.1 | |||
| Fe XXV | 1.87 | 0.215 | 99.9 | 1.36 | 0.155 | 99.9 | 1.03 | 0.117 | 99.8 | |||
| Fe XXV | 1.17 | 0.101 | 34.4 | 0.73 | 0.061 | 29.8 | 0.48 | 0.040 | 26.0 | |||
| Fe XXV | 0.71 | 0.061 | 34.8 | 0.44 | 0.037 | 30.4 | 0.29 | 0.024 | 26.8 | |||
| Fe XXIV | 6.61 | 0.762 | 99.9 | 4.80 | 0.549 | 99.9 | 3.65 | 0.413 | 99.8 | |||
| Fe XXIV | 0.90 | 0.077 | 38.1 | 0.56 | 0.047 | 34.7 | 0.38 | 0.031 | 32.0 | |||
| Fe XXIV | 1.66 | 0.143 | 33.7 | 1.03 | 0.086 | 29.2 | 0.68 | 0.056 | 25.4 | |||
Note. — Total cross sections are in units of cm2. Differential cross sections are for observations perpendicular to the electron beam direction in units of cm2 sr-1. Polarizations are given in percentages.
For both emission lines and RR, uncertainties in the weighted energies are driven largely by uncertainties in the energies of individual levels. In the end, errors in the calibration of the energy scale have an insignificant effect on the spectral fitting results.
4.1.2 Beam-On Spectral Fitting
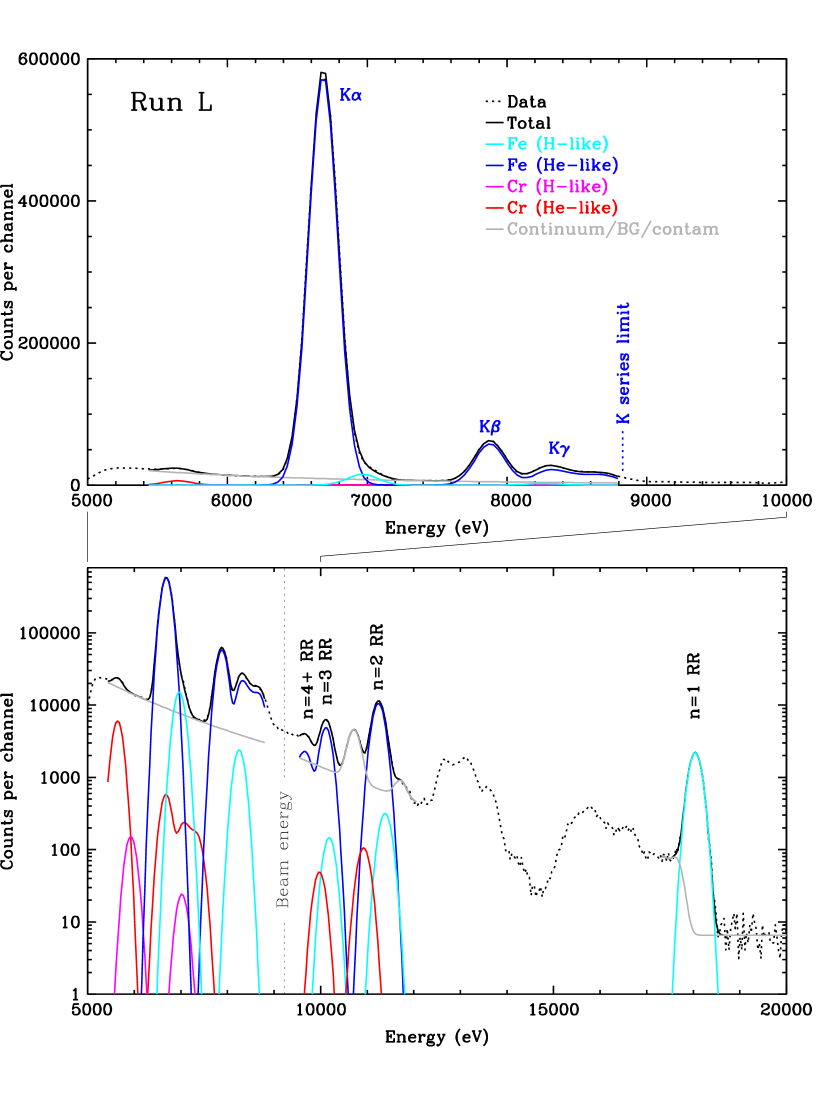
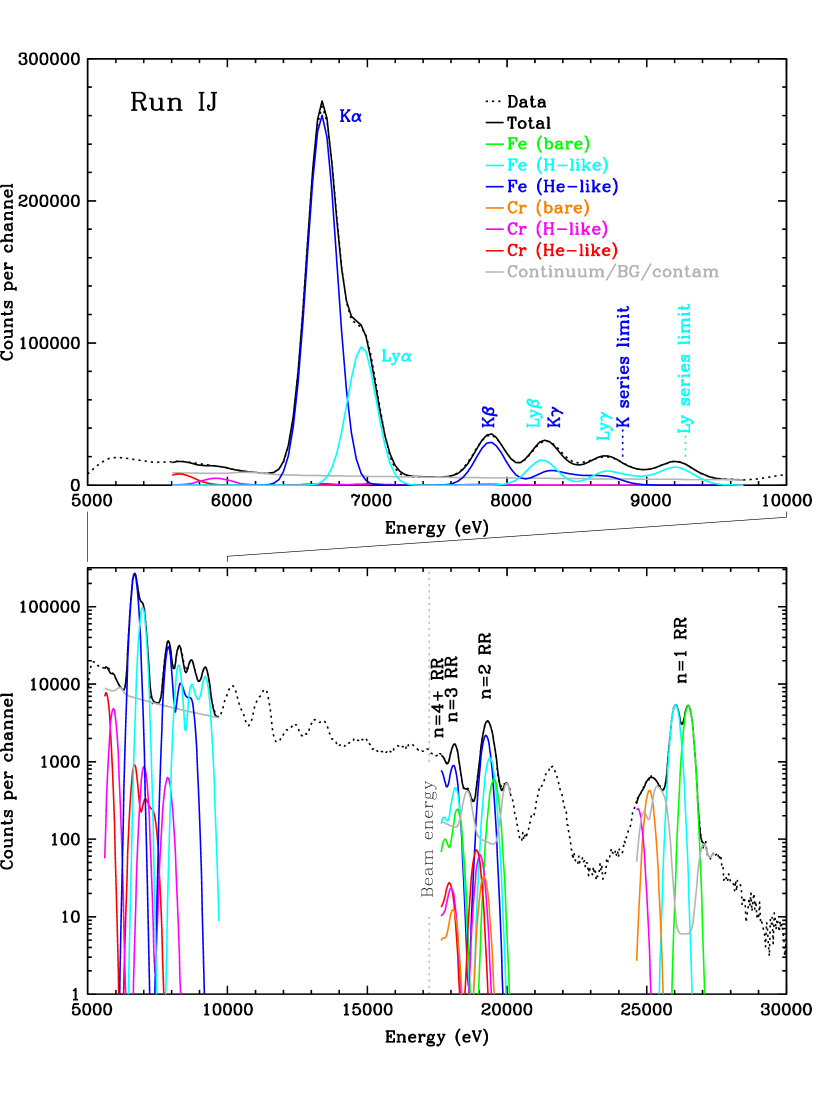
The beam-on spectra were fit using the Chandra Interactive Analysis of Observations (CIAO) Sherpa fitting package (Freeman, Doe, & Siemiginowska, 2001). All lines were fit using Gaussians, in three energy ranges encompassing electron impact excitation (EIE) lines, RR into , and RR into (see Figure 1). Within the EIE group, line energies and widths were linked to those for Fe XXV K, except for the Fe XXV K blend and the unresolved K and Lyman series limit blends. Continuum emission (from two-photon radiation, bremsstrahlung, and low-energy tails and other instrumental effects in the Ge detectors and signal-processing electronics) was fit with power laws. EIE lines from and () were included in the fits, although for the intensities of individual lines could not be reliably constrained.
Contaminants are always present in the trap, usually at an insignificant level and/or with emission at energies that do not interfere with Fe. One minor exception here was Cr, the presence of which was deduced from its Cr XXIII K emission (and Cr XXIV Ly in run IJ). In run L the He-like Cr K intensity is 1% of that for Fe K; in run IJ the He-like Cr/Fe ratio is 3% with H-like Cr Ly at 13% of the Fe Ly intensity. Higher- Cr EIE and RR lines were included in the fits, with intensities scaled to the corresponding Fe lines. A few other contaminant lines (Ba from the electron gun filament, Ar from other spectrometers’ proportional counters, and Ti from impurities in the Fe MeVVA wire) were included to slightly improve the quality of the RR fits.
In run L, the EIE spectrum was dominated by He-like Fe XXV lines, but there was also a small contribution from Fe XXVI. Fit results for Ly (with 2.8% the strength of K) were used to scale the H-like He-like and 3 RR lines relative to their He-like Li-like counterparts.
Fit sensitivities were studied by varying continuum levels, the number and strength of contaminant lines, and links between line energies and widths. In all cases, uncertainties in Fe line positions are dominated by counting statistics, but to be conservative we set the overall line errors equal to double the statistical errors.
For run L, the RR peak (H-like He-like Fe) and and 3 RR peaks (dominated by He-like Li-like Fe) were used to determine the energy scale of eV channel-1, and the position of the Fe XXV K line (7878.5 eV) was determined with an accuracy corresponding to eV. With the absolute energy calibration established, the electron beam energy centroid was measured to be eV.
Run IJ had a more balanced mix of He-like, H-like, and bare Fe ions and thus a complicated blend of lines in the and 3 RR peaks (with relative intensities of each ion’s RR emission fixed at 56:29:15, respectively, based on the RR fits, Ly/K ratio, and theoretical cross sections for EIE and RR), so the IJ energy scale ( eV channel-1) was less well calibrated than for the L run. Note that energy scales for the two runs are not expected to be identical because of thermal drifts in the signal-processing electronics. The Fe XXV K line position was slightly less well measured ( eV) than in run L because of the presence of Lyman-series emission, and the electron beam energy was determined to be eV.
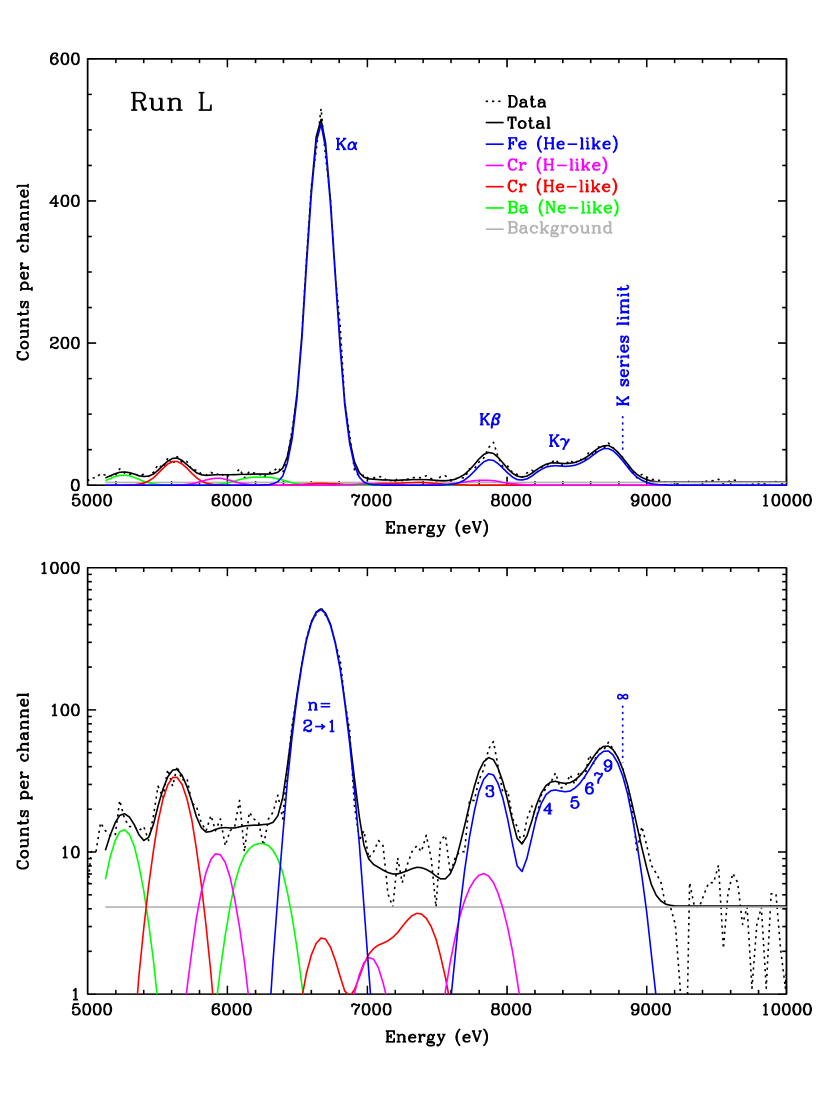
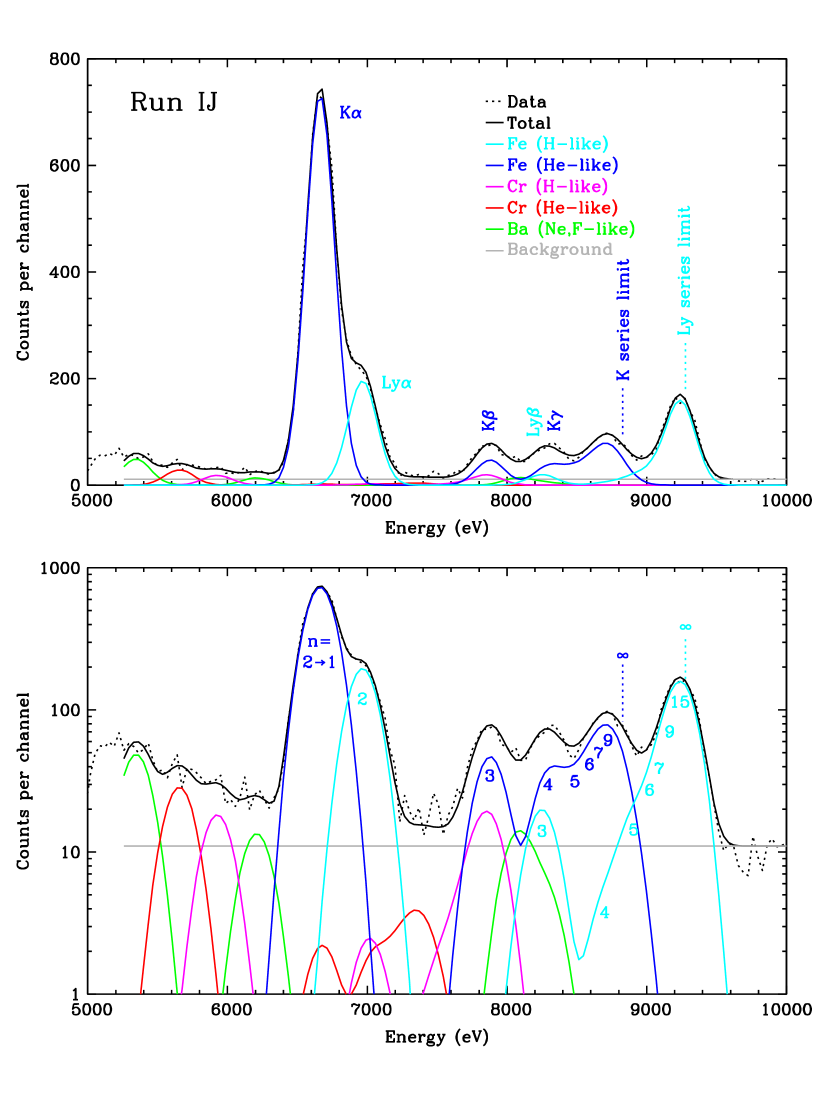
4.2 CX Spectral Fitting
For the CX spectra (Figure 2) we first fit the L data and then used those results as a template for the He-like spectrum when fitting the combined He-like and H-like spectra in the IJ data. As was done for the beam-on fits, we modeled the He-like and H-like Cr spectra by fixing their line intensities at a set fraction of their Fe counterparts, based on the fitted Cr K/Fe K ratio (0.067 for run L and 0.045 for run IJ) and Cr Ly/Fe Ly ratio (0.12 for run IJ).
For the L spectrum, all line energies were fixed except for Cr and Fe K, and Cr and Fe Klimit. The Fe K and Klimit lines also had free widths (with linked Cr line widths); all other line widths were linked to Fe K. The background was fixed at a constant level based on its value at energies above 9.2 keV. Two weak Ne-like Ba lines at 5290 and 6200 eV were also included. Some slightly stronger Ne-like Ba lines were seen in the second Ge detector around 4390 and 4550 eV, giving us confidence in these line identifications. As noted earlier, Ba is always a contaminant in the EBIT-II and comes from the electron gun filament, but its emission has very little effect on the Fe fits.
For the IJ fits, the He-like Cr and Fe spectra derived from the run L fits were simply normalized to the fitted intensities of Cr K and Fe K with no other free parameters. All Cr and Fe Lyman line energies and widths were fixed except for the Lylimit lines, with the Cr lines scaled to their Fe counterparts as described above.
Strictly speaking, the Fe XXV spectra will be different in runs L and IJ because of the contribution of double-electron capture (DEC) in run IJ but not in run L, which did not have any bare Fe ions. However, as explained in §5.4, DEC has a significantly lower cross section than single-electron capture (SEC) and the Fe XXV spectra that result from SEC and DEC are expected to be very similar. The effect on the Fe XXVI fits will in any case be very minor since the Fe XXV emission lines do not overlap with the main features of the Fe XXVI spectrum, which are Ly and the high- Lyman peak.
As in the L fit, two Ne-like Ba lines were included below Fe K and a flat background was assumed. Given the higher beam energy in run IJ (17.21 keV, compared with 8.33 keV for the ionization potential of Ne-like Ba), there is also likely to be some emission from other more highly charged species of Ba. Indeed, there are small but probably real excesses of emission just below and above the Fe K+Ly peak that we attribute to the peaks of O-like F-like and F-like Ne-like Ba charge exchange. As seen in Figure 2, however, particularly in the upper linear-scale plots, contaminant emission exists at a very low level and has essentially negligible effect on the fitted intensities of the Fe lines.
5 RESULTS AND DISCUSSION
5.1 Line Energies
Although the four lines within the Fe XXV K complex cannot be resolved, the energy centroid of K was measured fairly accurately. In the run-L CX spectrum the K blend energy was eV, in contrast to the beam-on centroid of eV, a difference of eV. (Note that the absolute energy calibration error is the same for both measurements and thus is not included in the difference error.) As explained in §2, a shift is expected because the forbidden and intercombination lines are much stronger (relative to the resonance line) in CX spectra than when excited by electron collisions. A similar but less accurately measured shift was also observed in the IJ fits.
The Fe Klimit energy was measured to be eV, corresponding to the energy of the level. The most likely level of CX electron capture () is probably a little higher than because the Klimit peak is a blend of all lines with and is not resolved from the or 7 peaks. The approximation given by Eq. 1, is thus quite good.
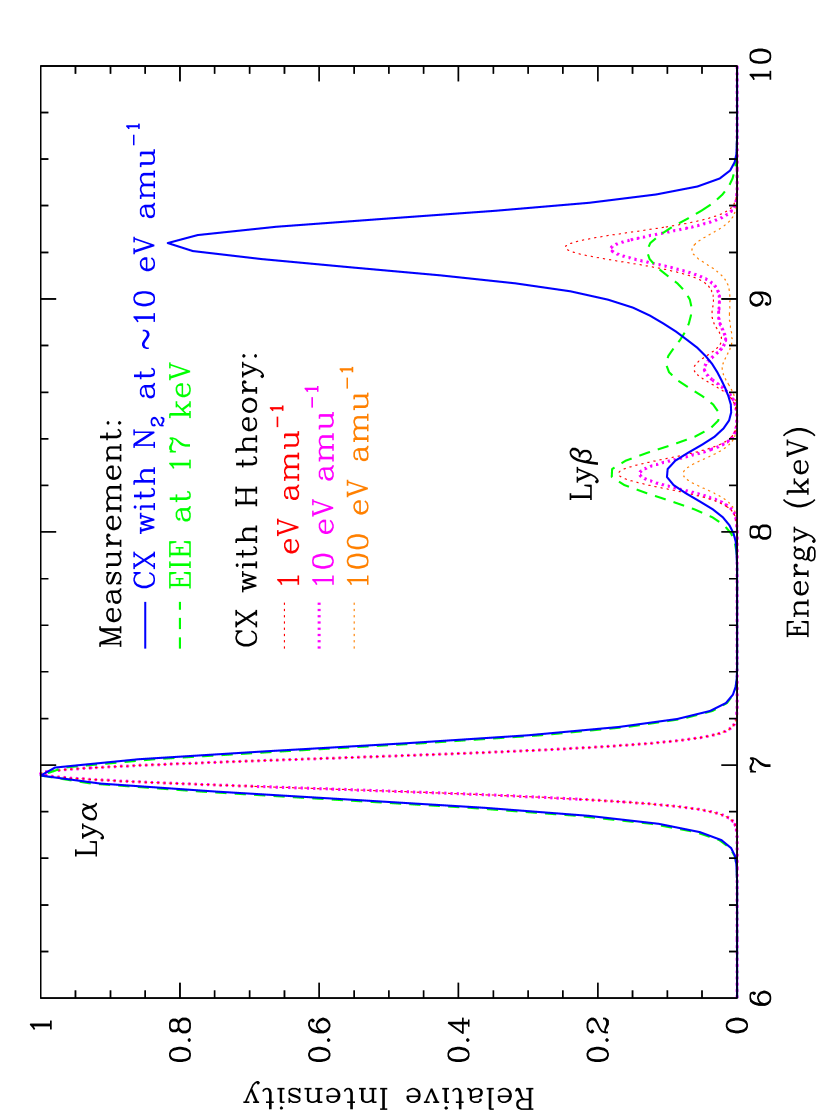
The Fe Lylimit peak is much more prominent and narrower than the Klimit peak and its energy was measured as eV, which corresponds to . (The eV includes a statistical error of eV plus 4 eV of energy calibration error.) This is significantly higher than the (corresponding to eV) expected for CX with N2 using the approximation from Eq. 1. For CX with atomic H, our theoretical calculations (see §5.3) predict that or 13 ( eV), versus 12.3 given by Eq. 1.
The K-series emission lies well below the Lylimit peak in energy and there is no evidence for or reason to expect any significant emission from other elements that would shift the Lylimit centroid in our measurement. Double-electron transfer from N2 is certainly present at some level but, as explained in §5.4, is unlikely to explain the high value of .
5.2 Line Intensities
Fit results are listed in Table 3. Intensity uncertainties are based on counting statistics and sensitivity studies similar to those described in §4.1.2. Some specific variables were the strength of Cr and Ba contaminant lines, and the strength of the Fe XXVI Ly line which blends with the stronger Fe XXV K line. The most important variable is the level of the background, which is assumed to be flat and to arise from particle-induced background in the detector. Even gross changes in the background level, however, have little effect on the fitted Fe line intensities.
| Spectrum | Run or Model | |||||
|---|---|---|---|---|---|---|
| Fe XXV (meas.) | L (20 eV amu-1) | 1 | 0.074(7) | 0.046(5) | 0.199(10) | 0.273(12) |
| IJ (10 eV amu-1) | 1 | 0.069(7) | ||||
| Fe XXVI (meas.) | IJ (20 eV amu-1) | 1 | 0.12(5) | 0.04(4) | 1.04(7) | 1.17(7) |
| Fe XXVI (theory) | 1 eV amu-1 | 1 | 0.17 | 0.06 | 0.38 | 0.55 |
| 10 eV amu-1 | 1 | 0.14 | 0.05 | 0.28 | 0.42 | |
| 100 eV amu-1 | 1 | 0.08 | 0.02 | 0.10 | 0.18 |
Note. — Measurement errors (listed for last digits in parentheses) include both statistical and fitting uncertainties described in the text. Errors for Fe XXVI lines are largely driven by the range of acceptable background levels and by uncertainties in the Fe XXV spectrum. Theoretical CTMC calculations are for CX with atomic H.
As seen in Table 3, the peak dominates the Fe XXV spectrum, in contrast to the strength of the high- Fe XXVI lines. Indeed, the sum of the Lyman lines exceeds the intensity of Ly. As we discuss below, this relatively large hardness ratio indicates that a large fraction of the transferred electrons are captured into low angular momentum states, particularly the states (see §2). For comparison, the hardness ratio assuming statistically populated levels (appropriate at high energies) is 0.02 (Beiersdorfer et al., 2000).
5.3 Comparison with Theory
Detailed theoretical calculations for CX involving molecular targets other than H2 are currently infeasible, and most modeling has been done for CX with atomic H. Experimental measurements of CX spectra of highly charged ions (all with ) and various multi-electron target gases (Greenwood et al., 2001; Beiersdorfer et al., 2003), however, indicate that the major difference when using different neutral gases is some redistribution of intensity among high- lines because of differences in neutral-gas ionization potentials and hence . One might therefore expect that CX spectra using N2 and atomic H should be fairly similar.
To compare with our experimental results we use detailed classical-trajectory Monte Carlo (CTMC) calculations (Perez, Olson, & Beiersdorfer, 2001; Olson, 1981) to model Fe26+ colliding with atomic H at 1, 10, and 100 eV amu-1. A hydrogenic cascade model is then used to predict emitted line intensities, which are listed in Table 3. The predicted hardness ratio is seen to increase as the collision energy decreases. However, even for collision energies well below those in our experiment, one can see that this model predicts a substantially smaller hardness ratio than we measure. For comparison, measured and theoretical Fe XXVI CX spectra are plotted in Figure 3, along with the measured electron impact excitation spectrum at 17.2 keV.
5.4 Molecular Targets versus Atomic Hydrogen
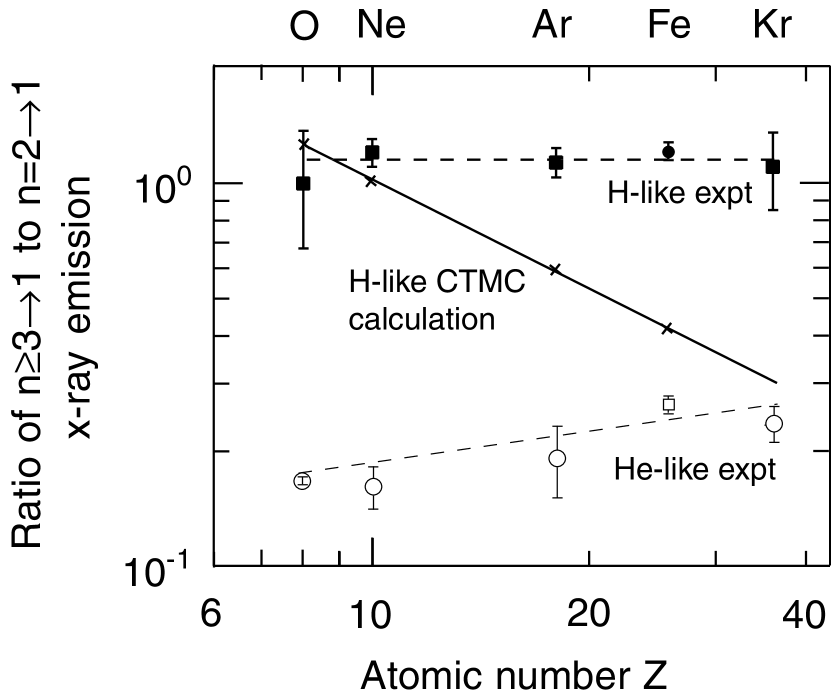
Similar disagreements between experimental and theoretical hardness ratios have been noted for CX of multi-electron targets with other hydrogenic ions with , including Ar, Kr, and Xe (Beiersdorfer et al., 2000), and our present results confirm the trends established in that work, as illustrated in Figure 4. The problem, therefore, must be with the theory we are comparing against, which presents two possibilities: either model predictions of CX with H are wrong for the and collision energies we are using, or those predictions are not applicable because we are not using atomic H as the target.
Theoretical modeling at the low energies involved here is less reliable than at higher energies because of the quasi-molecular states temporarily formed during slow collisions, but CX of a bare ion with H is the simplest CX system to model and errors should be small. Predictions with the CTMC code used here give good agreement with experimental measurements of highly charged ions plus hydrogen, e.g. for Ar17+ + H/D with a collision energy of 13–40 keV amu-1 (Beiersdorfer et al., 2005).
We therefore believe that the second possibility is much more likely. A multi-electron target immediately raises the possibility that multi-electron capture (which we will henceforth assume means double-electron capture) is important. However, the fundamental issue to keep in mind, whether discussing single-electron capture or DEC, is the angular momentum distribution of the captured electron(s). In order to explain the intensity of the high- lines, a large fraction of the radiatively decaying levels must be states that can decay directly to the ground state.
Unfortunately, there are virtually no experimental publications that even roughly match the EBIT parameter space with respect to ion and collision energy, i.e., nearly fully stripped ions with with collision energy 10 eV amu-1. The two main experimental CX regimes are those of electron cyclotron resonance (ECR) sources and heavy-ion storage rings. The former can not create bare ions beyond Ne10+ and generally operate at collision energies of a few to several tens of keV amu-1, and the latter use even higher energies ( MeV amu-1), well above the range of applicability to EBIT results. For various instrumental reasons and because the ions are moving, those experiments usually focus on total CX cross sections and/or recoil-ion momentum or Auger-electron energy spectroscopy. Naturally, theoretical efforts have focused on available experimental data, and are also limited to relatively tractable models of CX with H, He, and H2. Only a small fraction of CX papers of any kind discuss angular-momentum distributions and even fewer present photon emission spectra.
The paper closest to matching our experimental parameters is Martin et al. (1994) which presents data on CX of bare N, O, F, Ne, Na, and Al with various noble gas targets at an energy of about 1 keV amu-1, but does not discuss or include spectra. Edgu-Fry et al. (2004) present results on O8+ + H and H2 at 14 keV amu-1; although there are no spectra, the ‘ value’ plot in their Figure 11 indicates that the angular momentum distribution is different for CX with H and H2. This is illustrated more clearly in their plots for Ar8+, although that ion is far from fully stripped. We suspect that the high- enhancement we observe is simply due to creation of a larger -state population in CX with N2 than in CX with H, and that DEC, while present at some level, is not the key to the high- emission enhancement, as we now explain.
There are many papers that discuss DEC. The one most relevant for us is that by Chesnel et al. (1999), which discusses DEC in NeHe with collision energies from 50 eV amu-1 to 15 keV amu-1, and includes helpful summaries of various DEC-related processes such as autoexcitation (AE), correlated double capture (CDC), correlated transfer and excitation (CTE), and auto-transfer to Rydberg states (ATR). It also presents several conclusions regarding symmetric autoionizing states (with ), asymmetric autoionizing states (with ), and the contributions to radiative stabilization of those states as a function of collision energy.
For doubly-excited Fe24+, a typical symmetric state will be , while and are examples of asymmetric states. Such states can either: 1) autoionize to ground (not interesting here because no photon is emitted), 2) autoionize to a singly excited state resulting in autoionizing double capture (ADC) and the emission of one H-like photon, or 3) radiatively stabilize resulting in true double capture (TDC) and the emission of one 1 He-like satellite of a H-like line and one true He-like line.
In ADC, because continuum levels are more densely populated at lower energies, the retained electron will tend to fall to a level such that the ejected electron has just enough energy to escape. The resulting singly excited state will thus still have a medium value (7, for both symmetric and asymmetric autoionizing initial states), but less than the for SEC (12). Unknown, however, is the typical value and thus what fraction of the ADC radiative decays go directly to ground (from states) and what fraction end up feeding the yrast cascade yielding Ly photons. In the first case, the enhanced medium- emission will blend with the high- peak and broaden it, and also move the centroid to lower energies. We do not see any significant broadening, however, and the peak centroid energy is if anything higher than expected from SEC, which would indicate that the fraction of ADC is fairly small. In the second case, the fraction of Ly emission is enhanced over that for SEC, which is the opposite of the enhanced high- emission we are attempting to explain.
TDC tends to occur from asymmetric autoionizing states (either populated directly during DEC or after auto-transfer from more symmetric states via ATR–this appears to be a matter of some controversy) because configuration interaction between the two widely separated electrons is minimal and they act nearly independently. The first radiative decay, usually from the lower level because radiative rates scale as roughly , produces a He-like satellite line (effectively a H-like line with a high- spectator electron). Like ADC, this enhances either the medium- line emission or Ly.
The second TDC radiative decay results in a He-like photon that originates from a singly excited high- state, often with higher than is the case for SEC. For the same reasons as in the SEC spectrum (because of the selection rule–see §2) the resulting He-like emission will be dominated by emission (i.e., K). The signature of DEC in the He-like spectrum will therefore be very hard to discern, and indeed we see no difference in the run-L (pure SEC) and run-IJ Fe XXV (SEC + DEC) spectra.
To summarize, DEC should either increase the relative intensity of Ly (which is not inconsistent with the observed spectrum but would not explain the large high- peak) or increase the medium- Lyman emission (which would manifest itself as broadening of the high- peak and move its centroid to a lower energy, which is not seen in our measurements). We therefore conclude that DEC is not the source of the high- emission Lyman enhancement. Instead, we believe that CX of high- fully stripped ions yields very different excited-state angular momentum distributions depending on whether the neutral target has one or many electrons, with a much larger fraction of states in the latter case. Measurements utilizing higher-resolution detectors, which we plan to conduct over the next few years, will address this and other questions.
6 CONCLUSIONS
We have presented experimental charge exchange spectra of Fe+26 and Fe+25 interacting with N2 at collision energies of eV amu-1. The resulting H-like and He-like spectra show significant enhancement of high- emission with respect to electron impact excitation spectra. This high- excess is especially pronounced in the Fe XXVI spectrum and, as has been observed in other measurements of moderate- and high- H-like emission at low collision energies, is much stronger than predicted by classical-trajectory Monte Carlo models of CX with atomic H. Our measurements indicate that this is likely because the -distribution of the captured electron(s) depends on whether the neutral target has one or many electrons.
CX emission may be detectable in the Galactic Ridge and Galactic Center, arising from low-energy cosmic rays or highly ionized thermal gas interacting with neutral clouds in the Galactic plane. Two key diagnostics of this emission are: strong enhancement of forbidden and intercombination line emission in the He-like K complex (exemplified by a 19-eV shift in the Fe XXV K blend centroid in our experiment); and enhancement of high- emission in the H-like Lyman spectrum, particularly if the emission is from thermal ions. Line widths can be used to discriminate between cosmic-ray CX (with widths greater than 100 eV FWHM for Fe) and thermal CX (less than 10-eV widths). The XRS microcalorimeter on the just-launched ASTRO-E2 therefore should be able, given sufficiently deep observations, to clearly identify the spectral signatures of CX in diffuse X-ray emission from the Galactic Center and Galactic Ridge, and perhaps in some supernova remnants.
References
- Beiersdorfer et al. (2005) Beiersdorfer, P., Bitter, M., Marion, M., & Olson, R. E. 2005, Phys. Rev. A, in press
- Beiersdorfer et al. (2003) Beiersdorfer, P., et al. 2003, Science, 300, 1558
- Beiersdorfer et al. (2000) Beiersdorfer, P., et al. 2000, Phys. Rev. Lett., 85, 5090
- Beiersdorfer et al. (2001) Beiersdorfer, P., Lisse, C. M., Olson, R. E., Brown, G. V., & Chen, H. 2001, ApJ, 549, L147
- Beiersdorfer et al. (1996b) Beiersdorfer, P., Osterheld, A. L., Decaux, V., & Widmann, K. 1996, Phys. Rev. Lett., 77, 5353
- Beiersdorfer et al. (1996a) Beiersdorfer, P., Schweikhard, L., Crespo López-Urrutia, J., & Widmann, K. 1996, Rev. Sci. Instr., 67, 3818
- Bussard, Ramaty, & Omidvar (1978) Bussard, R. W., Ramaty, R., & Omidvar, K. 1978, ApJ, 220, 353
- Chesnel et al. (1999) Chesnel, J.-Y., et al. 1999, Nucl. Instrum. Meth. Phys. Res. B, 154, 142
- Cravens (2002) Cravens, T. E. 2002, Science, 296, 1042
- Ebisawa et al. (2001) Ebisawa, K., Maeda, Y., Kaneda, H., & Yamauchi, S. 2001, Science, 293, 1633
- Edgu-Fry et al. (2004) Edgu-Fry, E., Wech, A., Stuhlman, J., Lee, T. G., Lin, C. D., & Cocke, C. L. 2004 Phys. Rev. A, 69, 052714
- Erickson (1977) Erickson, G. W. 1977, J. Phys. Chem. Ref. Data, 6, 831
- Freeman, Doe, & Siemiginowska (2001) Freeman, P. E., Doe, S., & Siemiginowska A. 2001, SPIE Proceedings, 4477, 76
- Fulks (1975) Fulks, G. J. 1975, J. Geophys. Res., 80, 1701
- Greenwood et al. (2001) Greenwood, J. B., Williams, I. D., Smith, S. J., & Chutjian, A. 2001, Phys. Rev. A, 63, 062707
- Janev & Winter (1985) Janev, R. K., & Winter, H. 1985, Physics Reports, 117, 265
- Kaneda et al. (1997) Kaneda, H., Makishima, K., Yamauchi, S., Koyama, K., Matsuzaki, K., & Yamasaki, N. Y. 1997, ApJ, 491, 638
- Kharchenko et al. (2003) Kharchenko, V., Rigazio, M., Dalgarno, A., & Krasnopolsky, V. A. 2003, ApJ, 585, L73
- Koyama et al. (1996) Koyama, K., Maeda, Y., Sonobe, T., Takeshima, T., Tanaka, Y., & Yamauchi, S. 1996, PASJ, 48, 249
- Levine et al. (1988) Levine, M. A., Marrs, R. E., Henderson, J. R., Knapp, D. A., & Schneider, M. B. 1988, Phys. Scripta, T22, 157
- Martin et al. (1994) Martin, S., et al. 1994, Phys. Rev. A, 50, 2322
- Masai et al. (2002) Masai, K., Dogiel, V. A., Inoue, H., & Schönfelder, V. 2002, ApJ, 581, 1071
- Mitsuda et al. (2004) Mitsuda, K., Kunieda, H., Inoue, Hajime, & Kelley, R., Proc. SPIE, 5488, 177
- Muno et al. (2004) Muno, M. P., et al. 2004, ApJ, 613, 326
- Olson (1981) Olson, R. E. 1981, Phys. Rev. A, 24, 1726
- Parpia et al. (1996) Parpia, F. A., Fischer, C. F., & Grant, I. P. 1996, Computer Phys. Comm., 94, 249
- Perez, Olson, & Beiersdorfer (2001) Perez, J. A., Olson, R. E., & Beiersdorfer, P. 2001, J. Phys. B, 34, 3063
- Plante, Johnson, & Sapirstein (1994) Plante, D. R., Johnson, W. R., & Sapirstein, J. 1994, Phys. Rev. A, 49, 3519
- Rule & Omidvar (1979) Rule, D. W., & Omidvar, K. 1979, ApJ, 229, 1198
- Ryufuku & Watanabe (1979) Ryufuku, H. & Watanabe, T. 1979, Phys. Rev. A, 20, 1828
- Scofield (1989) Scofield, J. H. 1989, Phys. Rev. A, 40, 3054
- Silk & Steigman (1969) Silk, J., & Steigman, G. 1969, Phys. Rev. Lett., 23, 597
- Smith et al. (2000) Smith, A. J., Beiersdorfer, P., Reed, K. J., Osterheld, A. L., Decaux, V., Widmann, K., & Chen, M. H. 2000, Phys. Rev. A, 62, 012704
- Smith et al. (2005) Smith, R. K., Edgar, R. J., Plucinsky, P. P., Wargelin, B. J., Freeman, P. E., & Biller, B. A. 2005, ApJ, 623,225
- Snowden, Collier, & Kuntz (2004) Snowden, S. L., Collier, M. R., & Kuntz, K. D. 2004, ApJ, 610, 1182
- Tanaka (2002) Tanaka, Y. 2002, A&A, 382, 1052
- Tanaka, Miyaji, & Hasinger (1999) Tanaka, Y., Miyaji, T., & Hasinger, G. 1999, Astron. Nachr., 320, 181
- Tanaka et al. (2000) Tanaka, Y., Koyama, K., Maeda, Y., & Sonobe, T. 2000, PASJ, 52, L25
- Vainshtein & Safronova (1985) Vainshtein, L. A., & Safronova, U. I. 1985, Phys. Scr., 31, 519
- Wargelin et al. (2004) Wargelin, B. J., Markevitch, M., Juda, M., Kharchenko, V., Edgar, R., & Dalgarno, A. 2004, ApJ, 607, 596
- Watson (1976) Watson, W. D. 1976, ApJ, 206, 842
- Wise & Sarazin (1989) Wise, M. W. & Sarazin, C. L. 1989, ApJ, 345, 384
- Wong et al. (1995) Wong, K. L., Beiersdorfer, P., Reed, K. J., & Vogel, D. A. 1995, Phys. Rev. A, 51, 1214