The Opacity of Spiral Galaxy Disks VII:
the accuracy of galaxy counts as an extinction probe
††thanks: Research support by NASA
through grant number HST-AR-08360 from the Space Telescope Science
Institute (STScI), the STScI Discretionary Fund (grant numbers 82206 and 82304)
and the Kapteyn Astronomical Institute of the University of Groningen.
The “Synthetic Field Method” (SFM) was introduced by González et al. (1998) to calibrate numbers of distant galaxies as a probe of extinction in a foreground spiral disk. González et al. (2003) studied the effect of the foreground disk on these numbers using simulations of current and future instruments for fields in the LMC, M31 and NGC 4536, a galaxy in Virgo. They concluded that: (1) the brighter centers of disks were unsuitable, (2) the granularity of the disk at a fixed surface brightness is the limiting factor in the detection of distant galaxies, and (3) the optimum distance for measurements would be that of the Virgo cluster for the current instruments on board HST. At this distance the foreground disk is smoothed with distance, improving detection of distant background galaxies. Holwerda et al. (2005a) automated the SFM and Holwerda et al. (2005b) applied it to a large set of WFPC2 fields. In this paper, the quality of the extinction measurement in these fields is compared to their distance, granularity, surface brightness and structure. The average surface brightness of the of a field is shown to directly influence the accuracy of the SFM. This restricts meaningful measurements to the disks of spiral galaxies. Large structures such as spiral arms have a similar effect. The granularity or small scale structure in a field influences the detection of distant galaxies, limiting the SFM measurements in nearby disks. From the trends in the accuracy and maximum practical field-of-view considerations, the minimum and maximum distance for SFM application, approximately 5 and 35 Mpc respectively. Using the same instrument and detection method, the relations with SFM parameters and field characteristics can be used to forgo the synthetic fields altogether. For the wealth of ACS fields becoming available in the archive, these relations can be used to select those fields based on expected SFM accuracy.
Key Words.:
Methods: data analysis, Methods: observational, Methods: statistical, (ISM:) dust, extinction, Galaxies: ISM, Galaxies: spiral1 Introduction
The number of field galaxies seen through a nearby foreground galaxy has for a long time been recognized as a possible probe into the dust extinction in the foreground object, much in the way star counts are used in our own Galaxy. Hubble (1934) noted a drop of field galaxies at lower Galactic latitude, a fact that was later used by Burstein & Heiles (1982) to map the Galactic extinction based on counts from Shane & Wirtanen (1967).
As number counts are limited by statistics, a measurement over the largest practical solid angle is needed. This prompted several studies of the LMC and SMC (Shapley (1951), Wesselink (1961), Hodge (1974), MacGillivray (1975), Gurwell & Hodge (1990) and Dutra et al. (2001)), the majority on photographic plates. The dust effects in other galaxies were characterised by Zaritsky (1994), Lequeux et al. (1995) and Cuillandre et al. (2001).
However, the detection of field galaxies is not only affected by the absorption in the foreground disk. The crowding and confusion of the foreground disk also play a role. The results of the previous studies suffered from the inability to distinguish real opacity from foreground confusion as the reason for the decrease in field galaxy numbers. Therefore, González et al. (1998) introduced the “Synthetic Field Method” (SFM) to calibrate the number of distant galaxies for crowding and confusion resulting from the foreground disk and applied it to two galaxies. González et al. (2003) and González et al. (2004) explore the limitations of this method imposed by the characteristics of the foreground disk: surface brightness, granularity and large-scale structure.
In recent papers in this series (Holwerda et al. 2005a, b) 111Holwerda et al. (2005a, b) and early versions of Holwerda et al. (2005c, d) and this paper are presented in Holwerda (2005), we have automated the SFM and analysed a large set of fields of spiral galaxies. In this paper we study the limitations of the SFM using this dataset, as it spans a range in foreground disk characteristics.
The organisation of this paper is as follows: in section 2 the SFM is briefly described, section 3 describes the predictions of González et al. (2003) relevant to this paper and section 4 the data from Holwerda et al. (2005b) used. In section 5 we discuss the dependence of the SFM on surface brightness and in section 6 the effects of distance, granularity and structure in the foreground disk. Section 7 discusses the optimum distance for WFPC2 imaging. In section 8 the conclusions are listed and in section 9 the possibilities for future work are reviewed.
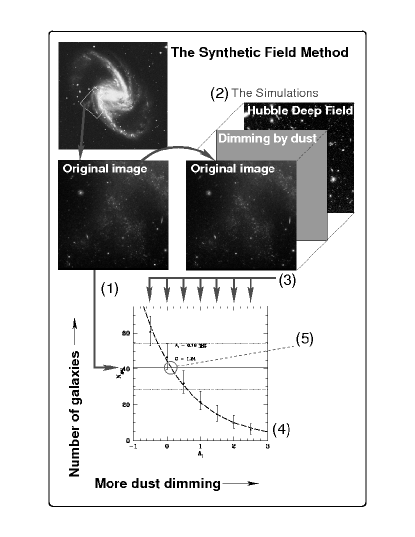
The Synthetic Field Method itself consists of the following steps:
1. The number of distant galaxies in the original science field are counted.
2. The “synthetic fields” are made by combining a dimmed Hubble Deep Field with the science field.
3. The numbers of synthetic galaxies are counted in the synthetic fields.
4. Equation 1 it fitted to the number of synthetic galaxies as a function of the applied dimming.
5. From the intersection between the number galaxies in the science field and the fit, the average dimming in the image is found.
2 The “Synthetic Field Method”
The number of distant galaxies found in a given field in a spiral disk is indicative of the average dust extinction of that field () but it also depends on the crowding and confusion conditions of the field. The “Synthetic Field Method” calibrates the number of distant galaxies found in the science field with a series of synthetic fields (See Figure 1 for a schematic.). These are the original science field with a Hubble Deep Field (North or South) added, which is dimmed to simulate dust extinction. In these synthetic fields, the crowding and confusion effects for the detections of synthetic galaxies are the same for the distant galaxies in the science field. Several synthetic fields are made for each value of the dimming.
Each set of synthetic fields is characterised by the applied dimming and the average number of synthetic galaxies retrieved for this dimming. We fit the following relation to the dimming () of each set and average number of galaxies () retrieved from these sets:
| (1) |
In this relation, is the slope of the relation and the normalization (Figure 2). Replacing N with the number of galaxies from the science field in equation 1 gives us the average extinction in the field due to dust in the foreground disk ().
The normalization () is the number of distant galaxies in the case of no dimming. This value depends on the solid angle over which the measurement is made and the conditions in the field. In the ideal case, the slope is unity () and the distant galaxy number (which can be thought of as a flux) is only reduced due to dimming by dust. However, other factors, such as the surface brightness and the crowding of the foreground field, influence the detection of distant galaxies. For this reason, separate synthetic fields are made and the above relation is fitted for each unique science field.
Uncertainties arise from measurement uncertainties (Poisson statistics) and the natural clustering of field galaxies. The latter uncertainty, due to cosmic variance in the number of distant galaxies in the science field, can be accounted for, as this behaviour is described by the 2-p correlation function. For a more detailed discussion on the uncertainties and systematics, see Holwerda et al. (2005a) and Holwerda (2005).

The effects of adding foreground objects are twofold: the number of field galaxies that can be detected in the field () drops. And secondly, the relation between synthetic galaxies and dimming (equation 1) becomes shallower (), as only brighter galaxies distinguish themselves from foreground objects. Both these effects result in a more inaccurate determination of the average opacity (Figure 2). The normalisation222The actual field behind a foreground disk is uncertain due to the clustering of distant field galaxies. However, is determined from the average of HDF-N/S, a known background which reasonably approximates the average count of galaxies in the sky. Any variations of are therefore the result of addition of the synthetic background to a foreground field. () and the slope () of equation 1, together with the limiting magnitude of the distant galaxies found in the simulations, are our diagnostics for how well a field is suited for the SFM.
3 Predicted limitations using Hubble
The detection of distant field galaxies through a foreground disk depends on three parameters: (1) the surface brightness of that disk, (2) its granularity, and (3) its structure (e.g. spiral arms). González et al. (2003) measured the effects of the foreground disk and instrument resolution on the observable numbers of field galaxies.
They divided each field into sections of pixels. For each section the mean and standard deviation of the pixel-values are determined. The average of these mean values is the indicator of surface brightness of the field, the average of these standard deviations is the measure for granularity in the field and the FWHM of the distribution of mean pixel-values, the indicator of large structure. Data and simulations were analysed for the LMC, M31 and NGC 4536, probing different disk parameters, distances, and instrument resolution. González et al. (2003) parameterised the dependence of distant galaxy detection on distance and resolution as follows:
| (2) |
where and are the flux from the distant galaxy and a typical disk star respectively, the number of stars per pixel, the distance of the foreground disk and the pixel size of various instruments. Whereas González et al. (2003) were interested in varying at three fixed distances, we will explore the effects of varying and (granularity and surface brightness) at fixed .
González et al. (2003) concluded that spiral galaxies at the distance of the Virgo cluster would make much better candidates for the application of the SFM than local group galaxies, and that improvements in resolution would benefit nearby foreground galaxies the most.
4 Comparison data and systematics
Holwerda et al. (2005b) analysed a sample of 32 WFPC2 fields and presented radial opacity plots for both individual galaxies, as well as for the entire sample combined. In addition, the SFM opacity can be measured for each WFPC2 field as a whole333The Planetary Camera part of the WFPC2 array is not used in the SFM analysis. It has different noise characteristics, smaller FOV and fewer reference fields. to characterise the effects of distance of the foreground disk. Surface brightness, granularity and structure are characterized in the same way as González et al. (2003).
There are two possible sources of systematics for this sample of WFPC2 fields: the differences in exposure times and the resampling to 005 pixels using the “drizzle” routine.
The total exposure time of the images could conceivably influence the granularity measure of images if it is the dominant factor in the pixel-to-pixel variations444González et al. (1998) found that any exposure time above 2000 seconds did not limit the SFM measurement. González et al. (2003) concluded that the granularity was the predominant limiting factor. Most fields have exposure times above 2000 seconds (See Table 3 in Holwerda et al. (2005b)).. The weight image from the drizzle routine indicates the relative exposure of pixels in the final drizzled image. We compared the pixel-to-pixel variation or the drizzle- weight image to the total exposure time and found no correlation. The fields can therefore be treated as uniform in noise characteristics in the following.
In order to check the effect of image resolution on the detection of distant galaxies, the SFM analysis needs to be carried out on the same field with different spatial resolutions. Holwerda et al. (2005a) compared the numbers of distant galaxies in undrizzled WF data from González et al. (1998) (1 pixel = 01) with those from their drizzled data (1 pixel = 005) of NGC 4536. The difference in synthetic galaxy numbers can be attributed to a difference between the manual and automated detection methods. As González et al. (2003) predicted, the galaxy statistics were not improved at this distance by smaller pixels. However, as it does facilitate automated classification, our fields were sampled to the 005 scale.
The data from Holwerda et al. (2005b) is sufficiently uniform and the resampling to a smaller pixel scale will not influence the comparison to the prediction of González et al. (2003).

5 The effects of surface brightness
González et al. (2003) briefly illustrated the effect of surface brightness on the SFM’s accuracy in their figure 7, with a radial sequence for a simulation of M31. Holwerda et al. (2005b) presented average radial opacities based on the counts in radial bins, scaled with the (de Vaucouleurs et al. 1991), combined over all fields.
First, the effects of the surface brightness averaged over the entire sample of Holwerda et al. (2005b) are shown per radial annulus. Figure 3 shows the relation between average surface brightness of the radial annuli versus the limiting magnitude () of background galaxy detection, and the slope () and normalization () in equation 1. A brighter foreground field is expected to limit the magnitude at which distant galaxies can be identified, thus limiting the number available for the SFM. If the effect of surface brightness dominates the loss of background galaxies, the extinction becomes a secondary effect, flattening the slope in equation 1.
From Figure 3, it is evident that indeed the surface brightness influences the limiting magnitude and hence the accuracy of the SFM 555The limiting magnitude is estimated in increments of 0.25 mag, hence the discrete values in Figures 3, 4 and 5. In the brightest regions, the limiting magnitude estimate becomes uncertain due to the poor statistics.. Its effect on the normalization () of equation 1 is visible. A tight relation between average surface brightness and the slope () is especially evident.
From the relation between and surface brightness, it is immediately clear that the inner, brighter regions of spiral disks will not ever yield useful opacity measurements. With the effect of surface brightness on and characterized, it is possible to measure opacity without any synthetic fields and derive it directly from the number of field galaxies and the average surface brightness of the science field. However, the detection method and data-type (WFPC2 field) should be kept the same if one is to forgo the synthetic fields completely.
6 The effects on individual WFPC2 fields
In the previous section, the effects of average surface brightness in the radial annuli of the combined fields (Holwerda et al. 2005b) were discussed. To determine the effects of distance and granularity, surface brightness and structure in the individual fields, the opacity for the entire WFPC2 for each foreground galaxy was estimated from equation 1 666In the figure 4 through 7, triangles are measurements of individual WFPC2 fields as opposed to figure 3 in which the squares represent measurements for the combined radial annuli..

6.1 Distance
The effect of distance of the foreground galaxy on the SFM parameters () is plotted in Figure 4. Only the normalization () shows some dependence on distance. As all these points are for the combined WFPC2 array, the solid angle is the same for each point. The rise of with distance is consistent with the prediction of González et al. (2003). The granularity of the foreground disk is expected to drop with distance as the foreground disk is smoothed with distance. This allows more background galaxies to be detected in a field. The slope C is practically constant with distance.
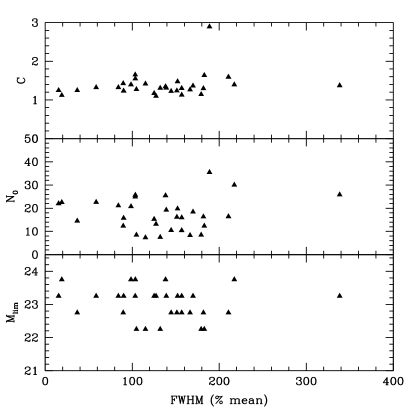
To check that granularity is the cause for this trend with distance, we plot the relations between structure, surface brightness and granularity with distance in Figure 5. Surface brightness is not expected to change with distance, therefore this serves as a check against a systematic selection effect in our fields which could influence the granularity result.
The spread in granularity (i.e. ) does seem to drop with distance while surface brightness and structure (FWHM) do not change much with distance.


6.2 Granularity
Figure 6 shows the direct effect of granularity on the SFM parameters () and the effect of distance on seen in Figure 4 appears due to the granularity effect of smoothing the foreground disk with distance. While a some trend for with distance and granularity can be distinguished, it is not tight enough to forgo a synthetic field to characterize altogether. However, as it is a quick diagnostic, candidate fields can be ranked in order of expected SFM accuracy based on this relation. The relation between normalization and distance (Figure 4) is expected to level out at the number of distant galaxies which are relatively easily identified in the Hubble Deep Fields, about 30 galaxies per square arcminute. Accordingly, at small granularity (), the relation between and granularity (Figure 6), reaches that same number.
A WFPC2 field of a disk beyond 15 Mpc. has a factor 2-3 more identifiable distant galaxies in the reference field than one of a closer disk (, see Figure 4). Therefore, the strategy of Holwerda et al. (2005b) to combine numbers from fields at greater distances maximizes the detection of distant galaxies and hence the accuracy of the method. Increasing solid angle on a single nearby foreground disk has less efficiency than adding solid angle to these, more distant, disks.
6.3 Effects of structure and surface brightness
Structure in a field can be of importance for the application of the SFM. A spiral arm raises the surface brightness and adds to the crowding and confusion. In Figure 7 the relation between the structure (FWHM of the distribution of the mean pixel values of the image sections) and the SFM parameters is shown. Structure shows little effect on the SFM parameters, except for an effect on C similar to the surface brightness. The average surface brightness of the WFPC2 field has little effect on the SFM parameters as most of the flux can be from one section of the field while the SFM measurement is done in another. A spread of surface brightness values over a field will introduce a spread in the relation with in Figure 3.
7 Discussion: Optimum Distance for the SFM
The optimum distance range for the SFM applied on HST imaging (WFPC2 and ACS) is limited by two factors, the solid angle covered by (part of) the foreground disk for which an opacity measurement needs to be made and the granularity of the foreground disk. The granularity imposes a minimum distance, the solid angle a maximum. The solid angle does not only depend on the distance but also on the intrinsic size of the foreground galaxy. In addition to that, not all of the disk is suitable for SFM opacity measurements. We consider M101 as a template face-on spiral galaxy ( kpc., D = 6.7 Mpc) with the inner 25% of that radius unsuitable for SFM measurements due to high surface brightness.
The maximum distance to which the SFM can be used, is determined by the minimal statistics -and hence solid angle- for which a opacity measurement can still be performed. To illustrate this, we assume that the minimal measurement is one magnitude of opacity, measured over the entire disk with an accuracy of mag.
An estimate of the error in the opacity measure needs an expression for the uncertainties in the number of galaxies. One can approximate the error in the number of surviving galaxies in the science field as . This is an overly simplistic but useful analytic approach to the clustering uncertainty. The uncertainty in the numbers of synthetic field galaxies is a simple Poisson uncertainty: . Thus, we get the following expression for the uncertainty in opacity :
| (3) |
Typical SFM parameters for a disk are , , (Figure 4). An opacity of 1 magnitude would result in field galaxies per square arcminute (equation 1). To fulfil the requirement of , we need the disk to cover 3.39 square arcminutes for a meaningful measurement. If we assume that the inner 25 % of the disk is too bright for use, the maximum distance becomes approximately 70 Mpc for a disk the size of M101.
However, M101 is a large galaxy and most galaxies are not that neatly face-on. The effective maximum distance will therefore be much less for a single disk777Many disks could in principle be combined to improve statistics.. Also, a measurement of extinction for the entire disk hardly warrants the effort. For individual galaxies a maximum distance of 35 Mpc should be considered much more practical, allowing for some spatial resolution of opacity in the disk.
The minimum distance also depends on the choice of solid angle of interest, in addition to the effects of granularity. If the measurements are taken over larger solid angles, the loss of distant galaxies due to granularity can be compensated for. The relation between the number of field galaxies without extinction () as a function of distance is shown in Figure 4. The number of field galaxies that can be detected through the disk decreases by a factor 2-3 when the distance drops from around 25 Mpc down to below 10. If we still want to get an opacity measurement similar to the one above () then the minimum solid angle required is square arcminutes.
In order to compensate for the loss due to granularity, a bigger solid angle can be considered, which is possible for a closer disk. However another consideration comes into play: the field-of-view of the instrument. Even with the square arcminutes of the ACS, the maximum surveyed solid angle for a single galaxy is some square arcminutes. (Two recent programs on M101, not covering the whole of the disk). So the biggest solid angle surveyed on a single galaxy to date has about 20 SFM resolution elements in it. A galaxy disk at a shorter distance would require an even bigger investment of observing time. This makes the distance to M101 of 6.7 Mpc the minimum practical distance. This distance can be brought down some by sacrificing some spatial resolution. But the minimal value for in Figure 4 imply marginal results.
A larger solid angle is easier to cover using ground-based observations. As Cuillandre et al. (2001) showed for M31, the confusion between blended foreground stars and background galaxies quickly makes a meaningful measurement impossible, even at some distance from the galaxy center. The imaging standards of the SFM effectively demand space-based optical data.
The prediction from González et al. (2003) that the SFM can only successfully be applied on Virgo cluster spiral galaxies is corroborated by these estimates of minimum and maximum distance. Opacity measurements of Local Group members will indeed be much more difficult.
8 Conclusions
From the uniform application of the “Synthetic Field Method” to a sample
of HST/WFPC2 fields, we draw some conclusions as to the applicability of
this method on HST images of spiral disks:
- 1.
- 2.
- 3.
- 4.
-
5.
The effective minimum distance for the SFM would be of interest as its use on nearby galaxies could give us the most detailed opacity map of a disk. Using reasonable numbers, a minimum distance of 5 Mpc is found from the relations between SFM parameters and distance, due to granularity and FOV considerations.
-
6.
The effect of a foreground disk on the number of distant galaxies can be detected up to some 70 Mpc but the effective maximum distance for any scientific interesting result is about 35 Mpc. This would provide some spatial resolution of the dust extinction.
-
7.
The relation between granularity and SFM accuracy displays still some scatter. Hence a synthetic field to chatacterize the normalisation () may be desirable. However, a quick result can be immediately obtained from the field’s characteristics, surface brightness and granularity and the number of distant galaxies detected, provided detection method and data are similar to this paper’s. These relations should also help in the selection of ACS fields for SFM analysis.
-
8.
Future work with the ACS seems more than feasible, even for the closer disks. The combination of its resolution, sensitivity and field-of-view will likely facilitate measurements. The FOV and speed tips the balance more in favour of nearer objects.
9 Future work
With the SFM proven to function, the number counts for other HST imaging of face-on spiral galaxies could be used for opacity measurements. The Advanced Camera for Surveys has superior field-of-view and sensitivity making its fields of face-on spirals obvious candidates. Currently in the Hubble archive are fields of NGC300, NGC3370, NGC3621, NGC3949, NGC4258, NGC4319 and notably large datasets on M51 and M101. These span a range of distances, NGC3370 near the possible maximum (D = 30 Mpc) and NGC300 below the minimum (D = 2 Mpc). These however are imaged in more photometric bands, improving the field galaxy identification, and the Hubble Ultra-Deep Field (Beckwith et al. 2005) and GOODS fields are candidate reference fields. With this wealth in existing data, the SFM promises to continue to shed light on dust extinction.
Acknowledgements.
The authors would like to thank the anonymous referee for his or her comments. This research has made use of the NASA/IPAC Extragalactic Database, which is operated by the Jet Propulsion Laboratory, California Institute of Technology, under contract with the National Aeronautics and Space Administration (NASA). This work is based on observations with the NASA/ESA Hubble Space Telescope, obtained at the STScI, which is operated by the Association of Universities for Research in Astronomy (AURA), Inc., under NASA contract NAS5-26555. Support for this work was provided by NASA through grant number HST-AR-08360 from STScI. STScI is operated by AURA, Inc., under NASA contract NAS5-26555. We are also grateful for the financial support of the STScI Director s Discretionary Fund (grants 82206 and 82304 to R. J. Allen) and of the Kapteyn Astronomical Institute of the University of Groningen.References
- Beckwith et al. (2005) Beckwith, S. V. W., Caldwell, J., Clampin, M., et al. 2005, ApJ, in preparation
- Burstein & Heiles (1982) Burstein, D. & Heiles, C. 1982, AJ, 87, 1165
- Cuillandre et al. (2001) Cuillandre, J., Lequeux, J., Allen, R. J., Mellier, Y., & Bertin, E. 2001, ApJ, 554, 190
- de Vaucouleurs et al. (1991) de Vaucouleurs, G., de Vaucouleurs, A., Corwin, H. G., et al. 1991, Third Reference Catalogue of Bright Galaxies (Volume 1-3, XII, 2069 pp. 7 figs.. Springer-Verlag Berlin Heidelberg New York)
- Dutra et al. (2001) Dutra, C. M., Bica, E., Clariá, J. J., Piatti, A. E., & Ahumada, A. V. 2001, A&A, 371, 895
- González et al. (1998) González, R. A., Allen, R. J., Dirsch, B., et al. 1998, ApJ, 506, 152
- González et al. (2004) González, R. A., Holwerda, B. W., Loinard, L., Allen, R. J., & Muller, S. 2004, in Nearby Large-Scale Structures & the Zone of Avoidance, ed. A. P. Fairall & P. A. Woudt, (San Francisco:ASP Conf. Ser.), in press
- González et al. (2003) González, R. A., Loinard, L., Allen, R. J., & Muller, S. 2003, AJ, 125, 1182
- Gurwell & Hodge (1990) Gurwell, M. & Hodge, P. 1990, PASP, 102, 849
- Hodge (1974) Hodge, P. W. 1974, ApJ, 192, 21
- Holwerda (2005) Holwerda, B. W. 2005, PhD thesis, University of Groningen, Kapteyn Astronomical Institute, PO Box 800, 9700 AV Groningen, the Netherlands
- Holwerda et al. (2005a) Holwerda, B. W., Gonzalez, R. A., Allen, R. J., & van der Kruit, P. C. 2005a, AJ, 129, 1381
- Holwerda et al. (2005b) Holwerda, B. W., Gonzalez, R. A., Allen, R. J., & van der Kruit, P. C. 2005b, AJ, 129, 1396
- Holwerda et al. (2005c) Holwerda, B. W., Gonzalez, R. A., Allen, R. J., & van der Kruit, P. C. 2005c, A&A accepted.
- Holwerda et al. (2005d) Holwerda, B. W., Gonzalez, R. A., Allen, R. J., & van der Kruit, P. C. 2005d, A&A accepted.
- Hubble (1934) Hubble, E. 1934, ApJ, 79, 8
- Lequeux et al. (1995) Lequeux, J., Dantel-Fort, M., & Fort, B. 1995, A&A, 296, L13+
- MacGillivray (1975) MacGillivray, H. T. 1975, MNRAS, 170, 241
- Shane & Wirtanen (1967) Shane, C. D. & Wirtanen, C. A. 1967, Pub. Lick Obs., 22, 1
- Shapley (1951) Shapley, H. 1951, Proceedings of the National Academy of Science, 37, 133
- Wesselink (1961) Wesselink, A. J. 1961, MNRAS, 122, 503
- Zaritsky (1994) Zaritsky, D. 1994, AJ, 108, 1619