A low level of extragalactic background light
as revealed by -rays from blazars
Abstract
The diffuse extragalactic background light consists of the sum of the starlight emitted by galaxies through the history of the Universe, and it could also have an important contribution from the first stars, which may have formed before galaxy formation began. Direct measurements are difficult and not yet conclusive, owing to the large uncertainties caused by the bright foreground emission associated with zodiacal light[1]. An alternative approach[2, 3, 4, 5] is to study the absorption features imprinted on the -ray spectra of distant extragalactic objects by interactions of those photons with the background light photons[6]. Here we report the discovery of -ray emission from the blazars[7] H 2356309 and 1ES 1101232, at redshifts z=0.165 and z=0.186, respectively. Their unexpectedly hard spectra provide an upper limit on the background light at optical/near-infrared wavelengths that appears to be very close to the lower limit given by the integrated light of resolved galaxies[8]. The background flux at these wavelengths accordingly seems to be strongly dominated by the direct starlight from galaxies, thus excluding a large contribution from other sources – in particular from the first stars formed[9]. This result also indicates that intergalactic space is more transparent to -rays than previously thought.
Max-Planck-Institut für Kernphysik, P.O. Box 103980, D 69029 Heidelberg, Germany
Yerevan Physics Institute, 2 Alikhanian Brothers St., 375036 Yerevan, Armenia
Centre d’Etude Spatiale des Rayonnements, CNRS/UPS, 9 av. du Colonel Roche, BP 4346, F-31029 Toulouse Cedex 4, France
Universität Hamburg, Institut für Experimentalphysik, Luruper Chaussee 149, D 22761 Hamburg, Germany
Institut für Physik, Humboldt-Universität zu Berlin, Newtonstr. 15, D 12489 Berlin, Germany
LUTH, UMR 8102 du CNRS, Observatoire de Paris, Section de Meudon, F-92195 Meudon Cedex, France
University of Durham, Department of Physics, South Road, Durham DH1 3LE, U.K.
Laboratoire Leprince-Ringuet, IN2P3/CNRS, Ecole Polytechnique, F-91128 Palaiseau, France
APC, 11 Place Marcelin Berthelot, F-75231 Paris Cedex 05, France
Dublin Institute for Advanced Studies, 5 Merrion Square, Dublin 2, Ireland
Landessternwarte, Königstuhl, D 69117 Heidelberg, Germany
Laboratoire de Physique Théorique et Astroparticules, IN2P3/CNRS, Université Montpellier II, CC 70, Place Eugène Bataillon, F-34095 Montpellier Cedex 5, France
Laboratoire d’Astrophysique de Grenoble, INSU/CNRS, Université Joseph Fourier, BP 53, F-38041 Grenoble Cedex 9, France
DAPNIA/DSM/CEA, CE Saclay, F-91191 Gif-sur-Yvette, Cedex, France
Unit for Space Physics, North-West University, Potchefstroom 2520, South Africa
Laboratoire de Physique Nucléaire et de Hautes Energies, IN2P3/CNRS, Universités Paris VI & VII, 4 Place Jussieu, F-75252 Paris Cedex 5, France
Institut für Theoretische Physik, Lehrstuhl IV: Weltraum und Astrophysik, Ruhr-Universität Bochum, D 44780 Bochum, Germany
Institute of Particle and Nuclear Physics, Charles University, V Holesovickach 2, 180 00 Prague 8, Czech Republic
University of Namibia, Private Bag 13301, Windhoek, Namibia
European Associated Laboratory for Gamma-Ray Astronomy, jointly supported by CNRS and MPG
The observations were carried out with the High Energy Stereoscopic System[10] (H.E.S.S. ), a system of four imaging atmospheric Cherenkov telescopes operating at energies TeV. These two blazars are at present the most distant sources for which spectra have been measured at these energies (Tab. 1).
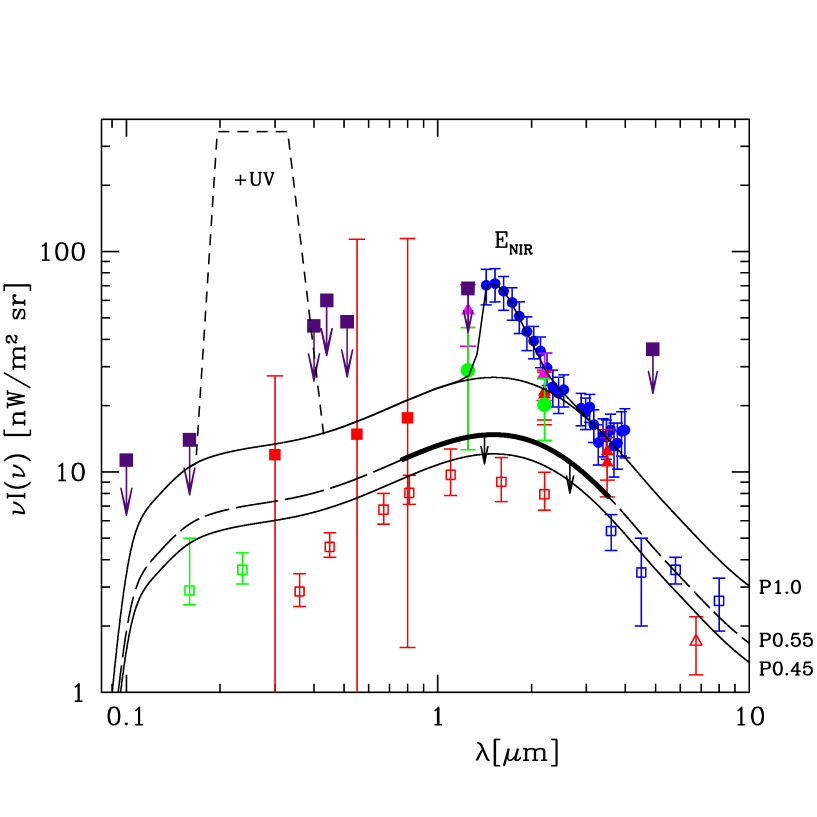
Intergalactic absorption is caused by the process of photon-photon collision and pair production. The original spectrum emitted by the source (which we call “intrinsic”) is modified such that the observed flux , where the optical depth depends on the Spectral Energy Distribution (SED) of the Extragalactic Background Light (EBL) (Fig. 1). Details are provided in the Supplementary Notes and Figures. For any reasonable range of fluxes at ultraviolet (UV) and optical/near-infrared wavelengths (O–NIR), – and thus absorption – is larger at 1 TeV with respect to 0.2 TeV. This difference makes the observed spectrum steeper (that is, , for a power-law model ) The spectral change = scales linearly with the EBL normalization, and becomes more pronounced at larger redshifts. Thus more distant objects provide a more sensitive diagnostic tool.
In general, if the intrinsic spectrum were sufficiently well known, – and thus the EBL SED – could be effectively measured by comparing intrinsic with observed spectra. Blazars, however, are characterized by a wide range of possible spectra, and the present understanding of their radiation processes is not yet complete enough to reliably predict their intrinsic -ray spectra. But for these two sources, with O–NIR fluxes at the level of the “direct” estimates, the intrinsic spectra needed to reproduce the H.E.S.S. data become extremely hard (that is, they have small values of ), at odds with the currently known blazar physics and phenomenology. This can be avoided by reducing the energy dependence of the optical depth, assuming either very low O–NIR fluxes (reducing at 1 TeV) or very high UV–O fluxes (increasing at 0.2 TeV). The latter case, however, would require unreasonably high UV fluxes (as discussed later). We can then derive an upper limit on the EBL by requiring the intrinsic spectrum to be compatible with the present knowledge of blazars.
To determine such a limit, a plausible shape for the EBL SED is assumed. As a reference shape in the 0.1-10 range we adopted the phenomenological curve used in refs[6, 11], which is designed to be in general agreement with the EBL spectrum expected from galaxy emission[12, 13]. This curve, labelled P1.0 in Figs 1 and 2, was originally normalized to match the “direct” estimates at 2.2 and 3.5 (refs[14, 1, 15]). Here we leave its normalization as a free parameter, scaling P1.0 by different factors P (labelled accordingly, the curve scaled by is “P0.45”) down to the lower limit obtained by the resolved galaxy counts[8] (P0.4). To reproduce the excess around 1.5 claimed from the Infrared Telescope in Space (IRTS) data[16] (also argued by ref[17]), an additional ad hoc component was considered, labelled “ENIR”. This feature is not expected from standard galaxy evolution models, and could be the spectral signature of radiation produced in the early universe, for example by the first stars formed (metal-free massive stars, called ‘Population III’; see e.g. refs[9, 18]).
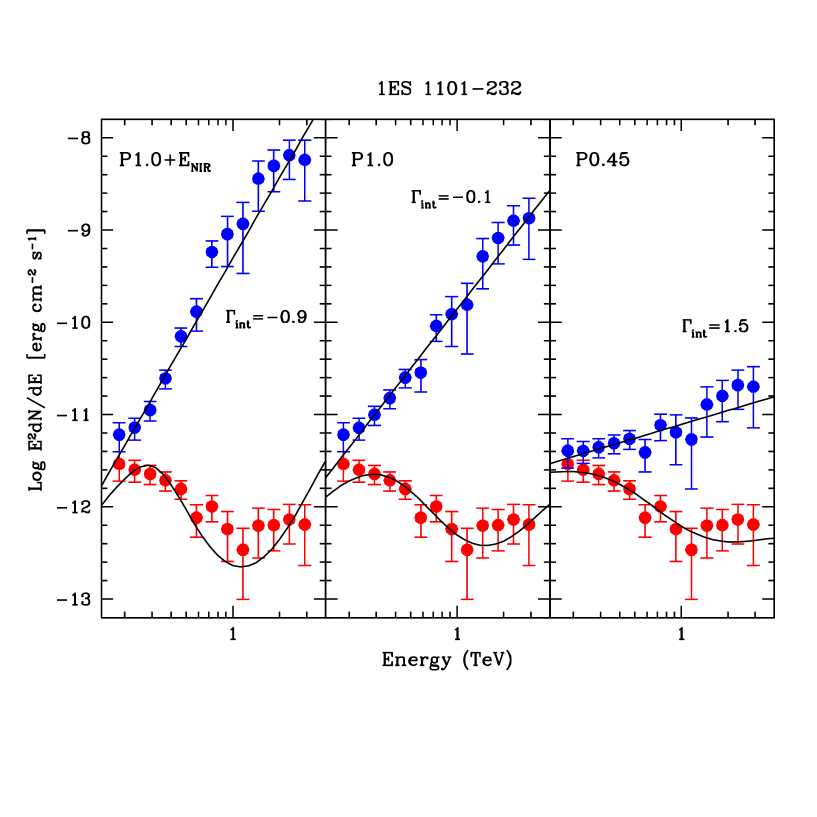
The intrinsic source spectra (Fig. 2) have been reconstructed directly from the observed ones using the assumed EBL, without a priori assumptions on the blazar spectrum. EBL evolution effects (e.g. due to galaxy evolution) were not included: these effects, negligible at low redshifts, become important as redshift increases, but for the range considered here () their impact is still limited to a factor of % (; see Supplementary Information). The reconstructed spectra are generally compatible with a power-law (), but the EBL densities P1.0+ENIR and P1.0 both yield extremely hard photon indices (, see Fig. 2 and Supplementary Fig. SI-2), implying a pile-up or line-like feature in the blazars’ SED around 1–3 TeV. We obtain the same result by considering the NIR excess added to the galaxy counts limits (e.g. P0.4+ENIR, see Supplementary Fig. SI-3). This is because a lower EBL flux only in the UV–O band decreases the absolute values of but increases the contrast between 0.2 and 1 TeV.
Such hard spectra have never been seen in the closest, less absorbed TeV blazars such as Mkn 421 and Mkn 501[19, 20, 21] (, using the same EBL SEDs), and are difficult to explain within the present standard leptonic or hadronic scenarios[6] for blazar emission. In shock acceleration models, the hardest index obtained for the accelerated particles is (see e.g. ref[22]). In the case of protons interacting with ambient plasma, the resulting -ray spectrum has the same slope, . In the case of electrons, the spectrum of the -rays emitted through inverse Compton scattering is expected to be steeper than under most circumstances. Only if radiative cooling is not effective and the blazar Compton emission is wholly within the Thomson limit – unlikely at such high energies – one finds . We thus assume in the following discussion that the true average intrinsic spectrum was not harder than , although later we also address the possibility of harder spectra.
To be compatible with , the EBL flux has to be scaled down to P0.45 to explain both objects’ data, with 1ES 1101232 providing the most stringent constraints thanks to the better statistics at high energies and the larger redshift. With a fixed EBL shape, there is a direct link between the normalization P and . The one-sigma statistical and systematic uncertainties on the H.E.S.S. spectral measurement can then be translated to an equivalent uncertainty on P, (see Supplementary Information).
This limit (P0.45) is robust with respect to a different EBL spectral shape, as long as it maintains an overall maximum around 1–2 . Below 1 , lower fluxes than our template tend to harden the intrinsic spectrum more, while even a flat slope from 1.4 down to 0.1 would soften it by only 0.1. Above 2 , the slope cannot be much flatter than our template – a flatter slope could explain in part the “direct” measurements at 3.5 (Supplementary Fig. SI-4) – because this would again imply a new, very hard component () in the intrinsic spectrum, rising at a few TeV (Supplementary Fig. SI-5). In this respect, this H.E.S.S. dataset gives the same indication as the HEGRA data[11] on H 1426+428 (z=0.129), which show a flattening feature above 1 TeV naturally provided by a starlight EBL between 3 and 10 (SED ).
Therefore, the conservative and self-consistent assumptions of both not unusual blazar spectra () and a galaxy-like EBL spectrum allow the EBL flux around 1–2 to be constrained at the level of nW m-2 sr-1(that is, P1.0). This corresponds to P(0.45+0.1) to allow for galaxy evolution effects. Coupled with the lower limits derived from galaxy counts given by the Hubble Space Telescope[8] (– nW m-2 sr-1), the H.E.S.S. spectra lead to conclude that more than 2/3 of the EBL in the O–NIR band is resolved into single sources. This result is completely independent of any “direct” measurement of the EBL. Remarkably, it is in severe conflict with the claims of high EBL flux at NIR wavelengths[16, 17] and, to a lesser extent, with the reported detections at 2.2 and 3.5 [1, 15]. The H.E.S.S. upper limits agree instead with the most recent theoretical calculations[23] of the EBL, as well as with recent theoretical arguments[24, 25] against high EBL fluxes due to Pop III stars.
This result is also rather insensitive to small changes in the assumed intrinsic slope. A different value, if proved more likely by future results, will shift the limit accordingly, but only strong spectral differences would qualitatively change our conclusion: even a value of would loosen the limit only to P1.0.
Alternative scenarios which could reconcile the measured spectra with high O–NIR fluxes formally exist, and would represent a major discovery in their own right, but we consider them very unlikely, given their exotic implications. Higher UV fluxes would make the intrinsic spectra softer, but the huge values required ( nW m-2 sr-1, see Fig. 1, for example) are not supported by other measurements[1, 26], and could not be accomodated within any reasonable cosmological model.
A more viable alternative is that such hard spectra are a real, new feature of the TeV blazar emission. Possible mechanisms have already been envisaged[6]. For example, the inverse Compton scattering of mono-energetic electrons (, such as cold plasma with very large bulk motion Lorentz factor), interacting in deep Klein-Nishina regime with a narrow-band photon field (such as a Planck-type distribution) may lead to very flat -ray spectra with a sharp pile-up at , reproducing spectra like the ones in Fig. 2. However, such features should become directly visible in the observed spectra of the closer, less absorbed objects of the same type, like the well-studied Mkn 421 and Mkn 501 (if was , they should show ). This is in contrast with observations[19, 20, 21], unless we assume a dependence of the source parameters on redshift such that the corresponding features always disappear due to EBL absorption. It is difficult to justify such a fine-tuning on a relatively small redshift range, although more objects and observations are needed to settle this issue definitively, given the still-limited sample.
Other possibilities include the non-cosmological origin of blazars’ redshifts and the violation of Lorentz invariance (see e.g. ref[27]). However, both scenarios imply dramatic revisions of modern physics and astrophysics, which we do not consider to be justified by these data alone.
A low EBL level, in agreement with the expectations from standard galaxy evolution models, is the simplest and most likely explanation of the H.E.S.S. data.
References
- [1] Hauser, M.G & Dwek, E., The Cosmic Infrared Background: measurements and implications. Ann. Rev. Astron. Astrophys., 39, 249-307 (2001)
- [2] Nikishov, A.I., Absorption of high-energy photons in the universe. Sov. Phys. JETP, 14, 393-394 (1962)
- [3] Gould, R.J. & Schreder, G.P., Opacity of the Universe to High-Energy Photons. Phys. Rev. Lett., 16, 252-254 (1966)
- [4] Jelley, J.V., High-Energy Gamma-Ray Absorption in Space by a 3.5∘K Microwave Field. Phys. Rev. Lett., 16, 479-481 (1966)
- [5] Stecker, F.W., De Jager, O.C., Salamon, M.H., TeV gamma rays from 3C 279 – A possible probe of origin and intergalactic infrared radiation fields. Astrophys. J. Lett., 390, 49-52 (1992)
- [6] Aharonian, F.A., TeV blazars and the Cosmic Infrared Background radiation. Invited, Rapporteur, and Highlight Papers. Proc. 27th ICRC (Hamburg) (ed Schlickeiser R.), p.250-262 (2001), astro-ph/0112314
- [7] Costamante, L. & Ghisellini, G., TeV candidate BL Lac objects. Astron. Astrophys., 384, 56-71 (2002)
- [8] Madau, P. & Pozzetti, L., Deep galaxy counts, extragalactic background light and the stellar baryon budget. Mon. Not. R. Astron. Soc., 312L, 9-15 (2000)
- [9] Santos, M.R., Bromm, V., Kamionkowski, M., The contribution of the first stars to the cosmic infrared background. Mon. Not. R. Astron. Soc., 336, 1082-1092 (2002)
- [10] Aharonian, F.A. et al. H.E.S.S. observations of PKS 2155-304. Astron. Astrophys., 430, 865-875 (2005)
- [11] Aharonian, F.A. et al. Observations of H1426+428 with HEGRA. Observations in 2002 and reanalysis of 1999&2000 data. Astron. Astrophys., 403, 523-528 (2003)
- [12] Primack, J.R., Somerville, R.S., Bullock, J.S., Devriendt, J.E.G., Probing Galaxy Formation with High-Energy Gamma Rays. AIP Conf. Proc., 558, 463-478 (2001)
- [13] Dwek, E. & Krennrich, F., Simultaneous Constraints on the Spectrum of the Extragalactic Background Light and the Intrinsic TeV Spectra of Mkn 421, Mkn 501, and H1426+428. Astrophys. J., 618, 657-674 (2005)
- [14] Dwek, E. & Arendt, R.G., A Tentative Detection of the Cosmic Infrared Background at 3.5 from COBE/DIRBE Observations. Astrophys. J. Lett., 508, 9-12 (1998)
- [15] Wright, E.L., DIRBE minus 2MASS: confirming the cosmic infrared background at 2.2 microns. Astrophys. J., 553, 538-544 (2001)
- [16] Matsumoto, T. et al. Infrared Telescope in Space Observations of the Near-Infrared Extragalactic Background Light. Astrophys. J., 626, 31-43 (2005)
- [17] Cambresy, L., Reach, W.T., Beichman, C.A., Jarrett, T.H., The Cosmic Infrared Background at 1.25 and 2.2 Microns Using DIRBE and 2MASS: A Contribution Not Due to Galaxies? Astrophys. J., 555, 563-571 (2001)
- [18] Kashlinsky, A., Cosmic infrared background and early galaxy evolution. Phys. Rep., 409, 361-438 (2005)
- [19] Aharonian, F. et al. The time averaged TeV energy spectrum of MKN 501 of the extraordinary 1997 outburst as measured with the stereoscopic Cherenkov telescope system of HEGRA. Astron. Astrophys., 349, 11-28 (1999)
- [20] Krennrich, F. et al. Discovery of Spectral Variability of Markarian 421 at TeV Energies. Astrophys. J. Lett., 575, 9-13 (2002)
- [21] Djannati-Atai, A. et al. Very High Energy Gamma-ray spectral properties of MKN 501 from CAT Cherenkov telescope observations in 1997. Astron. Astrophys., 350, 17-24 (1999)
- [22] Malkov, M.A. & O’C Drury, L., Nonlinear theory of diffusive acceleration of particles by shock waves. Rep. Prog. Phys., 64, 429-481 (2001)
- [23] Primack, J.R., Bullock, J.S., Somerville R.S., Observational Gamma-ray Cosmology. AIP Conf. Proc., 745, 23-33 (2005)
- [24] Madau, P. & Silk, J., Population III and the near-infrared background excess. Mon. Not. R. Astron. Soc., 359L, 37-41 (2005)
- [25] Dwek, E., Arendt, R.G., Krennrich, F., The Near Infrared Background: Interplanetary Dust or Primordial Stars? Astrophys. J., 635, 784-794 (2005)
- [26] Bernstein, R.A., Freedman, W.L., Madore, B.F., The First Detections of the Extragalactic Background Light at 3000, 5500, and 8000 Å. I. Results. Astrophys. J., 571, 56-84 (2002)
- [27] Protheroe, R.J. & Meyer, H., An infrared background-TeV gamma-ray crisis? Phys. Lett. B, 493, 1-6 (2000)
- [28] Fazio, G.G. et al. Number Counts at 3 10 from the Spitzer Space Telescope. Astrophys. J.S, 154, 39-43 (2004)
- [29] Totani, T. et al. Diffuse Extragalactic Background Light versus Deep Galaxy Counts in the Subaru Deep Field: Missing Light in the Universe? Astrophys. J., 550L, 137-141 (2001)
- [30] Mattila, K., Has the Optical Extragalactic Background Light Been Detected? Astrophys. J., 591, 119-124 (2003)
Received 25 July 2005, accepted 22 February 2006.
is linked to the online version of the paper at www.nature.com/nature.
The support of the Namibian authorities and of the University of Namibia in facilitating the construction and operation of H.E.S.S. is gratefully acknowledged, as is the support by the German Ministry for Education and Research (BMBF), the Max Planck Society, the French Ministry for Research, the CNRS-IN2P3 and the Astroparticle Interdisciplinary Programme of the CNRS, the U.K. Particle Physics and Astronomy Research Council (PPARC), the IPNP of the Charles University, the South African Department of Science and Technology and National Research Foundation, and by the University of Namibia. We appreciate the excellent work of the technical support staff in Berlin, Durham, Hamburg, Heidelberg, Palaiseau, Paris, Saclay, and in Namibia in the construction and operation of the equipment.
The authors declare that they have no competing financial interests.
and requests for materials should be addressed to L.C. (email: Luigi.Costamante@mpi-hd.mpg.de).
| Source | z | Exp. | Sig. | En. range | N0 | /d.o.f. | |
|---|---|---|---|---|---|---|---|
| (hrs) | () | (TeV) | (cm-2 s-1 TeV-1) | ||||
| 1ES 1101232 | 0.186 | 43 | 12 | 0.16–3.3 | 0.62/11 | ||
| H 2356309 | 0.165 | 40 | 10 | 0.16–1.0 | 0.66/6 |
Supplementary Information
In this paper we have derived an upper limit on the Extragalactic Background Light (EBL) in the optical to near infrared band (O–NIR). This is done by examining the effect of absorption, caused by interaction with EBL in this band, on the -ray spectra of two newly-detected distant blazars: 1ES 1101232 (z=0.186) and H 2356309 (z=0.165). Here we provide additional details on the manner in which EBL absorption modifies the source spectrum, and on the impact on the derived limit of the uncertainties in the -ray measurements and of galaxy evolution effects. We also explain why previous TeV blazar detections did not provide a comparably strong limit, and present supplementary figures to better illustrate the cases described in the paper. At the end, we provide a table with the H.E.S.S. spectral data for the two sources.
1 Supplementary Notes
1.1 EBL absorption
Absorption modifies the intrinsic source spectrum according to . The optical depth is obtained by convolving the EBL photon density distribution with the pair production cross-section , and integrating over the -ray photon path from the source to the observer:
| (1) |
(where is the proper line element,
is already integrated over
angles for an isotropic field of background photons,
and the photon density and energies depend on redshift).
The energy dependence of strongly depends on the spectrum
of the background photons (see e.g. ref[19]). For example, if
(or equivalently the EBL SED ), the optical depth appears
constant with energy, while for
(i.e., ), the optical depth .
Note that in the first case, the observed spectrum simply reproduces
the spectrum emitted by the source, attenuated by a constant factor.
The energy dependence of the optical depth translates to strong
modifications of the source spectrum even with relatively small
differences in , due to the exponential dependence.
For example, given an intrinsic power-law spectrum
,
a difference of only one unit in between 0.2 and 1 TeV
increases the spectral index by .
Figure SI-1 shows the attenuation factor as a function of energy
in four relevant cases (P1.0, P0.4, P0.4+ENIR, P1.0+UV).
For a -ray photon of a given energy ,
because of the threshold effect
(),
only EBL photons of energy above threshold (i.e., )
contribute to the absorption.
Also, because of the relative narrowness of the
cross-section,
for broad-band EBL spectra more than half of the interactions
occur with a narrow interval of target photons
(ref[6,19])
around the cross-section peak, where
(this relation is illustrated on the upper axis in Fig. SI-3 and SI-4,
as a guideline).
Thus, the optical depth at TeV is controlled only by the EBL
fluxes at UV–O wavelengths (below 1 micron),
since NIR photons are below the energy threshold,
while the optical depth at TeV is controlled mainly by the NIR flux.
The UV–O band has a more limited impact
on TeV photons since the interactions occur far from the cross-section peak.
An increase or decrease of the UV–O flux alone
changes the optical depth at 0.2 TeV much more than at 1 TeV.
Therefore, it is possible to reduce
the energy dependence of the optical depth (and thus to avoid the hard reconstructed spectra)
by assuming either very low O–NIR fluxes (reducing at TeV energies)
or very high UV–O fluxes (increasing at sub-TeV energies;
e.g., see Fig. SI-1, right panel).
1.2 Comparison with earlier observations
These two new objects provide significantly stronger constraints on the EBL than any previous TeV blazar because of a favourable combination of hard observed spectrum and relatively high redshift. For sources at smaller redshifts is smaller, while at the same redshift a softer spectrum can be misinterpreted as a hard spectrum which has been more heavily absorbed. Both cases allow the EBL to have a wider range of possible fluxes without yielding implausible values in the reconstructed blazar spectrum. This is the reason why the TeV spectra of the two previous most distant objects, 1ES 1426+428 [11] (z=0.129, ) and PKS 2155304 [10] (z=0.116, ), did not provide such strong constraints as these two new sources, even when measured with much higher signal-to-noise ratio (PKS 2155304). The intrinsic spectra of H 1426+428 and PKS 2155304 start to become very hard () for EBL fluxes around P1.0+ENIR and above.
1.3 Statistical and systematics errors
The determination of an EBL limit from gamma-ray spectra needs to take into account the statistical and systematic errors of the spectral determination, which amount for these data – at the 1 level – to and 0.1, respectively. In addition, the absolute energy scale of Cherenkov telescopes is only determined to %. The EBL limit can be different, therefore, because for example the true blazar spectrum can be softer than the H.E.S.S. value, and the photon energies lower. Using the same limit on the intrinsic spectrum, these errors can be translated into an equivalent uncertainty for the scaling factor P: namely, by finding the values for which , and shifting the bin energies %. For the 1ES 1101232 spectrum, which provides the most stringent constraints, the errors in translate to (the relation is linear, and is approximately ), and the energy scale error into . All three contributions ( statistical, systematic, % energy scale uncertainty) combined yield .
1.4 Galaxy evolution effects
In the calculation of the optical depth, we have not included the effects of galaxy evolution between = and to 0.186. That is, we assume a constant (rather than decreasing with redshift) EBL co-moving energy density. This corresponds to the assumption that all the background photons seen today were already in place at the source redshift. To estimate the impact of this approximation in the redshift range considered here, we used the model by Primack [12] in 2001, interpolating a set of EBL SEDs as a function of redshift (kindly provided by the authors). Including galaxy evolution, the intrinsic spectra become softer than without evolution, thus loosening the limit on the scaling factor P by less than 0.1. Note, however, that this effect can still be safely ignored when testing scenarios where the EBL is dominated by additional radiation produced in the early universe (for which our assumption fully holds).
![[Uncaptioned image]](/html/astro-ph/0508073/assets/x3.png)
![[Uncaptioned image]](/html/astro-ph/0508073/assets/x4.png)
Attenuation factor for the redshift of 1ES 1101-232 (z=0.186), assuming different EBL SEDs. Left panel: P1.0, P0.4, P0.4 with ENIR added on (Fig. SI-3). Right panel: P1.0 and P1.0+UV. These curves would correspond to the observed TeV spectrum for a source with a flat power-law emission spectrum (e.g., for a source spectral energy distribution with ). Above 0.2 TeV, the increase of with steepens the spectrum, up to –. Left panel: the thick lines (corresponding to P0.4, P1.0) show how an increase of the EBL normalization steepens the – spectrum. The dashed line (P0.4+ENIR) shows how the addition of a NIR excess around dramatically steepens the spectrum, due to the increase of for – photons, while photons at – remain unaffected. Above 2 TeV, the absorption curve corresponding to P0.4+ENIR even hardens with energy since P0.4+ENIR is characterized by a slope steeper than between 2 and 6 . The right panel shows how an increase in the UV flux reduces the energy dependence of the optical depth, at the price of a higher attenuation overall.
![[Uncaptioned image]](/html/astro-ph/0508073/assets/x5.png)
The H.E.S.S. time-averaged spectrum of H 2356309 (green), and the absorption-corrected data (blue) with the same EBL SEDs as for 1ES 1101232 (Fig. 1 and 2). The data points and the 99% upper limit are at the average photon energy for each bin, also used to calculate the optical depth for reconstruction. Error bars are 1 statistical errors. The lines show the best-fit power laws to the reconstructed spectrum (), and the corresponding shapes including absorption. The /d.o.f. are (from left to right): 1.94/6, 0.86/6, 0.59/6.
![[Uncaptioned image]](/html/astro-ph/0508073/assets/x6.png)
![[Uncaptioned image]](/html/astro-ph/0508073/assets/x7.png)
Effect of the NIR excess onto the galaxy counts limits. Left: EBL SED with the same data as Fig. 1. The full line shows the EBL shape with the NIR excess added on to P0.4, while the right panel shows the corresponding absorption-corrected -ray spectrum for 1ES 1101232. Also, for this EBL SED, the intrinsic spectrum is extremely hard ( between 0.1 and 2 TeV), with a very sharp rise between 0.3 and 1.5 TeV where the intrinsic slope becomes as hard as . This is due to the strong difference in optical depths at these two energies, because the gamma-ray photons below 0.3 TeV are insensitive to the NIR excess (since they are below the energy threshold for the process), whereas photons are fully affected since the interaction takes place near the peak of the cross-section. The exclusion of the the IRTS data points between 1.4 and 2.2 (dashed line) is not enough to avoid very hard spectra (): significantly lower NIR fluxes are needed, as described in the main text. We note that ref[25] argues that the shape of the NIR excess between 1 and 4 is almost identical to the spectrum of the zodiacal light, and could therefore be of local instead of extragalactic origin.
![[Uncaptioned image]](/html/astro-ph/0508073/assets/x8.png)
Effect of modifications to the EBL SED in the UV and IR bands, for the same data as Fig. SI-2. The short dashed line shows the additional UV component needed by P1.0 to soften the intrinsic spectrum down to , as shown in Fig. SI-2. This is the most energetically-economic solution, limited to the narrow range – to have the maximum effect on the -ray spectrum with the minimum UV flux and overall attenuation. The inclusion of ENIR would require even higher UV fluxes, in the case of both P1.0+ENIR and P0.4+ENIR. Above 2 , a slope much flatter than our template (e.g. +IR, dot-dashed line) is not supported by either the H.E.S.S. (see Fig. SI-5) or HEGRA results [11], which instead suggest an EBL spectrum around . If this is the case, it would constrain the EBL to be near the recent Spitzer source counts [28], meaning that we are close to resolving the diffuse background also up to .
![[Uncaptioned image]](/html/astro-ph/0508073/assets/x9.png)
The H.E.S.S. spectrum of 1ES 1101232, corrected for absorption with the EBL SED shown in Fig. SI-4. The P1.0UV panel shows the spectral softening given by the additional UV component, at the price of increased energetic requirements: the intrinsic TeV flux would be 3 orders of magnitude higher than that observed, and – orders of magnitude above the blazar synchrotron peak, as indicated by simultaneous X-ray data (Aharonian et al. 2006, in preparation). The P0.55+IR panel shows the hardening given by an EBL spectrum above 2 which is flatter than our template (Fig. SI-4, dot-dashed line).
| Energy Bins | 1ES 1101-232 | H 2356-309 | |||
|---|---|---|---|---|---|
| Elow Ehigh | Eavg | Eavg | |||
| TeV | TeV | cm-2s-1TeV-1 | TeV | cm-2s-1TeV-1 | |
| 0.165 0.208 | 0.184 | 5.38 1.88 | 0.184 | 4.58 1.34 | |
| 0.208 0.262 | 0.232 | 2.93 0.78 | 0.232 | 3.08 0.66 | |
| 0.262 0.329 | 0.292 | 1.67 0.39 | 0.292 | 1.37 0.33 | |
| 0.329 0.414 | 0.367 | 9.00 2.08 | 0.367 | 5.40 1.57 | |
| 0.414 0.522 | 0.462 | 4.57 1.04 | 0.462 | 4.60 0.94 | |
| 0.522 0.657 | 0.582 | 1.41 0.54 | 0.582 | 1.54 0.52 | |
| 0.657 0.827 | 0.733 | 1.17 0.37 | 0.732 | 5.94 2.96 | |
| 0.827 1.041 | 0.922 | 4.22 2.34 | 0.921 | 3.64 1.89 | |
| 1.041 1.311 | 1.161 | 1.59 1.13 | |||
| 1.311 1.650 | 1.462 | 1.83 1.02 | 1.572 | 5.03 | |
| 1.650 2.077 | 1.840 | 1.17 0.56 | |||
| 2.077 2.615 | 2.316 | 8.49 3.87 | |||
| 2.615 3.292 | 2.916 | 4.73 3.03 | |||