1-4
The Faint End of the HI Mass Function
Abstract
We study the faint end of the HI mass function (HIMF) in order to test the predictions of the CDM theory on the number density of objects with small (dark) masses. The neutral hydrogen is much better tracer of the underlying mass distribution compared to the luminous matter and can be used to test the existence of a population of small galaxies in which the star formation has been partially or completely suppressed during cosmic evolution. Due to technical limitations, the existing HI surveys are not very sensitive to HI masses below 108 . We designed a blind HI survey to be sensitive to objects with small HI masses. The surveyed area is in the Canis Venatici groups of galaxies and covers in total 86 deg2 of sky, with observed velocities in the range km s-1. We detected 69 objects, 22 of them for the first time in HI. All new HI detections fall in the lower part of the mass-histogram, confirming our ability to detect galaxies with small HI masses. The calculated HIMF is flat in the faint end regime ( -1), different from the steep rise predicted by CDM models. Possible effects of the environment on the estimated HIMF parameters are discussed.
keywords:
galaxies:luminosity function, mass function; radio lines: galaxies; surveys1 Motivation
Some works that address the discrepancy between the number of the observed dwarf galaxies in the optical and the number of those galaxies predicted by CDM models, suggest that small galaxies contain relatively less luminous matter than larger galaxies (e.g. [Verde, Oh, & Jimenez 2002, Verde, Oh & Jimenez 2002]). If that is the case, a fraction of galaxies with dark matter haloes of mass below 109 - 1010 may never form stars and instead they will remain dark. Neutral hydrogen, if still within these systems, would be a much better tracer of dark galaxies. If one assumes that HI makes up a few percent of the total mass of a galaxy, dark galaxies would contain HI in the range 107 - 108 or less. The surveys carried out in HI have poor statistics for objects with masses below 108 . Moreover, all HI objects detected on extragalactic scales have an optical counterpart and have masses above 107 [Briggs (2004), (Briggs 2004)]. On the other hand, there is a population of recently discovered compact HI clouds (CHVCs) around the Milky Way and M31 [de Heij et al.(2002), (de Heij et al. 2002)]. The CHVCs have HI masses below 106 and none of them has an optical counterpart. The gap in the observed HI masses between 106 - 107 is due to technical limitation of existing surveys. The existing HI information is not sufficient in the range of HI masses predicted in these galaxies with little or no stars. There is obviously a need for an HI survey in which the galaxies with HI masses below 108 are a significant fraction of all detections.
2 The CVn blind survey
We designed an HI survey which is extremely sensitive for objects with HI masses below 108 . The main difficulty for the HI observations are the long integration times. To be able to detect a statistically meaningful sample of objects with low HI masses in a reasonable amount of time, we have chosen to observe in a slightly over-dense region instead of surveying the field. The Canis Venatici (CVn) groups of galaxies are an excellent region for this purpose. The CVn galaxies extend along the line of sight up to a distance determined by km s-1. This region contains a large number of the dwarf galaxies, rich in HI, as detected in the previous surveys (in the optical by [Binggeli et al.1990, Binggeli et al. 1990], in the HI by [Kraan-Korteweg et al.1999, Kraan-Korteweg et al. 1999]).
For the survey, we observed 60 12 hr using the Westerbork Synthesis Radio Telescope (WSRT) in mosaic mode. The observed area on the sky is 86 deg2. It is covered by observing 60 strips of different declination, separated by 15 arcmin. Each strip of constant declination has 24 pointings separated by 15 arcmin in Right Ascension. The total integration time per pointing was 80.1 min. Only data with km s-1 were used in further data reduction and analysis process. Given that the size of the WSRT primary beam is 34 arcmin, we obtained nearly uniform sensitivity over the whole observed area. This makes the CVn survey extremely suitable to detect objects with small HI masses.
The data were calibrated and analysed using scripts written by Oosterloo and Kovac̆ based on the the MIRIAD ([Sault et al.1995, Sault at al. 1995]) routines. The output of this process is 1400 3-dimensional data-cubes, each cube being created by extracting the central part of the combined 9 nearest pointings. The spatial resolution of the data-cubes produced is 30 60 arcsec. The velocity resolution is 33 km s-1. The noise in the cubes is just below 0.9 mJy Beam-1. The data-cubes were automatically searched for signal, using algorithms implemented by Kovac̆. The performance of the algorithms has been tested by inserting simulated objects into the real data-cubes. The HI mass of the detections was estimated using , where is the distance to the object in Mpc, is the flux in mJy integrated over the velocity range with significant detection, and the width of the channels is given in km s-1.

We used the minimum detectable integrated flux to estimate the maximum distance up to which the object with a certain HI mass can be detected in our survey. Using the real and the simulated detections we calculated that is the minimum detectable integrated flux to classify a detection in our survey as a real object. The minimum HI mass which an object must have to be detected in our survey is then given by . Objects with HI masses 106 can be detected up to a distance 4.6 Mpc and with HI masses 107 up to 14.6 Mpc.
In total, we detect 69 objects with HI emission. The cross-correlation with objects from the existing catalogues has been done using the astronomical data bases NED (http://nedwww.ipac.caltech.edu) and HyperLeda (http://leda.univ-lyon1.fr). We found that 4 of our HI detections have not been previously catalogued and 1 object does not have an optical counterpart. The last detection is most probably a tidal satellite. It is important to point out that 22 of our 69 detections have not been previously detected in HI. The number distribution of detections per HI mass bin is shown in Figure 1.
At this moment the largest uncertainty in the estimated HI masses of the detected objects is their distance. We obtained the distances by measuring recessional velocities and correcting them for the motion of the Sun in the Galaxy, motion of the Galaxy in the Local group and for the infall of the Local Group towards Virgo, using the infall velocity of the Local Group according to [Theureau et al.(1998), Theureau et al. (1998)].
3 The HI Mass Function
The HI mass function (HIMF) is defined analogously to the optical luminosity function, so one can use identical methods for its derivation. We used the method introduced by [Schmidt (1986), Schmidt (1986)]. This method consists of summing reciprocal values of the maximum surveyed volume in which the objects of a certain HI mass can be detected.
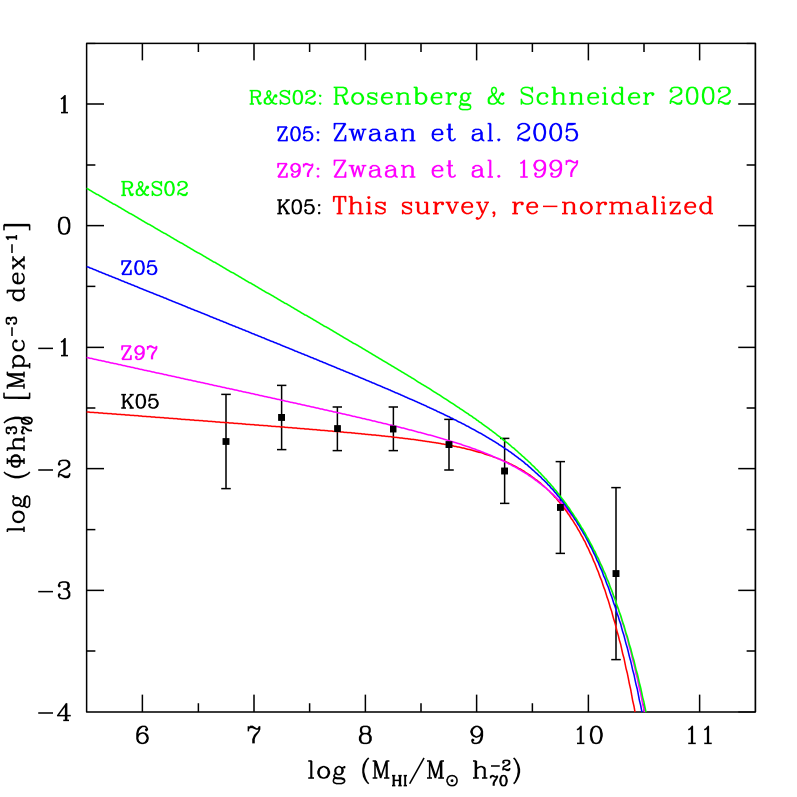
We fitted the binned data with a Schechter function. The best-fit values are , and Mpc-3. The calculated HIMF is presented in Figure 2. In the left panel of Figure 2, the HIMF from this survey is re-normalized to match the the high mass end of the HIMF derived from three recent blind HI surveys. The real number density of the HI objects is 20 higher than plotted. For the surveyed volume, the number density of the objects with HI masses spanning decades (107 - 109 in ) is approximately constant. This result is not consistent with the slopes of the HIMF as found by [Zwaan et al.2005, Zwaan et al (2005)] and [Rosenberg & Schneider (2002), Rosenberg & Schneider (2002)]. The disagreement is even larger when comparing this slope to the analytically derived slope -1.8 of the low mass end of the CDM mass function [Press & Schechter 1974, (Press & Schechter 1974)].
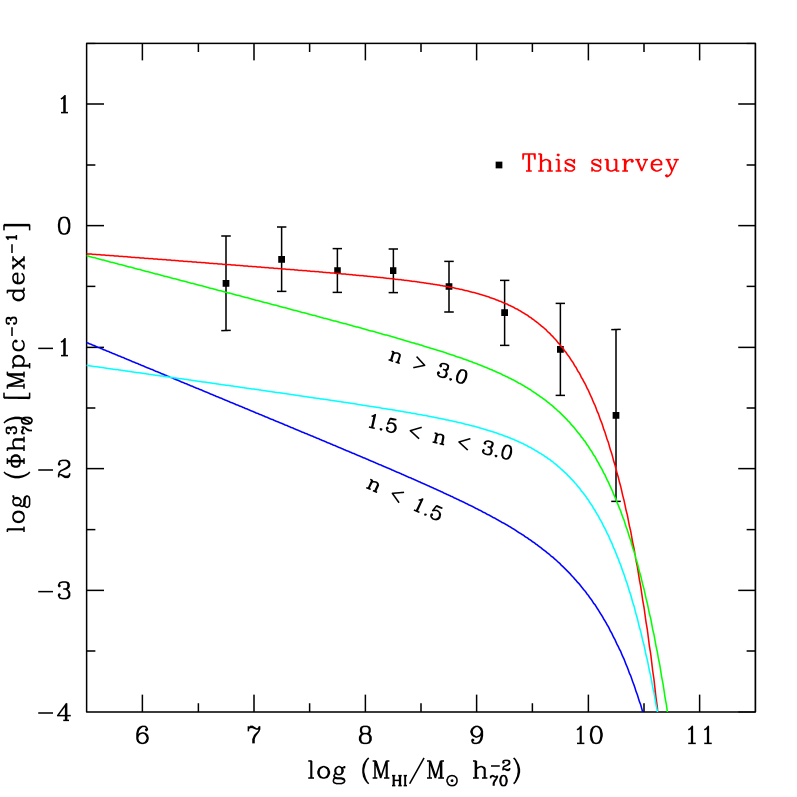
Recently, a lot of effort has been spent to explain the effect of environment on the properties of galaxies and their distributions. The HI surveys cover a much smaller area than the optical surveys. The only way to study the environmental effects on the HIMF is by direct comparison of the estimated HIMF from the surveys carried out in different environments (clusters, groups, voids). The main conclusion from this comparison is that HI galaxies detected in a denser environment have HIMF characterised with the flatter end compared to the HIMF derived from the field. [Springob et al.2005, Springob et al. (2005)] investigated the HIMF of optically selected HI galaxies. Their sample was large enough to investigate the dependence of the HIMF on the environment. Since their subsamples of galaxies in regions of different densities had the same fractions of morphological types, the difference in the derived HIMF must be due to the density of the environment. Although the results obtained had statistically small differences, the conclusion was that the HIMF in the higher-density region shows a flattening in the faint end and lower values of . Thus, the result of the HIMF from our survey is in agreement with this finding (Figure 2, right panel).
Acknowledgements.
The Westerbork Synthesis Radio Telescope is operated by the ASTRON (Netherlands Foundation for Research in Astronomy) with support from the Netherlands Foundation for Scientific Research (NWO). K.K. is grateful to the IAU for the travel grant to attend this conference.References
- [Binggeli et al.1990] Binggeli, B., Tarenghi, M. & Sandage A. 1990, A&A 228, 42
- [Briggs (2004)] Briggs, F.H. 2004, IAUS 217, 26
- [de Heij et al.(2002)] de Heij, V., Braun, R. & Burton, W.B. 2002, A&A 392, 417
- [Kraan-Korteweg et al.1999] Kraan-Korteweg, R.C., van Driel, W., Briggs, F., Binggeli, B., Mostefaoui, T. I. 1999, A&AS 135, 255
- [Press & Schechter 1974] Press, W.H. & Schechter, P. 1974, ApJ 187, 425
- [Rosenberg & Schneider (2002)] Rosenberg, J.L. & Schneider, S.E. 2002, ApJ 567, 247
- [Sault et al.1995] Sault, R.J., Teuben, P.J. & Wright, M.C.H. 1995, in:ASP Conf.Ser. 77: Astronomical Data Analysis Software and Systems IV. ,433
- [Schmidt (1986)] Schmidt, M. 1986, ApJ 151, 393
- [Springob et al.2005] Springob, C.M., Haynes, M.P. & Giovanelli, R. 2005, ApJ 621,215
- [Theureau et al.(1998)] Theureau, G., Rauzy, S., Bottinelli, L. & Gouguenheim, L. 1998, A&A 340, 21
- [Verde, Oh, & Jimenez 2002] Verde, L., Oh, S.P. & Jimenez, R. 2002, MNRAS 336, 541
- [Zwaan et al.1997] Zwaan, M.A., Briggs, F. H., Sprayberry, D. & Sorar, E. 1997, ApJ 490, 173
- [Zwaan et al.2005] Zwaan, M.A., Meyer, M.J., Staveley-Smith, L. & Webster, R.L. 2005, MNRAS 359 L30
Karachentsev About 50 of the area surveyed by you lies within the Arecibo zone. This area will be surveyed soon with much deeper detection limit. It would be reasonable to shift your strip of survey at higher declination, i.e. outside the Arecibo zone.