Detection of neutral hydrogen in early-type dwarf galaxies of the Sculptor Group
Abstract
We present our results of deep 21 cm neutral hydrogen (Hi) line observations of five early and mixed-type dwarf galaxies in the nearby Sculptor group using the ATNF 64m Parkes111The Parkes telescope and the Australia Telescope Compact Array are part of the Australia Telescope which is funded by the Commonwealth of Australia for operation as a National Facility managed by CSIRO. Radio Telescope. Four of these objects, ESO294-G010, ESO410-G005, ESO540-G030, and ESO540-G032, were detected in Hi with neutral hydrogen masses in the range of M⊙ ( = 0.08, 0.13, 0.16, and 0.18 , respectively). These Hi masses are consistent with the gas mass expected from stellar outflows over a large period of time. Higher spatial resolution Hi data from the Australia Telescope Compact Array11footnotemark: 1 interferometer were further analysed to measure more accurate positions and the distribution of the Hi gas. In the cases of dwarfs ESO294-G010 and ESO540-G030, we find significant offsets of 290 pc and 460 pc, respectively, between the position of the Hi peak flux and the center of the stellar component. These offsets are likely to have internal cause such as the winds from star-forming regions. The fifth object, the spatially isolated dwarf elliptical Scl-dE1, remains undetected at our limit of 22.5 mJy km s-1 and thus must contain less than M⊙ of neutral hydrogen. This leaves Scl-dE1 as the only Sculptor group galaxy known where no interstellar medium has been found to date. The object joins a list of similar systems including the Local Group dwarfs Tucana and Cetus that do not fit into the global picture of the morphology-density relation where gas-rich dwarf irregulars are in relative isolation and gas-deficient dwarf ellipticals are satellites of more luminous galaxies.
1 Introduction
Dwarf galaxies are at the center of a long debated galaxy evolution puzzle. Detailed studies of Local Group dwarfs have found increasing evidence that the specific morphological type of any particular dwarf is strongly correlated with the density of its local environment (i.e. the morphology-density realtion Einasto et al., 1974; van den Bergh, 1994): late-type dwarfs (mainly the dwarf irregulars, dIrr) tend to be further away from more massive and more luminous stellar systems than dwarf elliptical galaxies (dEs, including dwarf S0s, dS0, and dwarf spheroidals, dSph). These two main dwarf types differ in many other ways. In general, early-types, with their smooth ellipsoidal stellar distribution, lack an interstellar medium (ISM), possess low angular momentum (although see Geha et al., 2003, for a discussion on the luminous dEs), and have low current star formation rates (e.g. Mateo, 1998). In contrast, the late-types exhibit an irregular optical appearance that is dominated by Hii regions and ongoing star formation, large neutral hydrogen mass to luminosity ratios (e.g. Koribalski et al., 2004), and higher angular momentum.
Morphologically, there is no clear boundary between the two main dwarf types, dIrr and dE. Instead, there exist mixed-type dwarfs (dIrr/dE, e.g. Phoenix) which exhibit properties inherent to both categories. Furthermore, detailed stellar population studies of Local Group dwarfs have revealed that dEs do not have simple single-burst, old stellar populations like globular clusters, but instead show a large variety of star formation histories (e.g. Grebel 2001; Hensler et al. 2004).
The morphology-density relation and the continuous range in stellar/gas properties across dwarf galaxy families naturally suggests that evolution from one main morphological class to the other might be an ongoing process that is still observable in the local Universe. Environmentally driven physical processes such as ram pressure stripping (Einasto et al., 1974) and/or tidal effects (Moore et al., 1996), or internal processes like stellar winds and supernovae explosions combined with the shallow gravitational potential of the galaxy could be responsible for a fast morphological transformation. In such a scenario, the mixed type dwarfs are thought to be in the transition phase from dIrr to a dE stage. While theoretically supported by numerical simulations (Mayer et al., 2001), Grebel et al. (2003) argued against this evolutionary scenario with two major objections: firstly, the fading of a dIrr to the typical luminosity of a dE would produce an object with too low metallicity than what is observed and, secondly, the removal of the ISM from a dIrr would not produce a non-rotating dE (see also Read & Gilmore, 2005). However, one should note that the absence of angular momentum is no longer considered as a defining element of the dE class since rotation was measured in some of the bright dEs (e.g. van Zee et al., 2004; De Rijcke et al., 2004, 2003; Pedraz et al., 2002; Simien & Prugniel, 2002).
The limitation of the morphological classification is that it merely describes the stellar distribution of a galaxy and conveys little physical information on the objects. This classification scheme gives, at best, an imprecise view of the stellar population (i.e. it can not distinguish between a 1 Gyr and 15 Gyr old population) and conveys no information on the total mass, internal kinematics, or chemical composition. Yet, studies of Local Group dEs helped to establish empirical relations between morphology and physical parameters such as the morphology-density relation, but have failed to establish a direct quantitative correlation based on solid physical principles. Consequently, it is difficult to understand the relation between individual galaxy types and their respective evolutionary state. In fact, the properties of dwarf galaxies in the Local Group paint a rather complex picture. For example, the spatially isolated, mixed morphology galaxy LGS3 is dominated by an old stellar population but has had sustained star formation for most of its life (Aparicio et al. 1997; Miller et al. 2001). It also contains 6105 M⊙ of Hi centered on the optical component of the galaxy (Young & Lo, 1997). The slightly less isolated Phoenix dwarf, also of mixed morphology, has a M⊙ Hi cloud that is offset by 650 pc (a third of the tidal radii, Martínez-Delgado et al. 1999) from the optical center (St-Germain et al., 1999) while also having a predominantly old stellar population but sustained, long term star formation (Holtzman et al., 2000). The similarly isolated Tucana dwarf has had no extended star formation (e.g. Da Costa, 1998) and contains no Hi within its optical boundaries. There is, however, a hydrogen cloud projected on the sky near the galaxy, which might be related (see Oosterloo et al., 1996). Further, the Local Group dSph Sculptor apparently possesses two Hi clouds distributed symmetrically on either side of the optical center (Knapp et al. 1978; Carignan et al. 1998; Bouchard et al. 2003). The central regions (within core radii or 230 pc) are, however, gas free and the galaxy itself contains only very old stars ( 10 Gyr) with no evidence of any ongoing star formation (Hurley-Keller et al. 1999; Monkiewicz et al. 1999).
Due to this rather complex picture drawn from Local Group dwarfs, one needs to study a larger sample of galaxies — therefore beyond the Local Group — to establish a quantitative measure of the environmental influence on a dwarf system and to put it into a relation with the fundamental properties of the galaxies (e.g. stellar population, etc.). Such a relation needs to take into account the quantity of ISM and its distribution. Conselice et al. (2003, and references therein) previously reported that of early-type dwarfs in the dense Virgo cluster have . These galaxies are potentially newly accreted members or on orbits that never lead them in the cluster’s center. In addition, they have Hi properties similar to Local Group transition and late-type dwarfs; the Local Group early-type dwarfs have much lower Hi content. It is argued that the Virgo cluster acts as an ”evolutionary change engine” and that these Hi rich dEs were dIrrs that have recently made the transition by means of ram pressure or Kelvin-Helmholtz instabilities (i.e. the morphology-density relation at work). Alternatively, Buyle et al. (2005) suggests that an enhanced star formation rate due to ram pressure and gravitational interactions, will accelerate the gas depletion in such systems.
Both these studies have targeted relatively bright dEs () in a dense environment, somewhat different to the situation of Local Group dEs. In order to assess the overall validity of the morphology-density relation and the relative importance of the environment in dwarf galaxy evolution, we must now study a regime of low mass galaxies in a low density environment. Under such conditions, the environmental impact on galaxy evolution should be minimized while the shallow potential well of the low mass dEs will help to amplify the effect of internal mechanisms (e.g. stellar winds, supernova explosions).
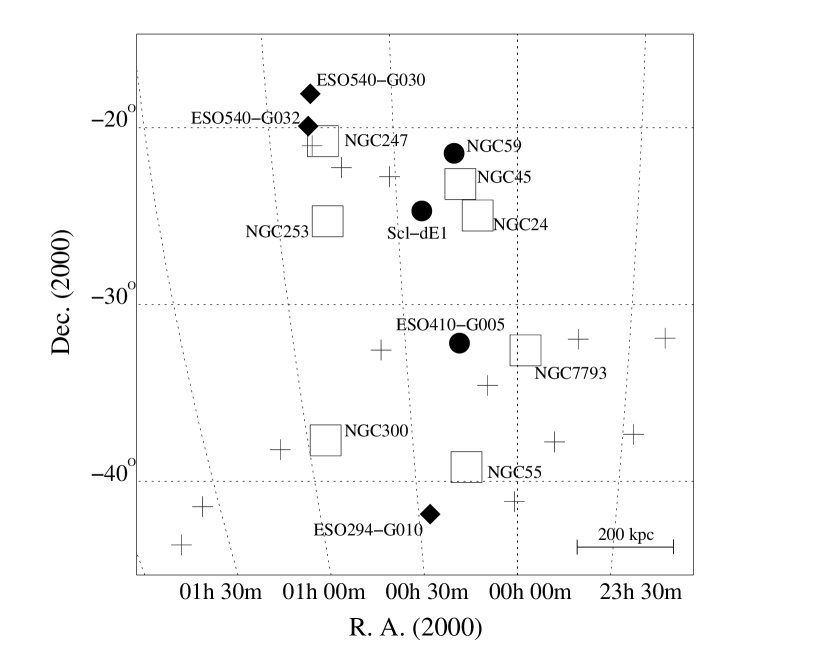
The Sculptor group (Fig. 1), with its sparse galaxy distribution, provides an ideal laboratory to study galaxies in such an environment without having to hunt down truly isolated objects. Due to its proximity to the Local Group (1.5 to 4 Mpc, Jerjen et al. 1998; Karachentsev et al. 2003), detailed studies of stellar populations (Karachentsev et al., 2000; Skillman et al., 2003b; Olsen et al., 2004), ISM contents (Côté et al., 1997; de Blok et al., 2002), and chemical compositions (Skillman et al., 2003a) of Sculptor galaxies are available.
There are six early-type dwarf galaxies known in the Sculptor group and prior to this study five have not been detected in Hi. The sixth, NGC 59, is a dS0 galaxy for which Côté et al. (1997) reported detections in both Hi (5.4 M⊙) and H. The five other galaxies are: the dS0/dIrr ESO294-G010, the two dE/dIrr ESO540-G030 and ESO540-G032, the dSph ESO410-G005, and the dE Scl-dE1. For all but Scl-dE1, stellar photometry based on Hubble Space Telescope data reveals statistical evidence for the presence of blue stars in the central regions of these galaxies (Karachentsev et al., 2000; Jerjen & Rejkuba, 2001; Karachentsev et al., 2002, 2003) although the possibility that such stars result from photometric errors in the crowded central fields cannot be excluded at this time. In addition to these possibly young stars, Jerjen et al. (1998) have identified a small Hii region in ESO294-G010.
This paper presents the results of a deep Hi study of these five early-type Sculptor group dwarfs and addresses the central question as to whether the light distribution of a galaxy (i.e. morphology) is sufficient to predict ISM content. The paper is organised as follows: the observations are described in section 2, section 3 describes the Hi properties of our sample galaxies, and section 4 provides a discussion of the Sculptor group. The main conclusions can be found in section 5.
2 Observations
2.1 Sample properties
We have observed the five lowest luminosity objects of the Sculptor group. They are also the only five objects of the group where no Hi detection were previously reported. General properties of these five dwarfs are described in detail in Jerjen et al. (1998, 2000). In Table 1, we list some of their physical parameters. The first two columns provide the coordinates. The distances in Mpc have previously been measured using the tip of the red giant branch technique (Karachentsev et al., 2000, 2002, 2003). The apparent -magnitudes and extinction are given in Jerjen et al. (2000). This allowed us to calculate the luminosities, (we adopted a value of M⊙,B = 5.5, Bessell et al. 1998), and absolute magnitudes, MB. For ESO294-G010, the optical, spectroscopic velocity (Jerjen et al., 1998) is also listed in Table 1.
2.2 Hi observations
In 2004 October, the 64 m ATNF Parkes Radio Telescope was employed to obtain deep, high spectral resolution Hi spectra toward the five Sculptor dwarf galaxies. We used the Multibeam instrument in MX (beam-switching) mode along with the narrowband correlator in the MB7_8_1024 configuration provide 8 MHz bandwidth divided into 1024 channels. The observations were done at a central frequency of 1418 MHz, resulting in an Hi velocity coverage from to km s-1 with channel widths of 1.6 km s-1 and a beam size of 14.1′. This configuration enabled us to observe with seven beams simultaneously, keeping one beam on-source with the six others on adjacent sky, alternating the on source beam every two minutes. The integration times for the target galaxies were: 294 min for ESO294-G010, 210 min for ESO410-G005, 336 min for ESO540-G030, and 224 min for ESO540-G032. These resulted in clear detections in Hi. The RMS values are listed in Table 2. In the case of Scl-dE1, 434 min of on-source integration yielded a spectral RMS of 1.2 mJy but no detection.
The obtained spectra were reduced using the LIVEDATA data reduction pipeline. The median of the Tukey smoothed bandpasses — to remove the effect of radio frequency interference — was used for calibration. The gridding was performed using GRIDZILLA, using the median of weighted values as estimator. Both LIVEDATA and GRIDZILLA are available in the AIPS++ software package. To remove residual baseline ripples, caused by a well known 5.8 MHz standing wave between the focus cabin and the vertex of the Parkes telescope, the MBSPECT robust fitting algorithm from the MIRIAD software package was used to fit (over the complete spectral region) and remove 7th or 8th order polynomials. The spectra of the five galaxies are shown in Fig. 2. Various moments (total flux, , flux weighted mean velocity, , and flux weighted velocity dispersion, ) are listed Table 2. The errors listed were calculated using a Monte-Carlo approach where normally distributed noise (the RMS was used as the dispersion) was added to the spectra.
Data from the Australia Telescope Compact Array (ATCA) archive are available for three of these objects: ESO294-G010, ESO540-G030, and ESO540-G032 (project C705). These data were obtained in 1998 December in the 750D array and the FULL_8_512 correlator configuration, corresponding to 8 MHz bandwidth divided in 512 channels. The source PKS1934-638 was used as flux calibrator and PKS0023-263 and PKS0022-423 were used for phase calibration.
Taking advantage of our Parkes observations, we identified the channels in the ATCA data that contain the 21 cm line emission from the galaxies. Without the prior knowledge of the Hi velocity range provided by the Parkes dataset, it would have been impossible to detect the faint Hi signals near the target galaxies.
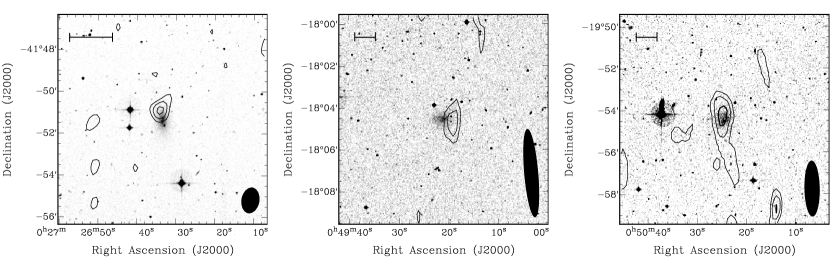
Using the MIRIAD data reduction package, the data were gridded using ’natural’ weighting to a channel spacing of 4 km s-1 and pixel size of 10′′. The images were deconvolved using the CLEAN algorithm and RESTORed to beam sizes of for ESO294-G010, for ESO540-G030, and for ESO540-G032. To maximize the signal to noise ratio, we generated integrated intensity maps using only those channels where the flux rose above 1 in the equivalent Parkes spectra channel. The results are shown in Fig. 3 which also shows optical images from the Digitized Sky Survey.
3 Results and discussion
3.1 Hi association
Galaxies in the Sculptor group have heliocentric velocities ranging from km s-1 (Côté et al., 1997). It was also previously established, by direct distance measurements (Jerjen et al., 1998; Karachentsev et al., 2000; Jerjen & Rejkuba, 2001; Karachentsev et al., 2003), that the galaxies we observed are genuine members of the Sculptor group. Since our Hi detections fall inside the velocity range mentioned above (our clouds have velocities between 100 km s-1 and 250 km s-1, Fig. 2) the assumption that they are related to the targeted galaxies is reasonable.
However, we have no information on the distances to these Hi clouds and the possibility of foreground 21 cm emission with overlapping velocities cannot be excluded a priori. Because of the low velocity range and the projected position of the Sculptor group on the sky, there are two potential contamination sources: High Velocity Clouds (velocities between km s-1 and km s-1) and the Magellanic Stream (between 0 km s-1 and 150 km s-1, Putman et al. 2003; Brüns et al. 2005).
High Velocity Clouds (HVCs) are Galactic Hi clouds with velocities that do not fit simple Galactic rotation models. We consider that HVC contamination is not a source of confusion for the observed positions due to the following reasons. First, there are no catalogued HVCs (Putman et al., 2002) within 30′ of any of our targets and that, in addition, there are no HVCs with velocities consistent with those of our Hi detections within one degree. Second, the majority of Compact HVCs have sizes of the order of 30′ (Braun & Burton, 2000; Brüns et al., 2001; Burton et al., 2001; de Heij et al., 2002) although the most compact HVC found to date has an extent of 4′.4 (Brüns & Westmeier, 2004), twice the size of the present detections. We, however, recognise that the Hi maps of Fig. 3 come from aperture synthesis observations, so that it is likely some Hi flux remains undetected on the larger scales inaccessible with the array configuration employed (a problem that Brüns & Westmeier 2004 managed to avoid). By calculating the total Hi flux for the clouds from the ATCA data and comparing these with the Parkes data, we estimate that the ATCA observations recover % of the flux for ESO294-G010, % for ESO540-G030, and % for ESO540-G032. The clouds should therefore be slightly larger than what is seen in Fig. 3, but, nevertheless, they remain significantly smaller than even the most extreme compact HVC.
The Magellanic Stream remains a problem because of its large radial velocity scatter near the Sculptor group (Brüns et al., 2005). Further analysis would be necessary if one wishes to disentangle the origins and establish the physical location of each single cloud in that direction. Nevertheless, there is generally a good agreement between the position of the Sculptor dwarfs and the Hi detections (Fig. 3). In the following, we will assume that the detected Hi clouds are indeed associated with the Sculptor group galaxies.
3.2 Hi properties
For each object, the RMS of the spectra, the total flux, the flux weighted mean velocity and velocity dispersion of the Hi are quoted in Table 2. We also estimated the Hi masses , expressed in solar units, M⊙, using the standard equation:
| (1) |
where is the distance in Mpc (in Table 1), and is the Hi flux density in Jansky. The integration was computed up to where the signal fell below the 1 noise level on either side of the emission peak.
The derived total Hi masses for ESO294-G010, ESO410-G005, ESO540-G030 and ESO540-G032 are = (3.00.3)105 M⊙ (the peak flux is 8 above noise level), = (7.31.5)105 M⊙ (12), = (8.91.9)105 M⊙ (7) and = (9.51.6)105 M⊙ (9) respectively. The undetected galaxy, Scl-dE1, has an upper limit 105 M⊙ (3 limit for an assumed 10 km s-1 velocity dispersion at 4.21 Mpc). This is comparable to Tucana which has no Hi detected within its optical boundary (/ 0.03 , Oosterloo et al., 1996). The Hi masses for the other four galaxies are comparable to that of similar Local Group mixed and early type dwarfs where Hi has been detected: Sculptor dSph has 2.3 M⊙ (/ = 0.2 , Bouchard et al., 2003), LGS3 has 4.2 M⊙ (/ = 0.3 , Young & Lo, 1997), Phoenix has 1.9 M⊙ (/ = 0.2 , St-Germain et al., 1999), and Antlia exhibits 6.8 M⊙ (/ = 0.4 , Barnes et al., 2001).
Buyle et al. (2005) argued that the low values of / typically found in dEs may be a direct result from a near complete gas depletion due to enhanced star formation efficiency. They were using the results of an analytical chemical evolution model (Pagel & Tautvaisiene, 1998) and stellar mass-to-light ratios (/) from a simple stellar population model (SSP Vazdekis et al., 1996). In this approach all the gas that has been ejected from stars (stellar winds, supernova explosions, planetary nebulae, etc.) is effectively expelled from the galaxy, but leaving part of the metals to enrich the chemical composition of subsequent gas inflow and star formation. The resulting state is a metal-enhanced (unless the metals also escape) but inevitably gas deficient galaxy.
Using the SSP model from Anders & Fritze-v. Alvensleben (2003) at a metallicity (Z) of 0.02 Z⊙ and by assuming a constant star formation rate of 0.01 per yr over the entire lifetime of the galaxy, we calculated that the ISM return from normal stellar evolution should give a mass-to-light ratio of the order of / = 0.25 after 10 Gyr. Our objects have / between 0.08 and 0.19 , consistent with this simple case of passive, undisturbed evolution. Most of the expelled gas should therefore be retained in the galactic potential well and cooled to the form of Hi. This, however, implies that the pristine gas used to form stars in the galaxy, has not build-up any reservoirs and is instantly used up by star formation. We must therefore conclude that the Hi content in our galaxies is consistent with both the enhanced efficiency of star formation and gas buildup from stellar evolution. In the case of Scl-dE1, like many Local Group early-type dwarfs (as noted by Grebel et al., 2003) and even Galactic globular clusters, some factors may have prevented the cooling process and/or the accumulation of Hi in the system.
Fig. 4 shows the relation between Hi mass and absolute magnitude for galaxies from the HIPASS Bright Galaxy Catalog (Koribalski et al., 2004), from the Centaurus A and Sculptor Group (Côté et al., 1997) and from the Local Group (Mateo, 1998, and references therein). Our results agree with that of Warren et al. (2004), who noted that dwarf galaxies have a larger spread in / than brighter galaxies. There is indeed evidence that the spread is one order a magnitude larger in the dwarf regime compared to more luminous galaxies.
3.3 Hi distribution
The Hi maps in Fig. 3 show, in two out of three cases, an apparent offset between the Hi gas and stellar components of the galaxies. Because of the low signal to noise ratio in our aperture synthesis images we adopted a conservative error on the accurate position of the Hi emission peak of a third of the beam size. These offsets are 35′′ (290 pc projected distance or times its Holmberg radius, , Jerjen et al. 2000) for ESO294-G010 — greater than the accuracy — and 30′′ (460 pc or ) for ESO540-G030 — greater than the accuracy. In the third case, ESO540-G032, the apparent offset is smaller than the uncertainty of the Hi position and thus consistent with being centered.
An offset between the Hi and optical was previously detected in the Local Group galaxy Phoenix. Not only is the Hi in Phoenix found 5′ or 650 pc from the optical center of the galaxy (St-Germain et al., 1999) but Gallart et al. (2001) also found that the gas is kinematically separated from the optical by 29 km s-1. These authors have also conducted semi-analytical and numerical analyses to demonstrate that the Hi offset is either the consequence of the environmental conditions, i.e. ram pressure by the intergalactic medium Phoenix travels through or the result of an internal process i.e. several supernova explosions in the dwarf. The authors favored the former explanation — without discarding the latter — because it produced a smooth, anisotropic structure similar to that observed.
In the low density environment represented by the Sculptor Group, most galaxies can be considered as essentially isolated objects, and, in that respect, should be under similar conditions as Phoenix (which lies at 450 kpc from the Milky Way). More precisely, the closest neighbour to both ESO540-G030 and ESO540-G032 is the faint IB(s)m galaxy DDO6, at a relative 3-dimensional distance of 180 kpc and 100 kpc, respectively, while the brighter spiral NGC247 is around 700 kpc behind the pair. The closest neighbour of ESO294-G010 is the spiral NGC55 at a 3-dimensional distance of 160 kpc (radial distances from Karachentsev et al., 2004). Although these distances are significantly smaller than that of Phoenix to the Milky Way, the larger counterparts are of much lower mass. We can therefore draw similar conclusions as Gallart et al. (2001) to explain the Hi and optical geometry of the systems. The possibility of tidal stripping seems unlikely in this case as the gas would not be concentrated on one side of the optical but stretched on both sides. Furthermore, with the large distances separating the dwarfs to their neighbours, the tidal forces should be minimal.
It is worth noting that, in the case of ESO294-G010, Jerjen et al. (1998) reported the existence of an Hii region south of its optical center while the Hi is on the north side. This is the opposite situation as was observed in Phoenix were the Hi emission is on the same side as the galaxy’s youngest stars (Martínez-Delgado et al., 1999). This might suggest that in ESO294-G010, the supernova explosion/stellar wind scenario might play a bigger role than in the case of Phoenix. Detailed stellar population studies of these Sculptor dwarfs are needed to explore the various possibilities.
The only Sculptor galaxy where no Hi is detected to date, Scl-dE1, is also one of the only two dEs of the group. Yet, contrary to the prediction of the morphology-density relation, this object is located far from any other group members. Its closest more massive neighbour, the starburst spiral NGC253, is spatially separated by kpc (5.4∘ projected angular separation or kpc tangential distance, and 270 kpc radial distance). We note that the spiral galaxy NGC45 is the closest in projection but its distance of 5.9 Mpc (Tully 1988) places it 2 Mpc, to the far end of the group. This situation of Scl-dE1 is reminiscent of the case of the isolated Local Group early-type dwarf Tucana (880 kpc away from the Milky Way) since both objects also have predominantly old stellar populations, or the Cetus dwarf (755 kpc from the Milky Way) which has some young stars (McConnachie et al., 2005) but no Hi. Apart from the possibility of Scl-dE1, Tucana, and Cetus being on highly eccentric orbits that would lead these galaxies much closer to their neighbouring galaxies at perigalacticon, there is only a weak case for an environmentally driven gas removal process or ionisation and thus strong internal mechanisms (e.g. Supernovae driven winds or radiative feedback, see Dekel & Woo 2003) must be responsible for the properties of these objects.
4 On the Sculptor group and the morphology-density relation
The Sculptor group is known to be a loose aggregation of several luminous galaxies with satellites and late-type dwarfs populating the space between rather than a virialized system (Jerjen et al., 1998). Fig. 1 shows the large extent of the galaxy distribution on the sky of or over 1 Mpc across, at an assumed mean distance of 2.5 Mpc. Group members exhibit even a wider dispersion in their line of sight distances (Jerjen et al., 1998; Karachentsev et al., 2003). Côté et al. (1997) initially derived a dynamical crossing time of 3.2 years assuming a virialized system and using projected distances to the tentative group center. Because of the “cigar-like distribution” (Jerjen et al., 1998) of the group the assumption of an isotropic system does not stand and this value can only be a lower limit whereas the true value must be closer to a Hubble time. This makes the Sculptor group a prototypical low density environment where interaction between galaxies are expected to be minimal and external gas stripping largely ineffective.
Indeed, all but one galaxy of the Sculptor group have substantial amounts of Hi which is either primordial or the result from stellar feedback. In all cases, the environment of these galaxies has not managed to either remove that gas or ionise it. This can be viewed as a confirmation of the overall validity of the morphology-density relation in a low density environment. There is, however, one caveat: contrary to the standard view of the morphology-density relation and the environmentally driven late-type to early-type evolution scenario, the low mass end of the galaxy spectrum in the loosely-bound Sculptor group is not solely populated by late-type dwarfs. In fact, our results support the Grebel et al. (2003) contention that: “Transition-type dwarfs are dSphs that kept their interstellar medium and therefore should replace dSphs in isolated locations where stripping is ineffective.” This is further reinforced by the fact that our five target galaxies are of very low (see Table 2 and Fig. 4).
In line with the morphology-density relation and because of the presence of both Hi gas and a centrally concentrated population of young blue stars (Karachentsev et al., 2000) in ESO410-G005, we propose a reclassification of ESO410-G005 (initially labelled dSph, Karachentsev et al. 2000) to dSph/dIrr. We believe that this reclassification would better reflect the nature of this low mass dwarf. Similarly, since NGC59 contains both Hi (Côté et al., 1997) and Hii regions (Skillman et al., 2003b), it is not a genuine early-type dwarf and should be classified as dS0 pec. These changes give weight to the empirical relation between morphology and ISM content in the Sculptor group, i.e. a slightly irregular morphology caused by the presence of young stars seem to indeed indicate an underlying presence of ISM. Consequently, the Sculptor group has only one single early-type dwarf system: Scl-dE1, without Hi or any young stars (Karachentsev et al., 2003).
This, however, highlights a second caveat in the morphology-density relation for low density environments. While the relation describes well the general trend of gas-rich dwarf irregular galaxies being relatively isolated stellar systems and early-type dwarfs the satellites of more luminous galaxies, it provides no explanation for the existence of an isolated gas deficient early-type dwarf galaxy like Scl-dE1. This object joins a list of similar systems including Tucana and Cetus that do not fit the global picture. Clearly these systems hold important clues to what extent internal gas expulsion mechanisms (supernova explosions or stellar winds) govern the passive evolution of dwarf galaxies in the field.
5 Conclusions
In this paper we have presented the results of Hi observations toward the five lowest luminosity dwarf galaxies of the Scultor group. The main results are:
-
1.
All but one galaxy of the Sculptor group have substantial amounts of Hi ( M⊙). Four new Hi detections have been made with M⊙M⊙. The only undetected galaxy, Scl-dE1, must have M⊙. All Sculptor galaxies except Scl-dE1 have / .
-
2.
The Hi masses for ESO294-G010, ESO410-G005, ESO540-G030, and ESO540-G032 are all consistent with passive, undisturbed evolution where all the gas from stellar winds has condensed in the form of Hi.
-
3.
ESO410-G005, formerly classified as a dSph galaxy, better fits the dSph/dIrr category while NGC59 is a dS0 pec. There is only one genuine early-type dwarf galaxy in the Sculptor group: Scl-dE1.
-
4.
At least two of the mixed-morphology galaxies, ESO294-G010 and ESO540-G030, have a significant offset between their optical and Hi components. These offsets are likely to be caused by winds from star forming regions.
-
5.
The morphology-density relation seems to be valid for low-density environments where mixed-type galaxies, and not late-types, replace the early-type systems when in isolation.
-
6.
Scl-dE1 joins Tucana and Cetus as an isolated low mass gas-deficient early-type dwarf. These objects require internal mechanisms to explain their evolutionary states.
References
- Anders & Fritze-v. Alvensleben (2003) Anders, P., & Fritze-v. Alvensleben, U. 2003, A&A, 401, 1063
- Aparicio et al. (1997) Aparicio, A., Gallart, C., & Bertelli, G. 1997, AJ, 114, 680
- Barnes et al. (2001) Barnes, D. G., et al. 2001, MNRAS, 322, 486
- Bessell et al. (1998) Bessell, M. S., Castelli, F., & Plez, B. 1998, A&A, 333, 231
- Bouchard et al. (2003) Bouchard, A., Carignan, C., & Mashchenko, S. 2003, AJ, 126, 1295
- Brüns et al. (2001) Brüns, C., Kerp, J., & Pagels, A. 2001, A&A, 370, L26
- Brüns et al. (2005) Brüns, C., et al. 2005, A&A, 432, 45
- Brüns & Westmeier (2004) Brüns, C., & Westmeier, T. 2004, A&A, 426, L9
- Braun & Burton (2000) Braun, R., & Burton, W. B. 2000, A&A, 354, 853
- Burton et al. (2001) Burton, W. B., Braun, R., & Chengalur, J. N. 2001, A&A, 369, 616
- Buyle et al. (2005) Buyle, P., De Rijcke, S., Michielsen, D., Baes, M., & Dejonghe, H. 2005, MNRAS, 360, 853
- Carignan et al. (1998) Carignan, C., Beaulieu, S., Côté, S., Demers, S., & Mateo, M. 1998, AJ, 116, 1690
- Conselice et al. (2003) Conselice, C. J., O’Neil, K., Gallagher, J. S., & Wyse, R. F. G. 2003, ApJ, 591, 167
- Côté et al. (1997) Côté, S., Freeman, K. C., Carignan, C., & Quinn, P. J. 1997, AJ, 114, 1313
- Da Costa (1998) Da Costa, G. S. 1998, in Stellar astrophysics for the local group, ed. A. Aparicio, A. Herroro, & F. Sanchez (Cambridge: Cambridge Univ. Press), 351
- de Blok et al. (2002) de Blok, W. J. G., Zwaan, M. A., Dijkstra, M., Briggs, F. H., & Freeman, K. C. 2002, A&A, 382, 43
- de Heij et al. (2002) de Heij, V., Braun, R., & Burton, W. B. 2002, A&A, 392, 417
- Dekel & Woo (2003) Dekel, A., & Woo, J. 2003, MNRAS, 344, 1131
- De Rijcke et al. (2003) De Rijcke, S., Dejonghe, H., Zeilinger, W. W., & Hau, G. K. T. 2003, A&A, 400, 119
- De Rijcke et al. (2004) —. 2004, A&A, 426, 53
- Einasto et al. (1974) Einasto, J., Saar, E., Kaasik, A., & Chernin, A. D. 1974, Nature, 252, 111
- Gallart et al. (2001) Gallart, C., Martínez-Delgado, D., Gómez-Flechoso, M. A., & Mateo, M. 2001, AJ, 121, 2572
- Geha et al. (2003) Geha, M., Guhathakurta, P., & van der Marel, R. P. 2003, AJ, 126, 1794
- Grebel (2001) Grebel, E. K. 2001, Astrophysics and Space Science Supplement, 277, 231
- Grebel et al. (2003) Grebel, E. K., Gallagher, J. S., & Harbeck, D. 2003, AJ, 125, 1926
- Hensler et al. (2004) Hensler, G., Theis, C., & Gallagher, J. S. 2004, A&A, 426, 25
- Holtzman et al. (2000) Holtzman, J. A., Smith, G. H., & Grillmair, C. 2000, AJ, 120, 3060
- Hurley-Keller et al. (1999) Hurley-Keller, D., Mateo, M., & Grebel, E. K. 1999, ApJ, 523, L25
- Jerjen et al. (2000) Jerjen, H., Binggeli, B., & Freeman, K. C. 2000, AJ, 119, 593
- Jerjen et al. (1998) Jerjen, H., Freeman, K. C., & Binggeli, B. 1998, AJ, 116, 2873
- Jerjen & Rejkuba (2001) Jerjen, H., & Rejkuba, M. 2001, A&A, 371, 487
- Karachentsev et al. (2003) Karachentsev, I. D., et al. 2003, A&A, 404, 93
- Karachentsev et al. (2004) Karachentsev, I. D., Karachentseva, V. E., Huchtmeier, W. K., & Makarov, D. I. 2004, AJ, 127, 2031
- Karachentsev et al. (2000) Karachentsev, I. D., et al. 2000, ApJ, 542, 128
- Karachentsev et al. (2002) Karachentsev, I. D., et al. 2002, A&A, 389, 812
- Knapp et al. (1978) Knapp, G. R., Kerr, F. J., & Bowers, P. F. 1978, AJ, 83, 360
- Koribalski et al. (2004) Koribalski, B. S., et al. 2004, AJ, 128, 16
- Martínez-Delgado et al. (1999) Martínez-Delgado, D., Gallart, C., & Aparicio, A. 1999, AJ, 118, 862
- Mateo (1998) Mateo, M. L. 1998, ARA&A, 36, 435
- Mayer et al. (2001) Mayer, L., Governato, F., Colpi, M., Moore, B., Quinn, T., Wadsley, J., Stadel, J., & Lake, G. 2001, ApJ, 547, L123
- McConnachie et al. (2005) McConnachie, A. W., Irwin, M. J., Ferguson, A. M. N., Ibata, R. A., Lewis, G. F., & Tanvir, N. 2005, MNRAS, 356, 979
- Miller et al. (2001) Miller, B. W., Dolphin, A. E., Lee, M. G., Kim, S. C., & Hodge, P. 2001, ApJ, 562, 713
- Monkiewicz et al. (1999) Monkiewicz, J., et al. 1999, PASP, 111, 1392
- Moore et al. (1996) Moore, B., Katz, N., & Lake, G. 1996, ApJ, 457, 455
- Olsen et al. (2004) Olsen, K. A. G., Miller, B. W., Suntzeff, N. B., Schommer, R. A., & Bright, J. 2004, AJ, 127, 2674
- Oosterloo et al. (1996) Oosterloo, T., Da Costa, G. S., & Staveley-Smith, L. 1996, AJ, 112, 1969
- Pagel & Tautvaisiene (1998) Pagel, B. E. J., & Tautvaisiene, G. 1998, MNRAS, 299, 535
- Pedraz et al. (2002) Pedraz, S., Gorgas, J., Cardiel, N., Sánchez-Blázquez, P., & Guzmán, R. 2002, MNRAS, 332, L59
- Putman et al. (2002) Putman, M. E., et al. 2002, AJ, 123, 873
- Putman et al. (2003) Putman, M. E., Staveley-Smith, L., Freeman, K. C., Gibson, B. K., & Barnes, D. G. 2003, ApJ, 586, 170
- Read & Gilmore (2005) Read, J. I., & Gilmore, G. 2005, MNRAS, 356, 107
- Simien & Prugniel (2002) Simien, F., & Prugniel, P. 2002, A&A, 384, 371
- Skillman et al. (2003a) Skillman, E. D., Côté, S., & Miller, B. W. 2003a, AJ, 125, 610
- Skillman et al. (2003b) —. 2003b, AJ, 125, 593
- St-Germain et al. (1999) St-Germain, J., Carignan, C., Côté, S., & Oosterloo, T. 1999, AJ, 118, 1235
- Tully (1988) Tully, R. B. 1988, Nearby galaxies catalog (Cambridge and New York, Cambridge University Press, 1988, 221 p.)
- van den Bergh (1994) van den Bergh, S. 1994, AJ, 107, 1328
- van Zee et al. (2004) van Zee, L., Skillman, E. D., & Haynes, M. P. 2004, AJ, 128, 121
- Vazdekis et al. (1996) Vazdekis, A., Casuso, E., Peletier, R. F., & Beckman, J. E. 1996, ApJS, 106, 307
- Warren et al. (2004) Warren, B. E., Jerjen, H., & Koribalski, B. S. 2004, AJ, 128, 1152
- Young & Lo (1997) Young, L. M., & Lo, K. Y. 1997, ApJ, 476, 127


| Galaxy | Type | RA | Dec | D | |||
|---|---|---|---|---|---|---|---|
| (J2000) | (J2000) | (Mpc) | ( LB,⊙) | (km s-1) | |||
| ESO294-G010 | dS0/dIrr | 00 26 33.4 | -41 51 19 | 1.920.10aaKarachentsev et al. (2002) | 15.530.04bbJerjen et al. (2000) | 36.94.1 | 1170.8 |
| ESO410-G005 | dSph/dIrr | 00 15 31.4 | -32 10 47 | 1.920.19ccKarachentsev et al. (2000) | 15.120.1ccKarachentsev et al. (2000) | 55.312.2 | |
| ESO540-G030 | dE/dIrr | 00 49 21.1 | -18 04 34 | 3.400.34ddKarachentsev et al. (2003) | 16.370.07bbJerjen et al. (2000) | 56.912.1 | |
| ESO540-G032 | dE/dIrr | 00 50 24.5 | -19 54 23 | 3.420.27ddKarachentsev et al. (2003) | 16.440.08bbJerjen et al. (2000) | 53.59.4 | |
| Scl-dE1 | dE | 00 23 51.7 | -24 42 18 | 4.210.43ddKarachentsev et al. (2003) | 17.730.018bbJerjen et al. (2000) | 24.06.4 |
| Galaxy | RMS | / | ||||
|---|---|---|---|---|---|---|
| (mJy) | (mJy km s-1) | (km s-1) | (km s-1) | ( M⊙) | (M⊙/L⊙) | |
| ESO294-G010 | 1.8 | 34217 | 106.90.8 | 9.70.9 | 3.00.3 | 0.080.01 |
| ESO410-G005 | 2.3 | 83534 | 158.91.9 | 14.20.6 | 7.31.5 | 0.130.04 |
| ESO540-G030 | 1.8 | 32725 | 223.52.7 | 11.01.2 | 8.91.9 | 0.160.05 |
| ESO540-G032 | 2.1 | 34619 | 227.70.9 | 7.41.2 | 9.51.6 | 0.180.04 |
| Scl-dE1 | 1.2 | 22.5 | (10) | 1.0 | 0.04 |