A Morphological Study of Gamma-Ray Burst Host Galaxies
Abstract
We present a comprehensive study of the morphological properties of 42 -ray burst (GRB) host galaxies imaged with the Hubble Space Telescope in the optical band. The purpose of this study is to understand the relation of GRBs to their macro-environments, and to compare the GRB-selected galaxies to other high redshift samples. We perform both qualitative and quantitative analyses by categorizing the galaxies according to their visual properties, and by examining their surface brightness profiles. We find that all of the galaxies have approximately exponential profiles, indicative of galactic disks, and have a median scale length of about 1.7 kpc. Inspection of the visual morphologies reveals a high fraction of merging and interacting systems, with showing clear signs of interaction, and an additional exhibiting irregular and asymmetric structure which may be the result of recent mergers; these fractions are independent of redshift and galaxy luminosity. On the other hand, the three GRB host galaxies for which submillimeter and radio emission has been detected are isolated and compact, unlike the luminous submillimeter-selected galaxies. The fraction of mergers appears to be elevated compared to other high redshift samples, particularly for the low luminosities of GRB hosts ( to mag). This suggests that merging and interacting galaxies undergoing a burst of star formation may be an efficient site for the production of GRB progenitors. Finally, we show that GRB hosts clearly follow the size-luminosity relation present in other galaxy samples, but thanks to absorption redshifts they help extend this relation to lower luminosities.
1 Introduction
For nearly a century astronomers have attempted to classify galaxies by their apparent shape and to draw conclusions about the process of galaxy formation and evolution from these morphologies. The basic Hubble classification (Hubble 1926) and its variants (e.g., Hubble 1936; Sandage 1961) divide galaxies into three broad categories: elliptical, disk, and irregular. This morphological classification correlates with, among other physical properties, the star formation activity of the galaxies. Studies of local galaxy samples, as well as the currently-favored cold dark matter () model, also suggest that interactions and mergers play an important role in the build up of galactic and stellar mass, through both the accretion of material and an increase in the star formation rate. Thus, the morphological properties of galaxies as a function of cosmic time provide direct insight into the physical processes governing galaxy evolution.
In this manner, analysis of deep fields obtained primarily with the Hubble Space Telescope (HST) suggest that the locally-defined Hubble sequence may begin to break down at (van den Bergh 2002) with the emergence of a sizable fraction of faint, irregular, and interacting systems (e.g., Driver et al. 1995; Ellis 1997). While these observations, along with observations of local galaxies (e.g.,Arp 1966), suggest that mergers play a significant role in the formation of galaxies, three important limitations prevent a conclusive connection between morphology and galaxy formation at higher redshift.
First and foremost, studies of galaxy morphologies rely on flux-limited samples, which may contain a large fraction of atypical objects; e.g., ultra-luminous submillimeter galaxies Chapman et al. (2003), or mag optically-selected galaxies Conselice et al. (2003). Second, it is not clear how to relate the various samples (e.g., Lyman break galaxies, submillimeter-selected galaxies, near-IR selected galaxies) to the low redshift population or to each other. This is partly because of the different selection techniques and the differences in observed properties and space densities. Finally, at faint fluxes ( mag), where irregular galaxies may dominate the population, the distance scale relies on photometric redshifts, whose accuracy is difficult to assess.
In this context, it is interesting to investigate the morphological properties of -ray burst (GRB) host galaxies. We now have conclusive evidence that GRBs mark the death of massive stars Stanek et al. (2003) and therefore pinpoint star-forming galaxies at all redshifts (Hogg & Fruchter 1999; Bloom et al. 2002; Christensen et al. 2004). This allows a uniform selection over a wide range of redshift and luminosity. In addition, absorption spectroscopy of the bright afterglows allows us to measure redshifts of arbitrarily faint galaxies. Thus, the current GRB host sample spans and to mag (i.e., to ).
Here we present a comprehensive analysis of all optical HST observations of GRB host galaxies. The purpose of this study is twofold: First, to obtain information on the large-scale environments in which GRBs occur, as a clue to the formation of the progenitors. Second, to survey a set of high redshift galaxies which are physically related by their star formation activity, but which alleviate some of the selection effects of other samples. We summarize the HST observations in §2, provide a qualitative (§3) and quantitative (§4) analysis of the host morphologies, and compare the results to other high redshift galaxy samples (§5). We show that despite an overall diversity in the sizes and luminosities of GRB hosts, they invariably have roughly exponential profiles, with a large fraction undergoing mergers and interactions.
2 Hubble Space Telescope Data
We retrieved data from the HST archive111http://archive.stsci.edu/hst/ for all available GRBs after “on-the-fly” pre-processing. These include GRBs observed with the Space Telescope Imaging Spectrograph (STIS), GRBs observed with the Wide-Field Planetary Camera 2 (WFPC2), and GRBs observed with the Advanced Camera for Surveys (ACS). Details of the observations are summarized in Table 1. For each GRB we used the latest available images to reduce contamination from the afterglow and/or supernova emission222Residual afterglow and/or supernova emission is detected in GRBs 970228, 991216, 030329, and 041006..
We processed and combined individual exposures using the IRAF tasks drizzle (STIS, WFPC2) and multidrizzle (ACS) in the stsdas package (Fruchter & Hook 2002). In all cases we used pixfrac, with pixscale for the STIS images, pixscale for the WFPC2 images, and pixscale for the ACS images. The resulting images have pixel scales of 0.025, 0.07, and 0.05 arcsec pix-1, respectively.
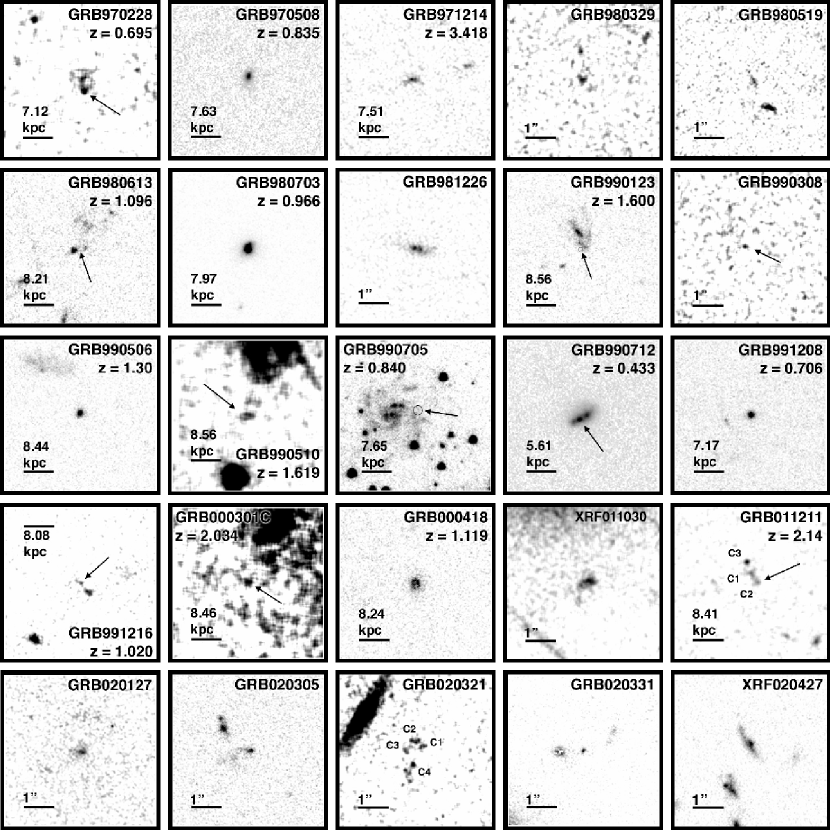
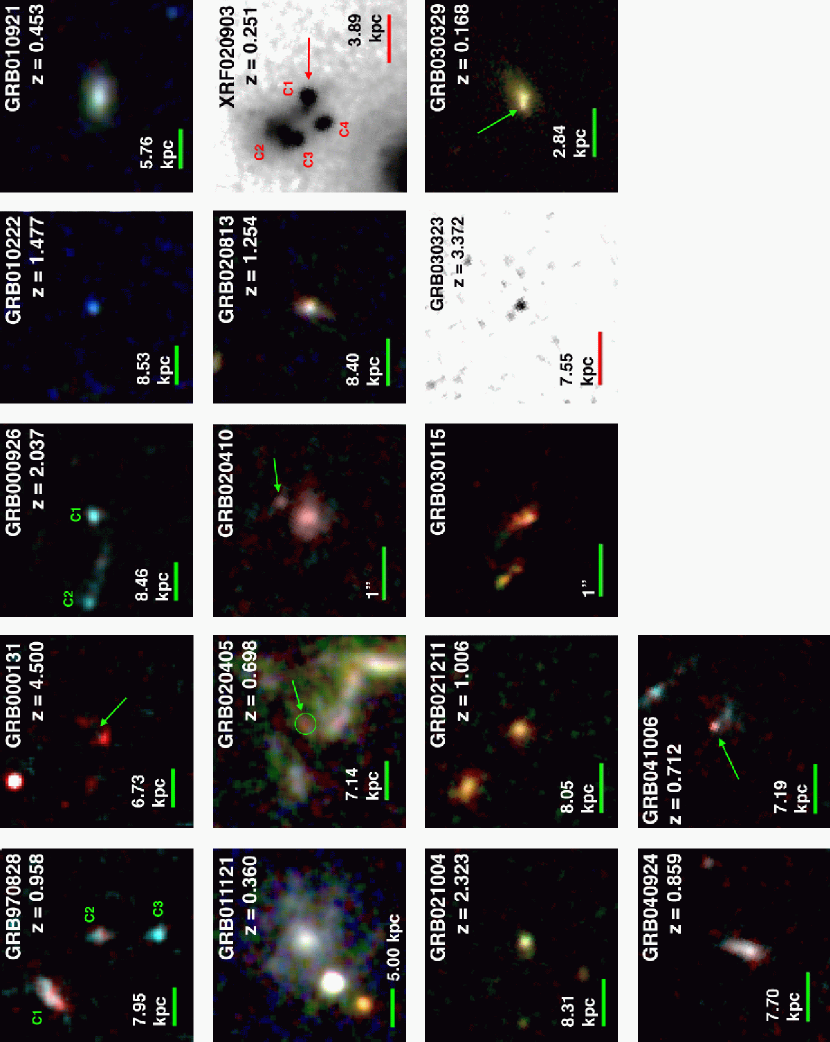
In Figures 1 and 2 we show grayscale and color images of the individual host galaxies. All images are flux-calibrated in the AB system according to the zero-points listed in the instrument handbooks (see also Sirianni et al. 2005), and are corrected for Galactic extinction (Schlegel et al. 1998). For GRB 011121 we used the extinction value determined by Price et al. (2002) from observations of the afterglow.
3 Morphological Classification
To classify the morphological properties of the GRB host galaxies, we created eight different qualitative morphological categories. Each category is independent of the others and galaxies may fit into more than one category. In this manner we are able to place a large number of galaxies into individual categories and account for multiple features. The categories are: concentrated elliptical or circular structure, or blob-like (BL); conspicuous disk structure (D); highly asymmetric or irregular structure (AS); galactic structure containing knots (KN); galaxies with off-center peaks (OC); galaxies with tidal tails (TT); galaxies that are either undergoing mergers or are closely interacting (MI); and galaxies which are too faint for morphological analysis (TF). The classification has been carried out independently by C.W. and E.B., and the results are summarized in Tables 1 and 2.
Of the 45 host galaxies observed with HST, three are not detected in our images, and an additional four are too faint to accurately categorize. These galaxies either occur at unknown redshifts, or . While these galaxies cannot be classified morphologically, they do indicate that a non-negligible fraction of GRBs (and hence of the formation of massive stars) occurs in very low luminosity and/or low surface brightness systems. In fact, given the measured redshifts and the magnitude limits for these galaxies we find that they typically have an absolute rest-frame -band magnitude of mag, somewhat fainter than the Large Magellanic Cloud.
For the remaining 38 galaxies with morphological classification we combine the basic categories into two general groups: regular and irregular/interacting. Regular galaxies are those that are categorized exclusively as either blob- or disk-like. The primary difference between these two categories is that the blob-like galaxies have much higher luminosity concentrations, while the disk-like galaxies have symmetric extended features. In §4 below we show that both the BL and D galaxies have surface brightness distributions that are well-described by exponential profiles and are therefore disk galaxies. The regular galaxies comprise about of the total sample.
The irregular category includes galaxies that are asymmetric or show signs of a merger or interaction. The latter includes multiple bright galaxies (e.g., the hosts of GRB 020405 and XRF 020903), or galaxies with filamentary structures (interpreted as tidal tails) extending towards nearby galaxies with which they are interacting (e.g., the host of GRB 000926). These tails are not symmetric about the center of the light distribution.
A similar morphology is evident in the OC category, for which the extended low surface brightness emission is not likely to be part of an ordered disk structure. The majority of these galaxies do not have visible galactic neighbors. If they are the results of galactic mergers then they are most likely in the late stages of the merging process, or alternatively signal an interaction with a lower mass galaxy. In this context the environment of GRB 991208 may be of particular interest. A faint galaxy kpc from the host galaxy exhibits a tidal tail morphology suggesting that the host is interacting with a low mass companion. It is also interesting to note that the host of GRB 991208, with mag, is similar in brightness to the LMC, suggesting that mergers between dwarfs play an important role in the assembly of more massive galaxies; an illustrative local example is NGC 1487 which is an interacting system of two dwarf galaxies (Johansson & Bergvall 1990).
The asymmetric galaxies exhibit clumpiness or concavities in their light distribution which may be interpreted as the result of an interaction. However, this morphology may also be interpreted as clumpiness in the distribution of the star formation activity, particularly in the case of higher redshift hosts for which we sample the rest-frame UV light. We note that the latter explanation may be partially supported by the lack of obvious nearby companions, although as in the case of the OC galaxies, these systems may be in the late stages of merging. The same argument holds for galaxies exhibiting knots, which could be the remnant bright cores of merging galaxies or signs of patchy star formation activity. A relevant example is the host of GRB 990705. This galaxy exhibits pronounced spiral structure with bright knots of star formation. At lower surface brightness (or higher redshift) the spiral arms may not be detected and the system might appear to have a knot morphology.
For the galaxies with morphological classification, the ratio of irregular and merging or interacting systems to regular systems is about . This ratio does not change significantly as a function of redshift. Dividing the sample into (low-) and (high-) bins, we find that at low- regular galaxies account for about of the sample while are irregular. For the high- sample the fractions are and , respectively, with the remainder being too faint. The only two categories with possible evolution between the low- and high- samples are the tidal tails and disks. Tidal tails occur in about of the low- population, but appear in of the high- population, while disk galaxies make up of the low- population and only of the high- population. The latter trend may be attributed to surface brightness dimming, but the increase in the frequency of tidal features with redshift may be real since surface brightness dimming would tend to have the opposite effect.
We finally note that some ambiguity exists amongst our broad classifications. For example, the host of GRB 990123 may be interpreted as a merger/interaction with strong tidal tails, where the burst itself occurred in the disrupted galaxy. Alternatively, this galaxy may be classified as a disk galaxy with a bright spiral arm accentuated by bright knots, which are presumably star forming HII regions. In this case, the burst was located in one of these bright knots. Still, such cases comprise a relatively small fraction of the overall sample.
4 Surface Brightness
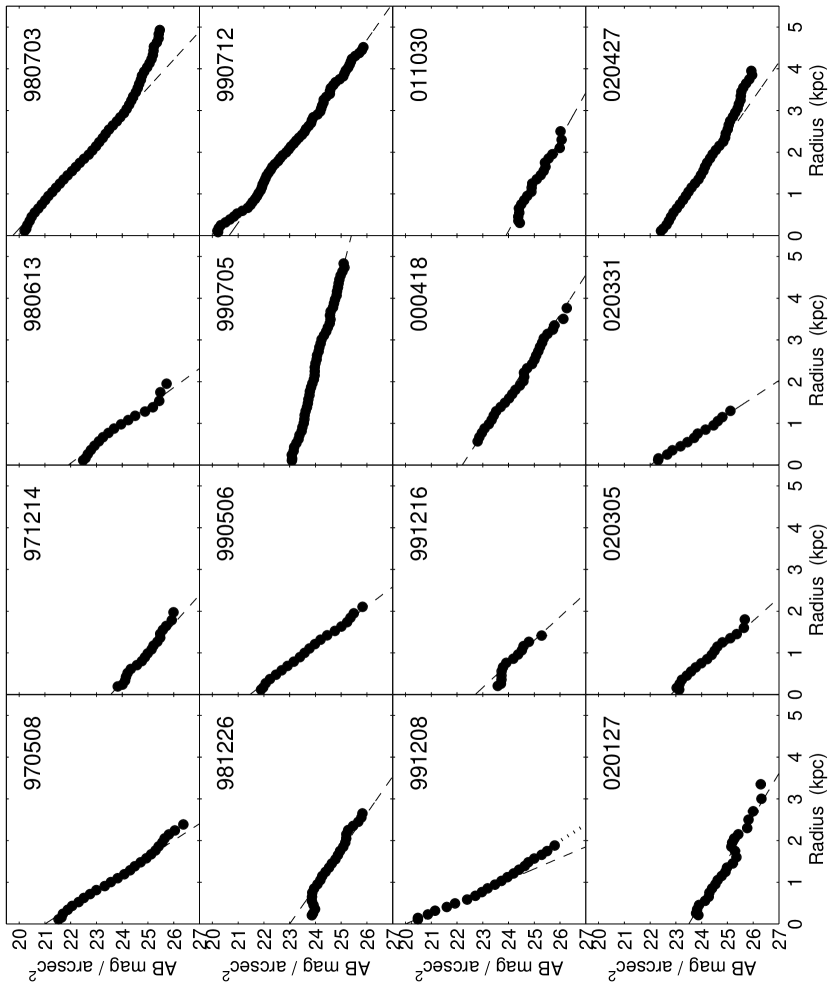
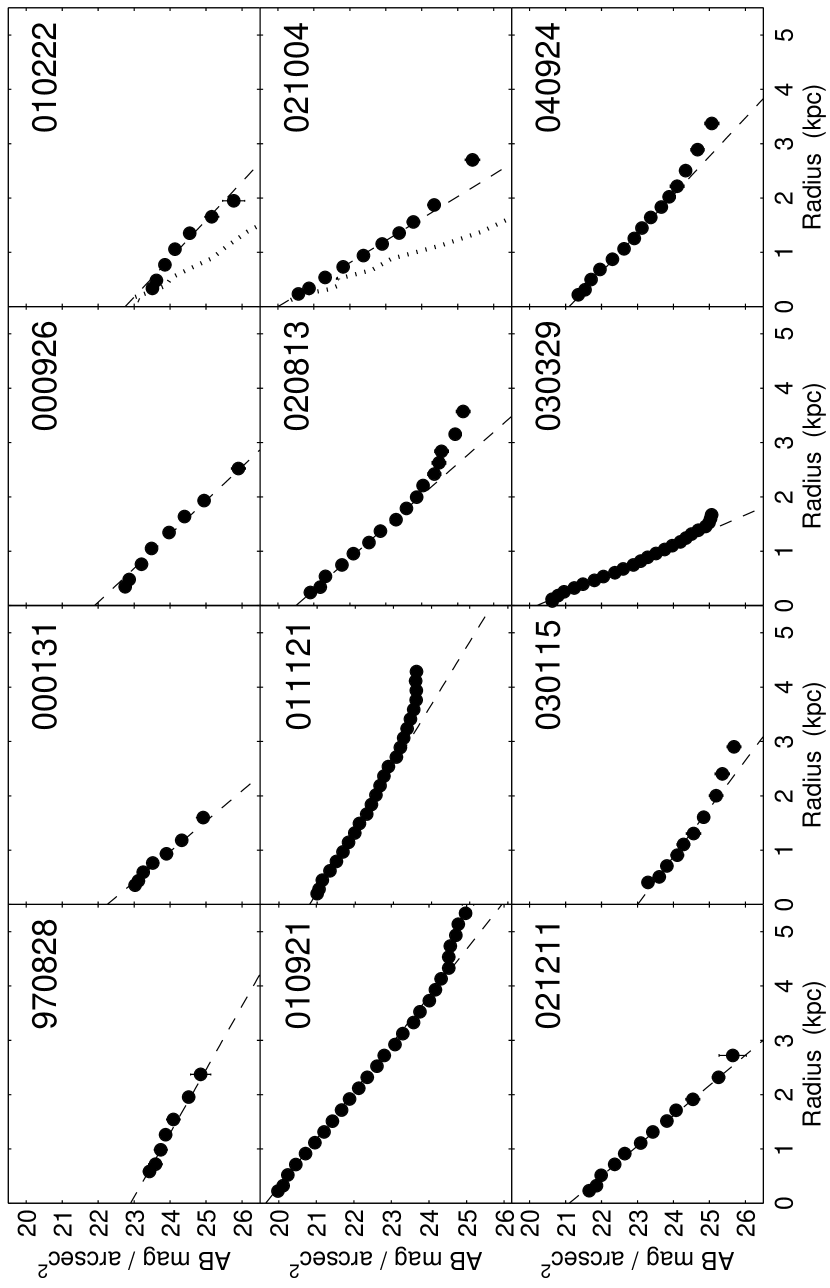
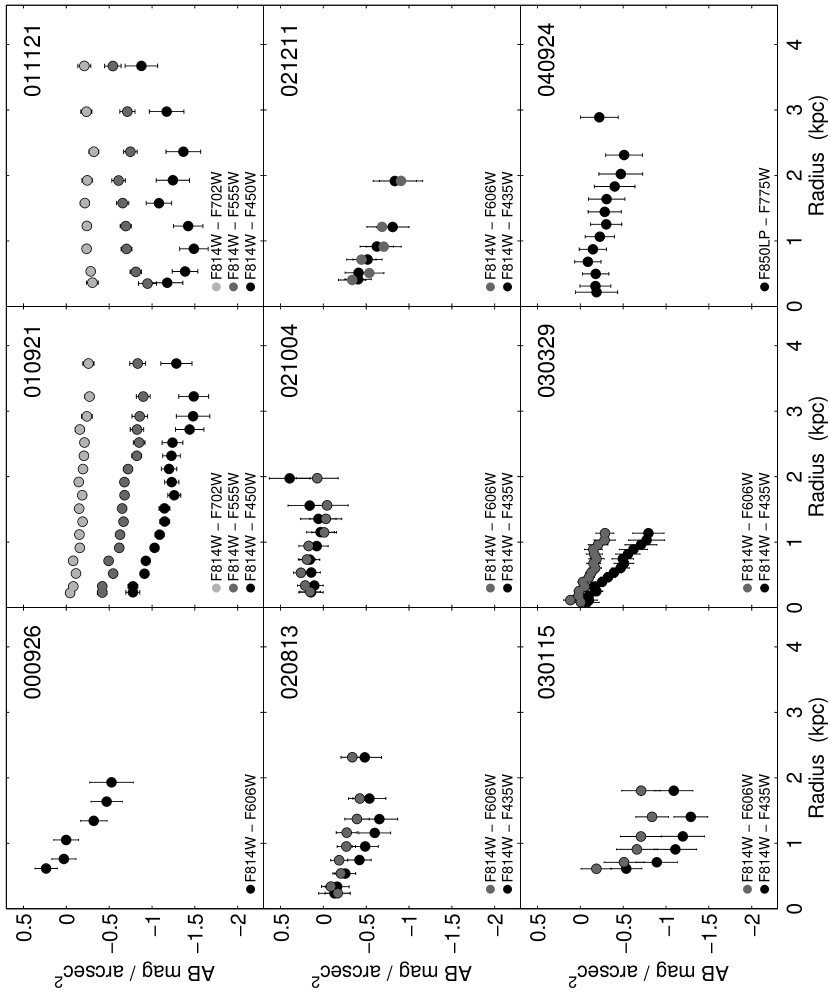
Observations of local galaxies suggest that the surface brightness profiles of disk galaxies are roughly exponential, while those of elliptical galaxies and galaxy bulges tend to follow an de Vaucouleurs law (de Vaucouleurs 1948). In this section we determine the surface brightness profiles and sizes of the GRB host galaxies and investigate their distributions as an additional input into their morphological classification. We determine the radial surface brightness distributions in two ways. First, for galaxies with a relatively simple apparent morphology we construct radial surface brightness plots using the IRAF task phot, with a range of apertures chosen to span the full extent of each host galaxy while maintaining in each bin. A comparison of circular apertures to elliptical isophotes (using the IRAF task ellipse) indicates that the difference is typically within the uncertainty in individual apertures. The resulting surface brightness profiles are shown in Figures 3 and 4. For the host galaxies observed with WFPC2 and ACS in multiple filters we also plot the radial color profiles (Figure 5).
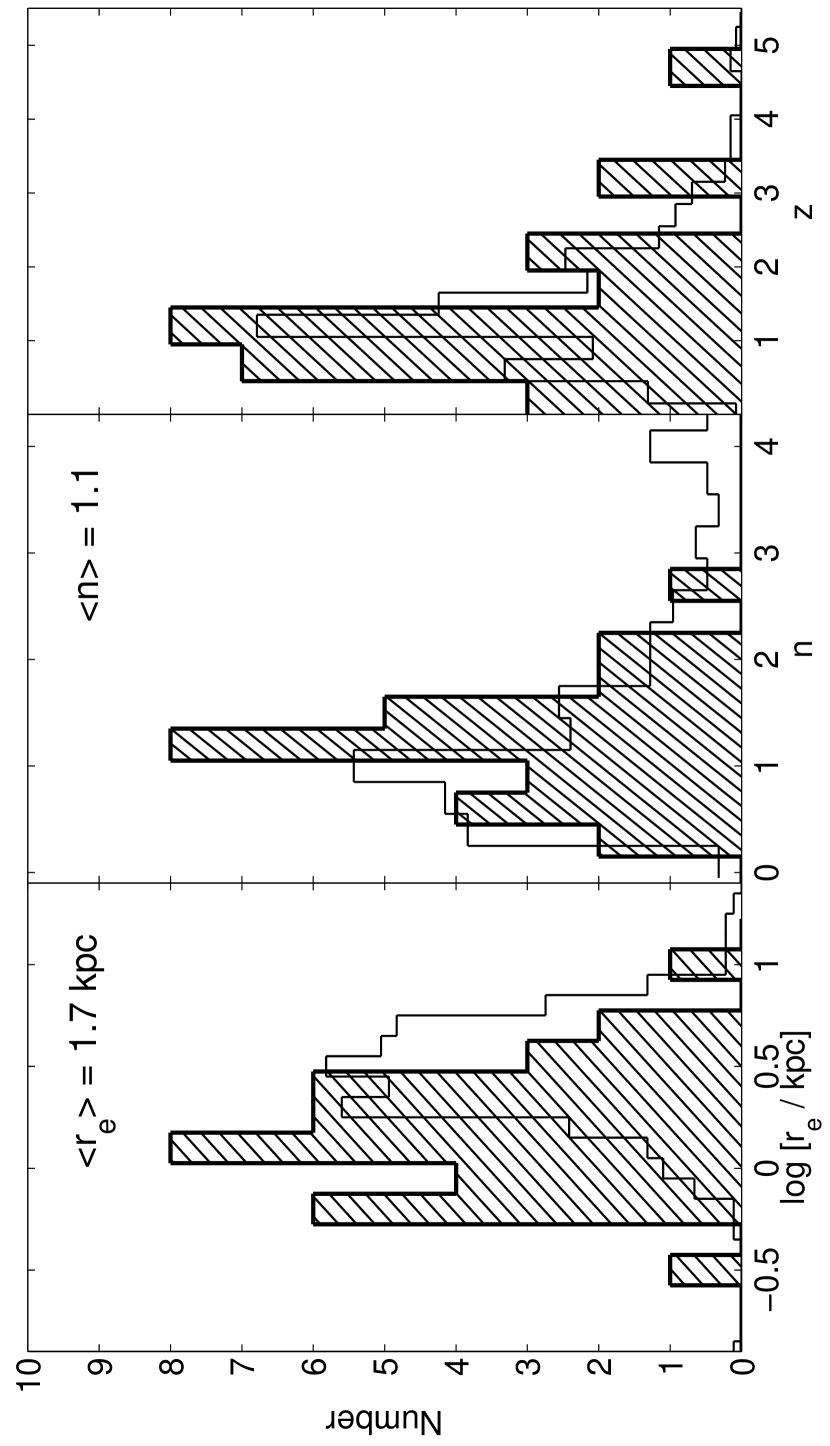
None of the well-resolved host galaxies with high signal-to-noise detections exhibit a clear profile, confirming their nature as disk and irregular galaxies. With the exception of the host galaxy of GRB 991208 all the galaxies are well-resolved relative to the instrumental point spread function as measured from stars in the field (Figures 3 and 4). We thus fit the surface brightness profiles of all systems with an exponential disk: , leaving the central surface brightness () and the scale length () as free parameters. We find that the scale length distribution peaks at , with a tail extending to .
For the host galaxies observed in multiple filters we find that about exhibit a color gradient as a function of radius (Figure 5), becoming redder at large radii. The single exception to this trend is the host galaxy of GRB 011121, which is somewhat bluer at larger radii. Since blue light traces recent star formation, the observed trend suggests that the star formation activity in GRB host galaxies is more concentrated than the overall light distribution. The trend observed for GRB 011121 may suggest that substantial star formation is taking place across the whole disk of the galaxy. While color information is not available for the host of GRB 990705, it too has fairly distributed star formation activity as shown by its spiral arm structure and bright knots.
Our second approach in studying the surface brightness profiles is to use the GALFIT software (Peng et al. 2002). This allows us to fit all but the most irregularly shaped galaxy (GRB 020405). In this case we use the generalized Sersic function (Sersic 1968)
| (1) |
where is the concentration parameter ( is equivalent to an exponential disk, while is the de Vaucouleurs profile), is a constant that is coupled to the value of , is the effective radius, and is the surface brightness333The length scale of the exponential disk defined above is related to the effective radius as , while . at . We generated point spread functions for the individual instruments and filters using the Tiny Tim software package444http://www.stsci.edu/software/tinytim/tinytim.html, assuming a power law spectrum , which is roughly appropriate for the observed color distribution of GRB host galaxies (Berger et al. 2003). In all cases we find adequate fits to the host galaxies, with per degree of freedom. We note that some sources, particularly at low signal-to-noise, can be adequately fit with a range of . For sources with complex morphology (e.g., XRF 020903) or contaminating point sources (e.g., GRB 011121) we use multiple components to account for substructure. The resulting values of and are listed in Table 1.
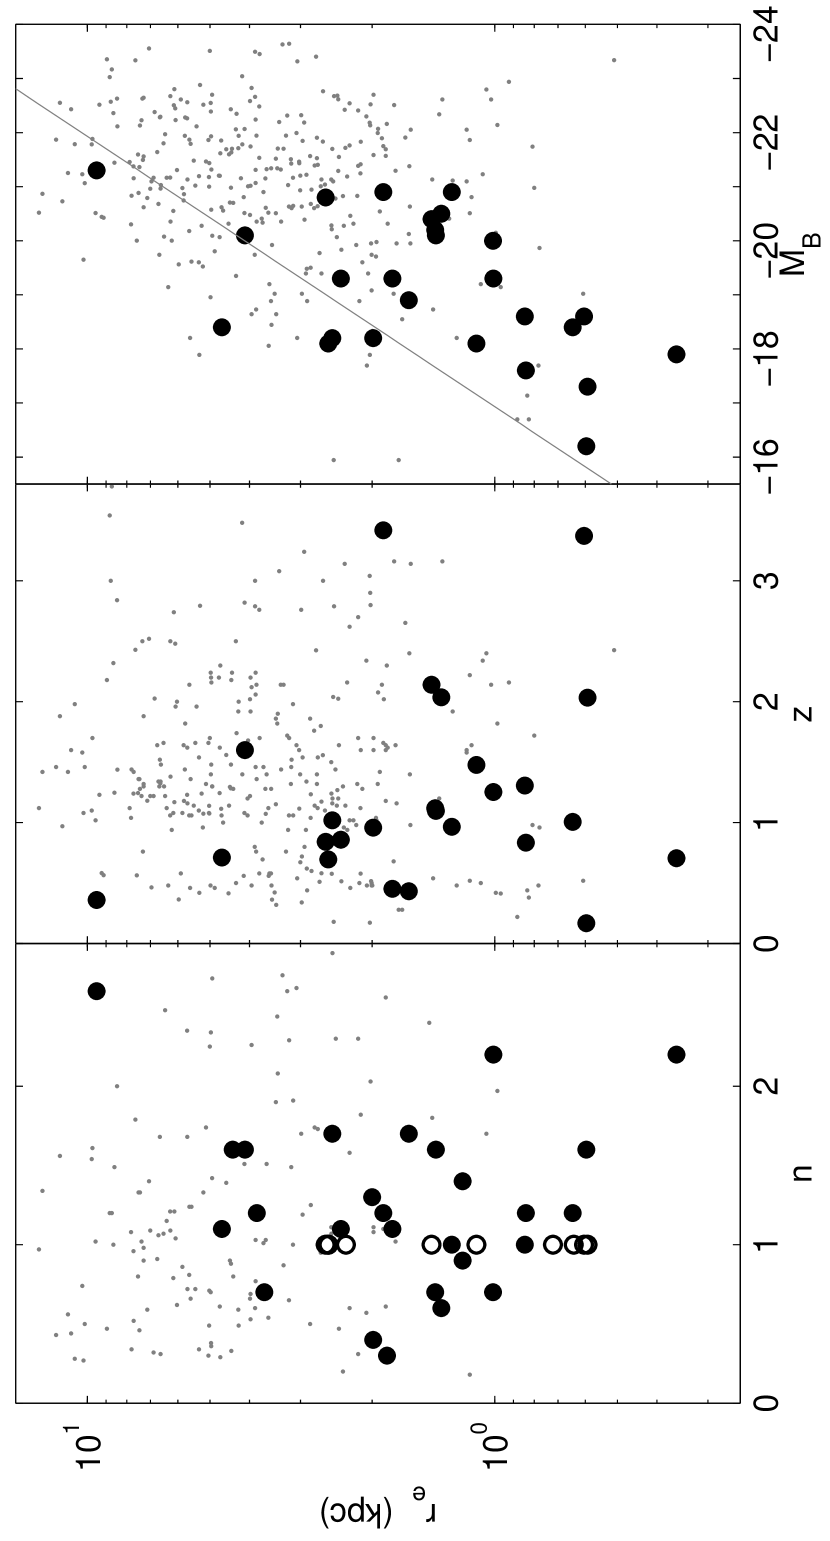
In Figure 6 we plot the distribution of and for the hosts with an accurate value of . For hosts without a known redshift we take advantage of the flat evolution of the angular diameter distance with redshift, and assume a value of kpc arcsec-1 appropriate for . The distribution of is strongly peaked around a value of , indicating that GRB hosts are well described as exponential disks. As noted in other studies (e.g., Ravindranath et al. 2004), is an efficient criterion for disk-dominated galaxies. The distribution of ranges from about 0.3 to 10 kpc, with a peak at kpc. As shown in Figure 7 we do not find any correlation between and or redshift, although we note that there is a larger dispersion in for . This may be a result of surface brightness dimming which would tend to make higher redshift objects appear more compact.
A comparison to the morphological analysis of galaxies in the FIRES data (Trujillo et al. 2004, 2005) suggests that the distributions of values are similar, with the exception that the latter exhibit a tail at (ellipticals) which may not present in the GRB sample. The distribution of effective radii, however, peaks at a large value compared to the GRB sample. To provide a direct comparison we corrected the values given in Trujillo et al. (2004) and Trujillo et al. (2005) for ellipticity and for the systematic over-estimate of about compared to GALFIT results (see Figure 4 of Trujillo et al. 2004). The median effective radius of the FIRES galaxies is about a factor of two higher than that of the GRB sample.
The underlying reason for the smaller sizes of GRB host galaxies is revealed in the correlation between the effective radius and the rest-frame absolute -band magnitude, (Figure 7). The slope of the correlation for GRB hosts is remarkably similar to the relation found by Freeman (1970) for local exponential disks, but with a surface brightness that is about mag arcsec-2 higher. This is similar to the results found from the FIRES data, with the exception that the FIRES galaxies are brighter (and hence larger).
5 Discussion
The sample of 42 GRB host galaxies imaged with HST yields several interesting trends. The host morphologies and surface brightness profiles indicate that GRB hosts are well described as exponential disks with sizes ranging from kpc. In addition, GRB hosts exhibit a large fraction of interactions or mergers, particularly when compared to galaxies of similar luminosity from other surveys (Conselice et al. 2003). With the exception of GRB 990705, the GRB hosts lack distinctive spiral structure despite having predominantly disk dominated surface brightness profiles.
As shown in §4 the bulk of the galaxies have exponential surface brightness profiles. There are a few minor exceptions in low signal-to-noise filters, as well as in the case of GRB 021004, for which we find an adequate fit with an profile using GALFIT; a fit with is equally adequate. Except for GRB 990705, and possibly GRB 990123, none of the GRB host galaxies exhibit clear signs of spiral structure. This includes in particular the several hosts at , for which such structures should be easily detected. Conselice et al. (2004) show that spiral and bar structures should be visible at redshifts as high as . The lack of ordered spiral structure in GRB hosts may point to a violent merger history which suppresses the emergence of spiral arms.
The observed size-luminosity correlation presented in Figure 7 is in good agreement with that observed in other galaxy samples (e.g., Trujillo et al. 2005). However, the GRB sample extends this relation to lower luminosities due to the availability of absorption redshifts which are not subject to the brightness limit for spectroscopy imposed on flux-limited surveys.
Three of the galaxies in our sample, GRBs 980703, 000418, and 010222, exhibit high luminosity at submillimeter and/or radio wavelengths (Berger et al. 2001; Frail et al. 2002; Berger et al. 2003). Contrary to the trend observed in submillimeter-selected galaxies (Chapman et al. 2003; Conselice et al. 2003), all three are highly symmetric and show no clear signs of interaction. Each was categorized as a blob-like galaxy, while GRB 980703 was additionally categorized as off-center. However, it has the most modest deviation of any of the off-center galaxies in our sample. In comparison, HST observations of submillimeter galaxies indicate a merger fraction of (Conselice et al. 2003) and a low percentage () of symmetrically shaped galaxies (Chapman et al. 2003). These three galaxies are also significantly bluer than the typical submillimeter-selected galaxies (Berger et al. 2003). Taken together, these properties suggest that the submillimeter and radio bright GRB hosts are a distinct population from the field submillimeter-selected galaxies.
However, on the whole, a large fraction of the GRB host galaxies show evidence of merging or interaction. About of our galaxies show evidence of merging. This proportion appears to be independent of both redshift and apparent magnitude. In other high redshift surveys, the proportion of interacting galaxies increases with galaxy brightness (Conselice et al. 2003). This discrepancy may be caused by one of several factors. First, it is possible that previous surveys have a selection bias against faint merging galaxies due to a flux limit. If this is the case, then previous surveys under-represent an important category of galaxy morphology. Alternatively, the general correlation between magnitude and frequency of merging galaxies could be correct, and some physical process causes GRBs to preferentially occur in faint merging systems, instead of bright ones, for example a preference for low metallicity . Overall, the high fraction of galaxies which show signs of merging and interaction indicate that these are regions of elevated star formation activity, and that GRBs are less likely to occur in stable disk galaxies.
References
- Arp (1966) Arp, H. 1966, ApJS, 14, 1
- Berger et al. (2003) Berger, E., Cowie, L. L., Kulkarni, S. R., Frail, D. A., Aussel, H., & Barger, A. J. 2003, ApJ, 588, 99
- Berger et al. (2001) Berger, E., Kulkarni, S. R., & Frail, D. A. 2001, ApJ, 560, 652
- Bloom et al. (2002) Bloom, J. S., Kulkarni, S. R., & Djorgovski, S. G. 2002, AJ, 123, 1111
- Chapman et al. (2003) Chapman, S. C., Windhorst, R., Odewahn, S., Yan, H., & Conselice, C. 2003, ApJ, 599, 92
- Christensen et al. (2004) Christensen, L., Hjorth, J., & Gorosabel, J. 2004, A&A, 425, 913
- Conselice et al. (2003) Conselice, C. J., Chapman, S. C., & Windhorst, R. A. 2003, ApJ, 596, L5
- Conselice et al. (2004) Conselice, C. J., et al. 2004, ApJ, 600, L139
- de Vaucouleurs (1948) de Vaucouleurs, G. 1948, Annales d’Astrophysique, 11, 247
- Driver et al. (1995) Driver, S. P., Windhorst, R. A., & Griffiths, R. E. 1995, ApJ, 453, 48
- Ellis (1997) Ellis, R. S. 1997, ARA&A, 35, 389
- Frail et al. (2002) Frail, D. A., et al. 2002, ApJ, 565, 829
- Freeman (1970) Freeman, K. C. 1970, ApJ, 160, 811
- Fruchter & Hook (2002) Fruchter, A. S., & Hook, R. N. 2002, PASP, 114, 144
- Hogg & Fruchter (1999) Hogg, D. W., & Fruchter, A. S. 1999, ApJ, 520, 54
- Hubble (1926) Hubble, E. P. 1926, ApJ, 64, 321
- Hubble (1936) Hubble, E. P. 1936, Yale University Press
- Johansson & Bergvall (1990) Johansson, L., & Bergvall, N. 1990, A&AS, 86, 167
- Peng et al. (2002) Peng, C. Y., Ho, L. C., Impey, C. D., & Rix, H. 2002, AJ, 124, 266
- Price et al. (2002) Price, P. A., et al. 2002, ApJ, 572, L51
- Ravindranath et al. (2004) Ravindranath, S., et al. 2004, ApJ, 604, L9
- Sandage (1961) Sandage, A. 1961, The Hubble atlas of galaxies (Washington: Carnegie Institution, 1961)
- Schlegel et al. (1998) Schlegel, D. J., Finkbeiner, D. P., & Davis, M. 1998, ApJ, 500, 525
- Sersic (1968) Sersic, J. L. 1968, Atlas de galaxias australes (Cordoba, Argentina: Observatorio Astronomico, 1968)
- Sirianni et al. (2005) Sirianni, M., et al. 2005, PASP accepted
- Stanek et al. (2003) Stanek, K. Z., et al. 2003, ApJ, 591, L17
- Trujillo et al. (2005) Trujillo, I., et al. 2005, astro-ph/0504225
- Trujillo et al. (2004) Trujillo, I., et al. 2004, ApJ, 604, 521
- van den Bergh (2002) van den Bergh, S. 2002, PASP, 114, 797
| GRB | Instrument | Filter | Exp. time | Date | AB Mag. | Classification | ||||
|---|---|---|---|---|---|---|---|---|---|---|
| (s) | (arcsec) | (kpc) | ||||||||
| 970228 | 0.695 | STIS | CL | 2300 | 1997 Sep 4 | 1 | 0.36 | 2.53 | 24.7 | D |
| 970508 | 0.835 | STIS | CL | 11568 | 1998 Aug 5 | 1.2 | 0.11 | 0.81 | 25.0 | BL |
| 970828 | 0.958 | WFPC2 | F606W | 3300 | 2001 Aug 16 | AS, MI | ||||
| C1 | 0.6 | 0.46 | 3.66 | 24.9 | ||||||
| C2 | 0.4 | 0.25 | 1.99 | 25.9 | ||||||
| C3 | 0.6 | 0.16 | 1.27 | 25.8 | ||||||
| 970828 | WFPC2 | F814W | 3300 | 2001 Aug 18 | ||||||
| C1 | 0.7 | 0.54 | 4.29 | 23.6 | ||||||
| C2 | 2.1 | 0.53 | 4.21 | 24.4 | ||||||
| C3 | 0.5 | 0.28 | 2.23 | 25.4 | ||||||
| 971214 | 3.418 | STIS | CL | 8540 | 2000 Jun 12 | 1.2 | 0.25 | 1.91 | 26.3 | AS |
| 980326 | STIS | CL | 7080 | 2000 Dec 31 | not detected | |||||
| 980329 | STIS | CL | 8012 | 2000 Aug 24 | 0.9 | 0.15 | 27.0 | AS, MI, TT | ||
| 980519 | STIS | CL | 8924 | 2000 Jun 7 | 1 | 0.32 | 27.4 | TF | ||
| 980613 | 1.097 | STIS | CL | 5792 | 2000 Aug 20 | 1.6 | 0.17 | 1.42 | 25.1 | AS, KN, MI |
| 980703 | 0.966 | STIS | CL | 5118 | 2000 Jun 18 | 1.0 | 0.16 | 1.29 | 22.7 | BL, OC |
| 981226 | STIS | CL | 7805 | 2000 Jul 3 | 1.2 | 0.48 | 25.2 | D, KN, MI | ||
| 990123 | 1.600 | STIS | CL | 5280 | 2000 Feb 7 | 24.4 | D, KN, MI, TT | |||
| knot | 1 | 0.18 | 1.58 | |||||||
| main | 1.6 | 0.48 | 4.14 | |||||||
| 990308 | STIS | CL | 7782 | 2000 Jun 19 | 1 | 0.09 | 28.8 | TF | ||
| 990506 | 1.307 | STIS | CL | 7856 | 2000 Jun 24 | 1.0 | 0.10 | 0.86 | 25.3 | BL |
| 990510 | 1.619 | STIS | CL | 5840 | 2000 Apr 29 | 1 | 0.08 | 0.72 | 27.7 | TF |
| 990705 | 0.842 | STIS | CL | 8792 | 2000 Jul 25 | 22.6 | D, KN | |||
| bukge | 4.0 | 0.10 | 0.78 | |||||||
| disk | 1 | 0.94 | 7.21 | |||||||
| 990712 | 0.433 | STIS | CL | 3720 | 2000 Apr 24 | 1.7 | 0.29 | 1.62 | 22.3 | D, KN, MI |
| C1 | 0.6 | 0.29 | 1.62 | |||||||
| C2 | 1.0 | 0.20 | 1.15 | |||||||
| 991208 | 0.706 | STIS | CL | 3840 | 2000 Aug 3 | 2.2 | 0.05 | 0.38 | 24.5 | BL, MI? |
| 991216 | 1.020 | STIS | CL | 4720 | 2000 Apr 17 | 1.7 | 0.31 | 2.48 | 23.6 | AS, TT |
| 000131 | 4.500 | WFPC2 | F606W | 8800 | 2001 Aug 20 | 28.0 | AS, MI | |||
| 000131 | WFPC2 | F814W | 8800 | 2001 Aug 17 | 25.7 | |||||
| C1 | 0.7 | 0.15 | 1.00 | |||||||
| C2 | 1.0 | 0.41 | 2.75 | |||||||
| 000301C | 2.034 | STIS | CL | 7031 | 2001 Feb 25 | 1 | 0.07 | 0.58 | 30.0 | TF |
| 000418 | 1.119 | STIS | CL | 5120 | 2001 Feb 11 | 0.7 | 0.17 | 1.38 | 24.7 | BL |
| 000926 | 2.037 | WFPC2 | F606W | 4400 | 2001 May 19 | 0.8 | 0.13 | 1.11 | 25.2 | MI, TT |
| 000926 | WFPC2 | F814W | 4400 | 2001 May 20 | 0.4 | 0.19 | 1.57 | 25.2 | ||
| 010222 | 1.477 | WFPC2 | F450W | 6000 | 2001 Sep 8 | 1 | 0.14 | 1.19 | 26.0 | BL |
| 010222 | WFPC2 | F606W | 6000 | 2001 Sep 8 | 1 | 0.11 | 0.95 | 26.2 | ||
| 010222 | WFPC2 | F814W | 6000 | 2001 Sep 9 | 1 | 0.15 | 1.31 | 26.2 | ||
| 010921 | 0.453 | WFPC2 | F450W | 4400 | 2001 Dec 21 | 1.1 | 0.27 | 1.55 | 22.6 | D |
| 010921 | WFPC2 | F555W | 4400 | 2001 Dec 21 | 1.1 | 0.29 | 1.64 | 22.1 | ||
| 010921 | WFPC2 | F702W | 4400 | 2001 Dec 22 | 1.2 | 0.31 | 1.80 | 21.6 | ||
| 010921 | WFPC2 | F814W | 4400 | 2001 Dec 22 | 1.1 | 0.33 | 1.88 | 21.4 | ||
| 010921 | WFPC2 | F850L | 4400 | 2001 Dec 22 | 1.0 | 0.31 | 1.80 | 21.3 | ||
| 011030 | STIS | CL | 7505 | 2002 Jun 12 | 0.3 | 0.23 | 24.9 | AS, OC | ||
| 011121 | 0.360 | WFPC2 | F450W | 4500 | 2002 Apr 21 | 2.6 | 6.48 | 32.4 | 24.1 | D |
| 011121 | WFPC2 | F555W | 4500 | 2002 May 2 | 2.6 | 3.13 | 15.6 | 23.4 | ||
| 011121 | WFPC2 | F702W | 4500 | 2002 Apr 29 | 2.7 | 2.51 | 12.5 | 22.5 | ||
| 011121 | WFPC2 | F814W | 4500 | 2002 Apr 29 | 2.6 | 1.88 | 9.4 | 22.2 | ||
| 011121 | WFPC2 | F850L | 4500 | 2002 May 2 | 2.6 | 1.88 | 9.4 | 21.9 | ||
| 011211 | 2.140 | STIS | CL | 4721 | 2002 Feb 9 | 26.6 | KN, MI | |||
| C1 | 1 | 0.17 | 1.43 | |||||||
| C2 | 1 | 0.10 | 0.84 | |||||||
| C3 | 1 | 0.06 | 0.55 | |||||||
| 020124 | STIS | CL | 7418 | 2002 Apr 6 | not detected | |||||
| 020127 | STIS | CL | 4868 | 2002 Apr 6 | 1 | 0.29 | 24.8 | OC | ||
| 020305 | STIS | CL | 6586 | 2003 Jan 20 | 1.4 | 0.15 | 25.7 | MI, OC, TT | ||
| 020321 | STIS | CL | 4916 | 2002 Jun 7 | 26.4 | MI | ||||
| C1 | 1 | 0.11 | ||||||||
| C2 | 1 | 0.16 | ||||||||
| C3 | 1 | 0.11 | ||||||||
| C4 | 1 | 0.06 | ||||||||
| 020322 | STIS | CL | 11375 | 2002 Jun 5 | not detected | |||||
| 020331 | STIS | CL | 7202 | 2002 Aug 18 | 1 | 0.08 | 25.9 | BL | ||
| 020405 | 0.698 | WFPC2 | F555W | 5900 | 2002 Aug 23 | 22.6 | AS, MI, TT | |||
| 020405 | WFPC2 | F702W | 5900 | 2002 Aug 23 | 21.9 | |||||
| 020405 | WFPC2 | F814W | 3900 | 2002 Jun 9 | 21.6 | |||||
| 020410 | STIS | CL | 8283 | 2003 Apr 18 | 1.1 | 0.23 | 24.3 | D? | ||
| 020410 | ACS | F606W | 3680 | 2002 Jul 24 | 1.2 | 0.26 | 24.2 | |||
| 020410 | ACS | F814W | 3680 | 2002 Jul 24 | 1.4 | 0.24 | 23.5 | |||
| 020427 | STIS | CL | 8100 | 2002 Oct 26 | 0.7 | 0.46 | 24.5 | D, MI, TT | ||
| 020813 | 1.254 | ACS | F435W | 2020 | 2003 Jul 21 | 3.4 | 0.10 | 0.84 | 24.4 | OC, TT |
| 1 | 0.08 | 0.63 | ||||||||
| 020813 | ACS | F606W | 1920 | 2003 Jul 21 | 2.2 | 0.11 | 0.92 | 24.2 | ||
| 1 | 0.10 | 0.84 | ||||||||
| 020813 | ACS | F814W | 3980 | 2003 Jul 21 | 2.1 | 0.13 | 1.09 | 24.0 | ||
| 1 | 0.12 | 1.05 | ||||||||
| 020903 | 0.251 | ACS | F606W | 1920 | 2003 Jun 30 | 21.0 | MI | |||
| C1 | 1.6 | 0.11 | 0.41 | |||||||
| C2 | 0.7 | 0.38 | 1.48 | |||||||
| C3 | 1 | 0.07 | 0.27 | |||||||
| C4 | 0.3 | 0.11 | 0.41 | |||||||
| 021004 | 2.323 | ACS | F435W | 2040 | 2003 Jul 26 | 3.8 | 0.06 | 0.46 | 24.3 | BL, OC |
| 1 | 0.05 | 0.42 | ||||||||
| 021004 | ACS | F606W | 1920 | 2003 May 31 | 3.5 | 0.05 | 0.42 | 24.3 | ||
| 1 | 0.05 | 0.42 | ||||||||
| 021004 | ACS | F814W | 1920 | 2003 Jul 26 | 6.9 | 0.06 | 0.50 | 24.4 | ||
| 1 | 0.04 | 0.33 | ||||||||
| 021211 | 1.006 | ACS | F435W | 1920 | 2004 Jan 2 | 1.1 | 0.08 | 0.64 | 26.3 | BL |
| 021211 | ACS | F606W | 1260 | 2004 Jan 5 | 1.2 | 0.07 | 0.56 | 25.5 | ||
| 021211 | ACS | F814W | 4000 | 2004 Jan 6 | 1.2 | 0.10 | 0.80 | 24.6 | ||
| 030115 | ACS | F435W | 8800 | 2003 Jun 16 | 3.2 | 1.02 | 25.4 | OC, TT, MI | ||
| 1 | 0.49 | |||||||||
| 030115 | ACS | F606W | 2000 | 2003 Feb 10 | 1.4 | 0.54 | 24.9 | |||
| 030115 | ACS | F814W | 1920 | 2003 May 22 | 1.9 | 0.56 | 24.3 | |||
| 030323 | 3.372 | ACS | F606W | 3486 | 2003 Dec 29 | 1 | 0.08 | 0.58 | 27.7 | BL |
| 030329 | 0.168 | ACS | F435W | 1920 | 2004 May 24 | 1.4 | 0.19 | 0.54 | 24.1 | OC |
| 030329 | ACS | F606W | 4000 | 2004 May 25 | 1.8 | 0.22 | 0.62 | 22.8 | ||
| 030329 | ACS | F814W | 2040 | 2004 May 24 | 2.1 | 0.28 | 0.78 | 22.7 | ||
| 040924 | 0.859 | ACS | F775W | 3932 | 2005 Feb 18 | 4.0 | 0.45 | 3.46 | 24.0 | OC |
| 1 | 0.26 | 1.96 | ||||||||
| 040924 | ACS | F850W | 3932 | 2005 Feb 19 | 1.1 | 0.31 | 2.39 | 23.8 | ||
| 041006 | 0.712 | ACS | F775W | 4224 | 2005 Feb 10 | 3.0 | 1.12 | 8.09 | 24.2 | AS |
| 1 | 0.42 | 3.06 | ||||||||
| 041006 | ACS | F850W | 4224 | 2005 Feb 11 | 1.1 | 0.65 | 4.68 | 24.1 | ||
Note. — Hubble Space Telescope data and morphological information for GRB host galaxies. The columns are (left to right): (i) GRB name, (ii) redshift, (iii) instrument, (iv) filter, (v) total exposure time of drizzled image, (vi) date of observation, (vii) Sersic parameter from GALFIT; note that a value of 1 indicates that was fixed as an exponential profile, while multiple entries indicate a fit with as a free and fixed parameter, (viii) effective radius in arcsec from GALFIT, (ix) effective radius in kpc from GALFIT (using ), (x) AB magnitude, (xi) morphological classification (see §3 for definitions).
| AS | KN | OC | TT | MI | DI | BL | TF | total galaxies | |
|---|---|---|---|---|---|---|---|---|---|
| 2 | 2 | 3 | 1 | 4 | 5 | 3 | 0 | 14 | |
| 4 | 3 | 2 | 4 | 5 | 1 | 5 | 2 | 16 | |
| unknown | 2 | 1 | 4 | 4 | 4 | 3 | 1 | 2 | 12 |
| Total | 8 | 6 | 9 | 9 | 13 | 9 | 9 | 4 | 42 |
Note. — Summary of morphological classification for the GRB host galaxy sample (see §3 for definitions).