The dependence on environment of Cold Dark Matter Halo properties
Abstract
A series of high-resolution CDM cosmological N-body simulations are used to study the properties of galaxy-size dark halos as a function of global environment. We analyse halos in three types of environment: “cluster” (cluster halos and their surroundings), “void” (large regions with density contrasts ), and “field” (halos not contained within larger halos). We find that halos in clusters have a median spin parameter times lower, a minor-to-major axial ratio times lower (more spherical), and a less aligned internal angular momentum than halos in voids and the field. For masses , halos in cluster regions are on average more concentrated and have times higher central densities than halos in voids. While for halos in cluster regions the concentration parameters decrease on average with mass with a slope of , for halos in voids these concentrations do not seem to change with mass. When comparing only parent halos from the samples, the differences are less pronounced but they are still significant. We obtain also the maximum circular velocity– and rms velocity–mass relations. These relations are shallower and more scattered for halos in clusters than in voids, and for a given circular velocity or rms velocity, the mass is smaller at than at for all environments. At , the differences in the halo properties with environment almost dissapear, suggesting this that the differences were stablished mainly after . The halos in the cluster regions undergo more dramatic changes than those in the field or the voids. The differences in halo properties with environment are owing to (i) the dependence of halo formation time on global environment, and (ii) local effects as tidal stripping and the tumultuos histories that halos suffer in high-density regions.
We calculate seminumerical models of disk galaxy evolution using halos with the concentrations and spin parameters found for the different environments. For a given disk mass, the galaxy disks have higher surface density, larger maximum circular velocity and secular bulge-to-disk ratio, lower gas fraction, and are redder as one goes from cluster to void environments. Although all these trends agree with observations, the latter tend to show more differences, suggesting this that physical ingredients not considered here as missalignment of angular momentum, halo triaxility, merging, ram pressure stripping, harassment, etc. play an important role for galaxy evolution, specially in high-density environments.
1 Introduction
The understanding of formation and evolution of cosmic structures in the Universe is a fundamental problem in astrophysics as well as an observational testbed for cosmological, particle and high-energy physical theories. The current paradigm in this topic is the inflationary motivated Cold Dark Matter (CDM) hierarchical scenario. According to this scenario, the backbone of galaxy formation and evolution are the CDM halos, which emerge from a Gaussian primordial density fluctuation field and assemble through gravitational processes. The CDM scenario succesfully reproduces most of cosmological observational data, from the angular anisotropies of Cosmic Microwave Radiation to galaxy clustering (see for a review Frenk, 2002). The confrontation of models and observations at the level of galaxies is more difficult due to the complexity of the baryonic processes such as gas cooling, hydrodynamics, star formation (hereafter SF), and feedback. Several approaches have been introduced to model these processes in the context of the CDM scenario and their results are encouraging, however, some difficulties still remain (see for a review Firmani & Avila-Reese, 2003). To gain insight on galaxy formation and evolution, as well as on the galaxy observables that can be used directly to test the CDM scenario, one should identify which galaxy properties are clean tracers of CDM halo properties. The comparison of the dependences on global environment of both the simulated CDM halo and the observable galaxy properties may shed ligth on this undertaking.
1.1 Observational dependences of galaxy properties on environment
It is well known that several galaxy properties vary as a function of environment. The morphologycal type of galaxies is earlier in the locally denser regions (morphology-density relation), being the fraction of ellipticals maximal in cluster cores (Dressler, 1980) and enhanced in rich (Postman & Geller, 1984) and poor (Tran et al., 2002; Tovmassian et al., 2004) groups. An even tighter correlation has been found between morphology and cluster- or group-centric radius (Whitmore et al., 1993; Domínguez et al., 2002). The extension of the morphology-density and morphology-radius relations to low local-density environment (cluster outskirts, low mass groups, field) has been a matter of debate (e.g., Postman & Geller, 1984; Domínguez et al., 2002). From an analysis of SDSS data, Goto et al. (2003) have found that (i) in the sparsest regions both relations flatten out, (ii) in the intermediate density regions (e.g., cluster outskirts) the intermediate-type galaxy (mostly S0s) fraction increases towards denser regions whereas the late-type galaxy fraction decreases, and (iii) in the densest regions intermediate-type fraction decreases radically and early-type fraction increases. In a similar way, an study based on 2dF data of the luminosity functions in clusters and voids show that the population of faint late-type galaxies dominates in the latter, while, in contrast, very bright early-late galaxies are relatively overabundant in the former (Croton et al., 2005). These an other studies (e.g., Domínguez et al., 2001) suggest that the origin of the morphology-density (or morphology-radius) relation could be a combination of (i) initial cosmological conditions and (ii) of external mechanisms (ram-pressure and tidal stripping, thermal evaporation of the disk gas, strangulation, galaxy harashment, truncated SF, etc.) that operate mostly in dense environments, where namely the relation steepens significantly.
The morphology-environment relation evolves. It systematically flattens with in the sense that the grow of the early-type (E+S0) galaxy fraction with density becomes less rapid (Treu et al., 2003; Smith et al., 2004; Goto et al., 2004; Postman et al., 2005), the main change being in the high-density population fraction. Postman et al. conclude that the observed flattening of the relation up to is due mainly to a deficit of S0 galaxies and an excess of Sp+Irr galaxies relative to the local galaxy population; the E fraction-density relation does not appear to evolve over the range .
Observational studies show that other properties besides morphology vary with environment locally (e.g., Dressler et al., 1985; Giovanelli & Haynes, 1985; Zabludoff & Franx, 1993). More recently it was shown that the galaxy properties most sensitive to environment are the integral colour and specific SF rate (e.g., Balogh et al., 1998, 2004; Kodama et al., 2001; Tran et al., 2001; Pimbblet et al., 2002; Gómez et al., 2003; Lewis et al., 2002; Kauffmann et al., 2004; Hogg et al., 2004; Tanaka et al., 2004), the steepest correlation being for intermediate mass galaxies (Kauffmann et al., 2004) or faint galaxies (Tanaka et al., 2004). The dependences of both properties on environment extend typically to lower local densities than the dependence for morphology. These properties are tightly related to the galaxy SF history, which in turn depends on internal formation/evolution processes related directly to initial cosmological conditions (e.g., Kauffmann et al., 1993; Baugh et al., 1996; Somerville & Primack, 1999; Avila-Reese & Firmani, 2000) as well as to external astrophysical mechanisms able to inhibit or induce SF activity. It is difficult to disantangle the role of these internal or external factors, in particular in the densest environments. An analysis of the influence of environment on the CDM halo properties and their evolution certainly would help to understand the role of initial conditions.
There are also some pieces of evidence that the scale lenghts of spirals in clusters are systematically smaller than those of spirals in the field (Aguerri et al., 2004). Besides, it was shown that the fraction of low surface brightness (LSB), blue galaxies increases toward low-density environments (e.g., Bothun et al., 1993; Rojas et al., 2004), mainly in the outskirts of filamentes and in voids (Rosenbaum & Bomans, 2004). The LSB galaxies may have formed in halos with high and well-aligned angular momentum (e.g., Dalcanton et al., 1997; Firmani & Avila-Reese, 2000; Avila-Reese & Firmani, 2000; Boissier et al., 2003) and/or have had a low SF rate history in comparison with high surface brightness galaxies due to their low-density environment. To explore which one of these processes dominate it would be helpful to know if there are any differences in the halo angular momentum distribution and its alignment between voids and other environments.
1.2 Theoretical results and expectations
From the analysis of a box simulation with a particle mass of , Avila-Reese et al. (1999) found that the outer density profiles of galaxy-size halos in cluster cores decline sharper and their concentrations are higher than for “field” halos (see also Ghigna et al., 1998; Okamoto & Habe, 1999; Klypin et al., 1999; Bullock et al., 2001a). The last authors explored also the differences in concentration between distinct or parent halos (halos not contained within larger ones) and subhalos (halos contained inside larger halos), with the result that the latter have typically larger concentrations than the former. As suggested by the referee, one should differentiate the effect of the “local” environment, which is simply due to a halo being subhalo, from the global (large-scale) environment. Some dependence of the halo mass-circular velocity relation on global environment was also reported by Avila-Reese et al. (1999).
Lemson & Kauffmann (1999) explored how halo mass function, formation redshift, concentration, shape and spin parameter change with the density contrast of the local halo environment. The particle mass in their simulations was or more. They found that only the mass function varies with environment, suggesting that any dependence of observable galaxy properties on environment can be established because only the halo mass influences on these properties. Antonuccio-Delogu et al. (2002) used constrained initial conditions in order to produce in the same box two extreme environments, a void and two clusters (the particle mass of their simulation was ). They found some differences in the distribution of the spin parameter and the mass-velocity dispersion relation between cluster and void environments.
A general conclusion of all previous numerical works is that present-day CDM halo properties and correlations do not strongly change with global environment. However, as mentioned above, some influence of environment on halo properties and correlations has been reported. Halos in dense environments, as clusters, are expected to collapse earlier than halos in less dense environments. Besides, halos in the high density environments suffer tidal stripping and frequent violent mergers. It is still an open issue the extent of the influence of environment on halo properties as well as its potential effects on the baryonic galaxies which form within these halos.
In this paper we will analyze high-resolution simulations of extreme environments, namely selected cluster and void regions, and compare the properties and correlations of the galaxy-size CDM halos from these simulations, both at redshift and . Our aim is to explore to what extent the CDM halo properties that affect observable galaxy properties change with the global environments. We will analyze also distinct galaxy-size halos (“field” halos) and compare them with those in the cluster and void simulations.
Seminumerical and semianalytical models have shown that most of the properties and correlations of galaxies formed within CDM halos depend on (i) the halo mass aggregation history (MAH) and its dominating regime (accretion or merging) as well as on the halo concentration that is determined mainly by the MAH (in particular the typical formation time) for a given mass, (ii) the halo spin parameter and angular momentum distribution, and (iii) the halo mass function (e.g., Kauffmann et al., 1993; Baugh et al., 1996; Mo et al., 1998; Avila-Reese & Firmani, 2000; Firmani & Avila-Reese, 2000; van den Bosch, 2000). The dependence on environment of the halo mass function has been extensively analyzed in numerical works (Lemson & Kauffmann, 1999; Gottlöber et al., 2003; Mo et al., 2004). Our comparative study here will be focused on some halo structural and angular momentum parameters: concentration, central density, shape, spin parameter, and the angular momentum internal alignment. Elsewhere we will present results related to halo evolution (MAH) depending on environment (see also Gardner, 2001; Gottlöber, Klypin & Kravtsov, 2001).
In §2 we describe the method and simulations carried out and present the halo samples to be analyzed. In §§3.1 several concentration parameters as well as the central density of halos from the different environments (samples) are presented and disscused for and . The ellipticity distribution function of halos for the different samples is computed in §§3.2. Section 4 is devoted to the analysis of the spin parameter and internal angular momentum alignment of halos as a function of environment. In §5 we present and discuss the maximum circular velocity– and velocity dispersion–mass relations of halos in the different environments. In §6 we discuss the implications that the differences in the halo properties as a function of environment can have on the properties of the disks formed inside these halos. A summary of the results and our main conclusions are given in §7.
| simulation | Box | Npart | Mass resolution | Force resolution | |
|---|---|---|---|---|---|
| (Mpc) | (M⊙) | (kpc) | |||
| Full box | |||||
| 80 | 80 | 9.8 | 50 | ||
| 60A | 60 | 2.0 | 35 | ||
| 60B | 60 | 2.0 | 35 | ||
| 50 | 50 | 6.2 | 60 | ||
| Multiple mass | |||||
| Clall | 80 | 2.4 | 50 | ||
| Cl | 80 | 0.6 | 50 | ||
| 80 | 1.2 | 50 | |||
| 50 | 0.8 | 60 |
2 Method and simulations
In our numerical simulations we adopt the flat cosmological model with a non-vanishing cosmological constant (CDM) using the following cosmological parameters: , , and . The matter power spectrum is normalized to , where is the present linear rms amplitude of mass fluctuations in spheres of radius 8Mpc.
The simulations were run with the Adaptive Refinement Tree (ART) code (Kravtsov et al., 1997). The ART code achieves high spatial resolution by refining the base uniform grid in all high-density regions with an automated refinement algorithm. Initial conditions have been calculated either with the transfer function given by Klypin & Holtzman (1997) (boxes of 60 and 80 Mpc) or using the numerical results of the Boltzmann code kindly provided by W. Hu. Up to a few percent both transfer functions coincide and at the same level they coincide also with the transfer function provided by CMBfast. For the multiple mass simulations we have used the mass refinement technique described by Klypin et al. (2001).
The halos are identified by the Bound Density Maxima (BDM) algorithm (Klypin & Holtzman, 1997; Klypin et al., 1999). The BDM algorithm first finds positions of local maxima in the density field. Once centers of potential halos are found, the algorithm identifies halos around them and removes particles which are not bound to those halos. This procedure also detects subhalos of larger objects – halos inside halos (for example, satellites of galaxies or galaxies in clusters). Particles of a subhalo are bound to both the subhalo and to the larger halo.
Our study is focused on the analysis of the properties of galaxy-size CDM halos formed in two extreme environments: the high density environment of clusters and the low density environment of voids. To this end we have at first performed simulations with low mass resolution. However, already for this simulation the initial displacements and velocities of the particles were calculated using all waves ranging from the fundamental mode to the Nyquist frequency , where corresponds to the maximum possible mass resolution (cf. Table 1). To get the initial conditions of the low resolution run we merge particles to a more massive one. After running an inexpensive simulation with the resulting particles we can select regions of interest. Then we use the original sample of small-mass particles to resimulate the regions of interest using the multi-mass technique described in Klypin et al. (2001).
As high density regions we have selected spheres centered on 14 clusters. The radius of these spheres was typically about three virial radii of the cluster. Thus a significant fraction of resimulated halos are not within the virial radius of one of the clusters, but these halos are in the high-density environment around clusters. Voids have been selected as described in Gottlöber et al. (2003). The radius of resimulation area centered on voids has been taken typically about 10% smaller than the estimated void radius to be sure that no massive objects around the low density region will enter the region with high mass and force resolution, otherwise all the integration time would be allocated to such a massive object. We have performed high resolution simulations of selected regions in a 80 Mpc box and in a 50 Mpc box (simulations 80 and 50, respectively). For comparison purposes, we have also analyzed a sample of galaxy-size “field” halos from two 60Mpc box simulations with the same cosmological parameters as simulation 80 (simulations 60A and 60B). The parameters of the simulations are summarized in Table 1. The brackets around the particle numbers denote that all low mass particles were merged outside the regions of interest.
The “field” halos in the 60Mpc box are those called distinct or parent, i.e. halos which are not contained inside larger halos (Avila-Reese et al., 1999; Bullock et al., 2001a). Most of the parent halos are truly isolated (); the rest are mostly ’binary’ halos, i.e. with companions of masses larger than 1/3 the mass and within distances up to 3 times the radius of the given halo.
2.1 The halo samples according to the environment
From the simulations described above, we have five independent subsamples of halos (see Table 2): two cluster subsamples selected from simulation 80, one made up of halos from the very high-resolution run Cl, and the other built from the sum of the halos belonging to the 14 clusters, Clall; both subsamples constitute the CLUSTER sample, where of the galaxy-size halos are parent (those outside the clusters), and are subhalos (mostly those within the cluster virial radii); two void subsamples, one consisting of halos from the simulation , and the other built of halos from the 5 voids resimulated from the 80 simulation, ; boths subsamples constitute the VOID sample, where more than of the galaxy-size halos are parent ones; one FIELD halo sample composed of two subsamples of galaxy-size parent halos from both the 60A and 60B simulations.
Column (2) of Table 2 gives the number of regions (clusters or voids) in each (sub)sample resimulated with high resolution; this does not apply for the FIELD sample, where all the parent galaxy-size halos in the boxes are taken into account. The number of halos with more than 500 particles in each one of the samples is given in column (3). We set an upper limit mass of for that we define as a galaxy-size halo. In column (4) we give an estimate of the density contrast [] of our different environments. For the samples where several regions were used (Clall and ), the mean of the density contrasts and the standard deviation are reported; for the “field” halos, the density contrast is around zero. The mean halo mass ( particles) and the median spin parameter of each sample are given in columns (5) and (6), respectively.
Finally, we note that in multimass simulations we discard the halos contaminated by massive particles if their fraction is larger than 5% of the total halo mass. Also fake halos (recognized by a too low central density or flat or decreasing density profiles toward the center) have been removed; the criteria to remove these halos are a density in the central bin below h2M⊙Mpc-3 and/or similar or increasing with radius densities in the the first 5 radial bins. To study the spin parameter distribution we demand a halo to have a minimum of 500 particles. For concentration and central density determinations we demand more than 2500 particles.
| sample | contrast | ||||
|---|---|---|---|---|---|
| (M⊙) | |||||
| Clall | 14 | 421 | 0.024 | ||
| Cl | 1 | 318 | 44.7 | 0.024 | |
| 5 | 333 | 0.030 | |||
| 1 | 249 | -0.85 | 0.033 | ||
| FIELD | .. | 2990 | 0.033 |
3 Structural properties
The virialized CDM halos present a diversity of spherically averaged density profiles (Avila-Reese et al., 1998, 1999; Jing, 1999; Tasitsiomi et al., 2004) that cluster around the Navarro, Frenk & White (1997; hereafter NFW) fit. High-resolution simulations show that in the center the density profile is typically steeper than the NFW profile (Moore et al., 1999; Klypin et al., 2001; Power et al., 2003; Navarro et al., 2004). Unfortunately, there is not still a clear theoretical understanging of the origin of the CDM halo density profiles (see for some interesting results Manrique et al., 2003, and more references therein). Several works have shown that the shape of the profiles or their concentration parameter if they are fitted by a NFW profile –which is not always a good fit, depend on the halo MAH (Avila-Reese et al., 1998; Firmani & Avila-Reese, 2000; Wechsler et al., 2002) or even on the cosmological initial conditions (Avila-Reese et al., 2003). It was shown in Avila-Reese et al. (1999) that the outer density profile of CDM halos change with environment. Following, we will explore whether or not the halo concentrations, central density, and internal shape alignment change with environment.
3.1 Concentrations and inner density
We construct spherically averaged density profiles for all the halos studied here. We can roughly characterize the profiles by a concentration parameter only, because the profiles have approximately similar shapes. The use of one parameter allows us to attain an easy statistical comparison between VOID, CLUSTER and FIELD samples. In the CDM hierarchical scenario one expects that the concentration of halos will be typically higher for less massive halos, because they assemble most of their mass earlier than larger mass halos (e.g., NFW).
For the NFW profile, the concentration is defined as , where is the virial radius and the radius where lnln (NFW). The virial radius is defined as the radius where the average halo density is times the background density according to the spherical top-hat model. The parameter depends on epoch and cosmological parameters (,); for a flat CDM model, and 203 at and , respectively. As mentioned above, not all halos can be well fitted by a NFW profile. One may introduce a concentration parameter that does not depend on a particular fitting profile, for example the c1/5 concentration defined as , where is the radius where 1/5 of the virial mass is contained.
For both the cNFW and c1/5 concentrations one needs to measure . On one hand, this is not possible for a large fraction of subhalos because they are typically truncated at a radius . On the other hand, both cNFW and c1/5 trace the global halo concentration, while galaxies form only in the inner parts of the halos. Thus, it is desirable to introduce a concentration parameter whose definition is independent of the virial radius, and which measures concentration in the inner/intermediate halo regions. We introduce here the concentration parameter cδ. To calculate cδ, we find the radii within which the halo average density is equal to and times the background density, respectively, and compute the enclosed mass within these radii. The ratio of these masses is cδ. For NFW profiles in the range of galaxy-size halos, the typical radii where the halo overdensities become and are in the range of , respectively, tracing therefore the inner to intermediate regions. For example, for cNFW=12, these radii are 0.11 and 0.35, respectively, and the ratio of the masses enclosed within these radii is cδ=0.33. We define formally the truncation radius as the radius where the outer density profile begins to systematically flatten out or increase (d/d). The radius of the halo, is defined as the minimum beetwen and . The mass enclosed within is the halo mass .
According to our resolution tests, halos with more than particles are needed in order to estimate reliable concentration parameters. This leaves us with halos more massive than M⊙ and M⊙ in the void and cluster Clall samples, respectively. Since the voids are defined in such a way that they contain only halos less massive than M⊙ (Gottlöber et al., 2003), the ranges of masses in both samples do not overlap and our comparisons should be based on extrapolations of the mass-concentration dependences. However, we have one cluster resimulated with the same resolution as the voids, Cl. Therefore, in this simulation the halos resolved with more than 2500 particles have masses larger than M⊙. There is also a void simulation, , for which halos resolved with more than 2500 particles have masses larger than M⊙, allowing us to expand the range of masses of void halos.
3.1.1 Results at z=0
Upper panel of Fig. 1 shows cNFW vs for the VOID (circles), Clall (crosses), Cl(squeletal triangles) and FIELD (dots) non-truncated halos with an acceptable NFW profile fit. Non-truncated halos are those that attain the virial radius without any systematical flattening or increasing of the outer density profile. They are mostly parent halos. The quality of the NFW fit is evaluated roughly through the variance of the fit divided by the weighted average of the individual variances of the data (each radial bin is assigned a weight according to the number of particles inside it). Since the fit is in logarithmic variables, the root square of this quantitiy can be interpreted as a measure of the logarithmic difference between the model fit and the data. The latter can be expressed as a percentage deviation; from visual inspections, we have found that an acceptable NFW fit to the density profile is when this deviation is less than . More than 80% of the non-truncated halos obey this condition. The parent halos in the CLUSTER sample are highlighted with an open square. As expected, most of the non-truncated halos are parent ones. In the VOID sample, more than 95% of the halos with more than 2500 particles are parent ones, then, we do not highlight these halos in the figures in order to avoid overplotting. The FIELD sample has been constructed only with parent halos.
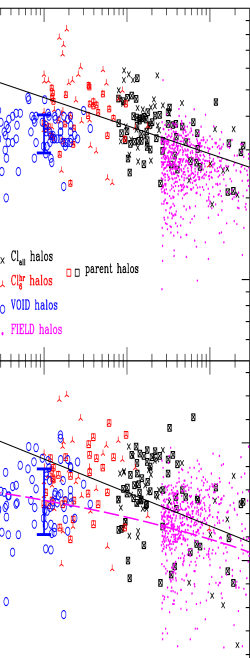
In the lower panel of Fig. 1, we show c1/5 vs. using the same symbols than in the upper panel. We recall that the definition of c1/5 is not related to any postulated density profile. Therefore, in the lower panel halos with non-acceptable NFW fits are also included. In Fig. 2 we present cδ vs (upper panel), and vs (lower panel) with the same symbol code as in Fig. 1. The parameter is a characteristic inner density measured at the radius where the slope of the logarithmic density profiles becomes . The definitions of the concentration cδ and of do not depend on , therefore, in Fig. 2 both truncated and non-truncated halos are included.
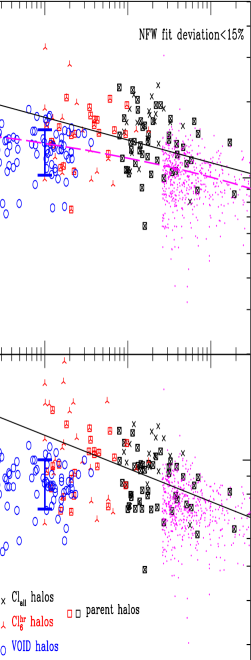
The concentration parameters and the central density systematically decrease with mass for the CLUSTER sample. In all the cases the scatter is large and the correlations are weak. The Pearson correlation coefficients of the linear regressions (in logarithmic variables) are between -0.35 and -0.55. As a reference, in Table 3 the parameters of the direct linear regressions are given. We also report the global dispersion of each linear regression, . If the scatter is Gaussian distributed (lognormal in linear variables) and independent of mass, then represents the 1 (68%) variation of (log) at any mass, where is one of the concentration parameters or . By multiplying by 2.3, one get the width of the lognormal distribution (in natural logarithm), .
Solid lines in Figs. 1 and 2 indicate the linear regresions to the Clall+Cl(CLUSTER) sample data. The slopes of the regressions for cNFW and c1/5 are shallow. If we take into account all the halos, and not only those that are well fitted by the NFW profile, then the slope for cNFW vs is steeper, , but the scatter becomes larger (from to 0.17). Note that a significant fraction of the halos in the cluster simulations () are outside the virial radii of the cluster halos, i.e. they are not subhalos, but are in any case in overdense regions.
The cδ parameter is independent of the definition of the halo radius (virial or truncation); in this sense, cδ is a more direct estimator of halo mean (inner) concentration, and it allows to include almost all the subhalos in the sample. As Fig. 2 and Table 3 show, for halos in CLUSTER sample, cδ on average decreases as increases. This confirms the decreasing of the physical concentration of halos/subhalos in dense environments as their masses (virial or truncated) increase.
The dispersions of the linear regressions presented in Table 3 give an estimation of the scatter of the concentration parameters and . As Bullock et al. (2001a) found, the scatter for cNFW does not depend significantly on mass and it has a lognormal distribution. These authors report that the 1 deviation of (logcNFW) is 0.18 for distinct halos, and 0.24 for subhalos (the correct values are actually 0.14 and 0.18, respectively, J. Bullock, private communication). In the understanding that the dispersion reported in Table 3 is similar to the 1 deviation of (logcNFW) (see above), we find that the scatter of cNFW for our prunned CLUSTER sample (including both parent halos and subhalos) is similar to that of the distinct halos at all environments in Bullock et al. (2001a); by including halos with density profiles not well fitted by the NFW model (as in Bullock et al., 2001a), the scatter of the CLUSTER sample increases to 0.17. By separating the prunned sample in parent halos and subhalos, the 1 variations of (logcNFW) are 0.12 and 0.17, respectively. We have calculated also the value of the 1 deviation of (logcNFW) in a range of masses from for the halo/subhalo sample; the value is the same than that found through the linear regression to all the mass range, 0.13.
For the VOID (low mass) halo sample we do not find any trend of cNFW, c1/5, cδ, and with mass, although the range of masses studied is too small to claim for definitive conclusions. It seems that the halo assembling process in low-density environments is so slow, constant and late that a posible mass-formation epoch relation (Lacey & Cole, 1993; Avila-Reese et al., 1998) loses sense; the dependence of concentration on mass is attributed to this relation (e.g., NFW). In the case of halos in VOID sample, almost all of them are parent ones. The error bars in the left sides of Figs. 1 and 2 represent the (logarithmic) 1 dispersions of cNFW, c1/5, cδ and for the VOID sample (see also Table 3 for roughly the same results). Since there is no dependence of these quantities on mass, the abscise of the bars is arbitrary. The scatters of the concentrations and in the VOID halo sample are significantly smaller than the ones in the CLUSTER sample. For example, the 1 variation of (logcNFW) is 0.09 for the former sample compared to 0.13 for the latter one. If one takes into account only the parent halos, then the scatters are 0.09 and 0.12, respectively. Therefore the difference in the scatter of cNFW between the VOID and CLUSTER halo samples is mainly due to a (global) environmental effect. The same applies for the scatters of the other concentration parameters and .
The concentrations and of the FIELD (parent) halos tend to decrease with mass, but the trends are shallower than for the CLUSTER halo sample. We notice that the trends of cNFW and c1/5 with for our FIELD sample are shallower than those reported for isolated halos in previous works, where was used (Avila-Reese et al., 1999; Bullock et al., 2001a), at least in the range of masses explored here. In Figs. 1 and 2 we show a toy-model prediction for cNFW and (long-dashed lines) following Eke, Navarro, & Steinmetz (2001) for the same cosmological parameters than in our simulations and . The toy model for cNFW was normalized to a set of isolated halos in a wide range of masses (re)simulated with very high resolution (Eke, Navarro, & Steinmetz, 2001). The toy model roughly agrees with our FIELD halo results.
Interestingly, studies aiming at infering the halo cNFW concentration from galaxy observables show that the slope of the relation is significantly steeper for halos of elliptical galaxies (e.g., Sato et al., 2000), which are localized typically deep inside the clusters, than for halos of spiral galaxies (Jimenez, Verde & Oh, 2003), which are localized in less dense environments.
Our main interest here is to compare the properties of halos in low and high-density environments. From Figs. 1 and 2, one concludes that the concentrations and of the VOID sample are lower on average than those of the CLUSTER sample, although the scatter in both samples is large. In fact this conclusion is based mostly on extrapolations of trends because the VOID and CLUSTER samples almost do not overlap in mass. At M⊙, the concentrations cNFW, c1/5 and cδ are on average 40% smaller for halos in the VOID sample than for halos in the CLUSTER sample, and the inner density is on average two times lower for the former than for the latter. For larger masses, all these differences reduce. There are also differences in the scatters: they are larger for the CLUSTER sample than for the VOID and FIELD ones (see Table 3).
The halos from the FIELD sample also tend to have on average lower concentrations and central density than those halos from the CLUSTER sample, although the differences are smaller than those between VOID and CLUSTER halos, in particular for . If we assume that the prediction for cNFW given by the Eke, Navarro, & Steinmetz (2001) toy-model is a good fit to our FIELD sample data, then its extrapolation to lower masses shows that the difference in cNFW between FIELD and CLUSTER halos remains roughly the same (Fig. 1). For , the difference seems to increase at lower masses (Fig. 2).
We have also compared only the parent halos from the CLUSTER sample with those from the VOID and FIELD samples. The differences in concentrations and become less pronounced than in the case when the subhalos were included. The slopes of the cNFW, c1/5, cδ and vs mass relations for the CLUSTER parent halos reduce to -0.07, -0.06, -0.07 and -0.16, respectively (to be compared with those given in Table 3), becoming closer to those of the FIELD sample, but still steeper. As expected, cδ changes more than cNFW and c1/5 because the definition of the latter concentrations imply that the halos should be non-truncated, and the non-truncated halos are mostly parent ones, so that the fraction of CLUSTER subhalos in Fig. 1 is small in any case. We have also compared the concentrations and of the very few subhalos from the VOID sample with the extrapolations of these parameters to the corresponding masses from the CLUSTER subhalo sample. All the VOID subhalo concentrations and lie below the corresponding extrapolations from the CLUSTER subhalos.
Our results show that halos in dense environments are on average more concentrated, with higher central densities and with larger scatters in these parameters than halos in low-density environments. We find that these differences are owing to both nature and nurture reasons. Related to the former is mainly the fact that halos in dense regions typically assemble most of their masses earlier than halos in low dense regions, through violent MAHs. Sheth & Tormen (2004) indeed have shown that halos in dense regions form at earlier times than do halos of the same mass in less dense regions. Related to “nurture” is the effect of steepening of the outer (sub)halo profile due to tidal stripping by the parent halo (Ghigna et al., 1998; Okamoto & Habe, 1999; Avila-Reese et al., 1999; Klypin et al., 1999). This effect tends to make the subhalos more concentrated and it is subject to a local condition rather than to the global environment. Subhalos are indeed systematically more concentrated than parent halos, however, both increase also their concentrations as the environment density increases (see also Bullock et al., 2001a). The effect of the formation epoch, related to the global environment, affects likely more the central halo density than concentrations, while the inverse is expected for the local evolutionary effects. As will be seen below, the differences with environment from to are more pronounced for concentrations than for .
| Sample | lglg | lglg | lglg | lglg |
|---|---|---|---|---|
| CLUSTER | 2.23 -0.09 0.13 | 2.10 -0.09 0.11 | 0.77 -0.11 0.11 | 19.01 -0.29 0.33 |
| VOID | 1.10 0.00 0.09 | 0.96 -0.00 0.07 | -0.38 -0.01 0.07 | 15.04 0.04 0.29 |
| FIELD | 1.51 -0.04 0.11 | 1.53 -0.05 0.08 | 0.00 -0.05 0.10 | 15.94 -0.05 0.32 |
| CLUSTER | 1.40 -0.05 0.15 | 1.36 -0.05 0.09 | -0.23 -0.04 0.18 | 17.47 -0.15 0.40 |
| VOID | 1.15 -0.02 0.10 | 1.22 -0.04 0.06 | -0.34 -0.02 0.13 | 17.30 -0.14 0.40 |
| FIELD | 0.67 0.00 0.15 | 0.60 0.01 0.09 | 0.15 - 0.04 0.19 | 17.17 -0.14 0.38 |
3.1.2 Results at z=1
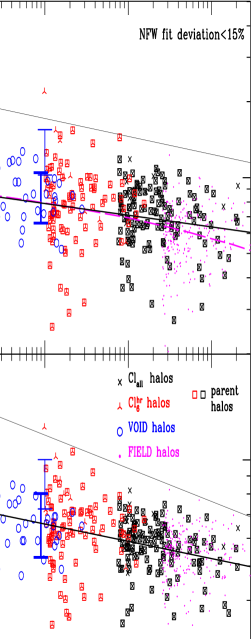
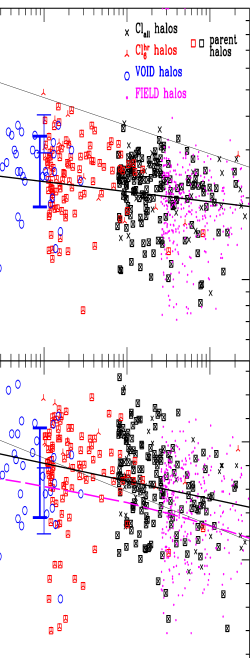
We analyze the CLUSTER, VOID and FIELD samples at in the same statistical sense as done at . Similar to Figs. 1 and 2, we show in Figs. 3 and 4 the concentrations and versus mass but now at , and in Table 3 the parameters of the corresponding linear regressions are given. The first impresion is that the differences in the concentrations and central density seen at among the three halo samples are hardly present at . Our results thus show that at this epoch the cNFW, c1/5, cδ and versus mass relations do not depend on environment.
The central concentration for the CLUSTER halos is on average only a little larger at than at . Halos in dense environments assemble their present-day mass early in such a way that their central densities are stablished likely before . For the VOID halos, the mean of at is larger than the one at by . Halos in low-density environments assemble slowly, incorporating most of their mass lately.
The concentration parameters change more with than the central density. As previously reported (e.g., Bullock et al., 2001a; Eke, Navarro, & Steinmetz, 2001; Navarro et al., 2004), the cNFW concentration parameter is lower at higher redshifts for a given mass. In the upper panel of Fig. 3, the dashed curve shows the dependence at given by the toy model of Eke, Navarro, & Steinmetz (2001). According to this model approximately (see also Bullock et al., 2001a). In Figs. 3 and 4 are also shown (thin solid lines) the linear regression for the CLUSTER sample and the 1 scatter of the VOID sample plotted in Figs. 1 and 2 (). The concentration cNFW is on average and 2.1 times lower at than at for the VOID and CLUSTER samples, respectively. For the latter sample, the comparison is made at . For the FIELD sample, the differences of cNFW between and are on average slightly less than a factor of two, at least in the range of masses explored here. Thus, the evolution of cNFW seems to be slightly different in the different environments. A similar behaviour is seen for c1/5 and cδ. The scatters in all the measured parameters are larger at than at , reflecting likely the fact that at the halos are in general less relaxed than at .
The increase of concentration with time is more pronounced in the cluster environment. We analyze the behaviour of concentration for halos inside the present-day cluster virial radius (subhalos) in simulation Cl. Because for this simulation we have the halo MAHs, concentrations for a given halo can be measured at and . We find that the ratios of concentrations measured at and tend to increase as the ratio decreases (Fig. 5); i.e., halos that have suffered more mass loss due to tidal stripping, end preferentially with higher concentrations. Therefore, as mentioned above, tidal stripping seem to be an efficient mechanism for increasing the average concentration of halos. Moreover, since the concentration is an increasing function of the mass loss, then some steepening of the concentration-mass relation in high-density environments is expected. This is what we observe in our simulations, in particular for cδ and c1/5 (Figs. 3 and 4). For cNFW this effect is not seen because only halos that have a good fit to the NFW profile are selected, and these are typically well relaxed halos that have not felt strong tidal stripping.

3.2 Halo shape distribution
Halo axis ratios as well as the directions of the principal axes are determined by iteratively555The first iteration consider all particles inside a sphere of radius equal to the halo radius. For the second iteration, we reorient the system so as the axis lies on the major axis of the ellipsoid found in the first iteration. We now use all particles inside the ellipsoid. The iteration proceed untill convergence is obtained. diagonalizing the tensor
| (1) |
The sum is over all particles within the halo radius (virial or truncation radius, whichever is smaller), ( 2, and 3) are the particle coordinates with respect to the halo center of mass, is the short-to-long axis ratio, and the intermediate-to-long axis ratio. We use here halos with more than 500 particles.
To obtain an estimate of the error in the determination of the axial ratios due to low particle number, we analyze the well-resolved cluster halos from our simulations. For each one of these halos, which contain hundreds of thousands of particles, we randomly extract only 500 particles and measure and in 100 realizations. We found the the 1 errors in and amount to about 10% and that they do not depend on the mass of the cluster-size halo. These errors are an upper limit because our galaxy-size halos have more than 500 particles.

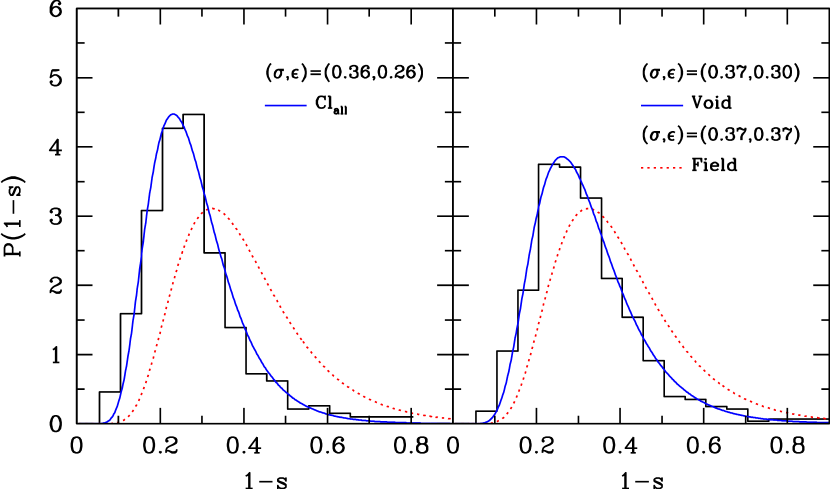
Figure 6 shows the ellipticity as a function of halo mass at two redshifts for the FIELD halo sample. For a given epoch, low-mass halos are preferentially more spherical than high-mass halos while, for a given mass, halos at are on average more flattened than halos at . These results agree with those of Bullock (2001) and Hopkins et al. (2005) and seem to suggest that present-day halos, having had more time to relax and attain a more isotropic orbit distribution, as compared with high-redshift ones, tend to be more spherical. Moreover, since small halos form earlier on average than big ones, they also have had more time to relax and thus become more spherical.
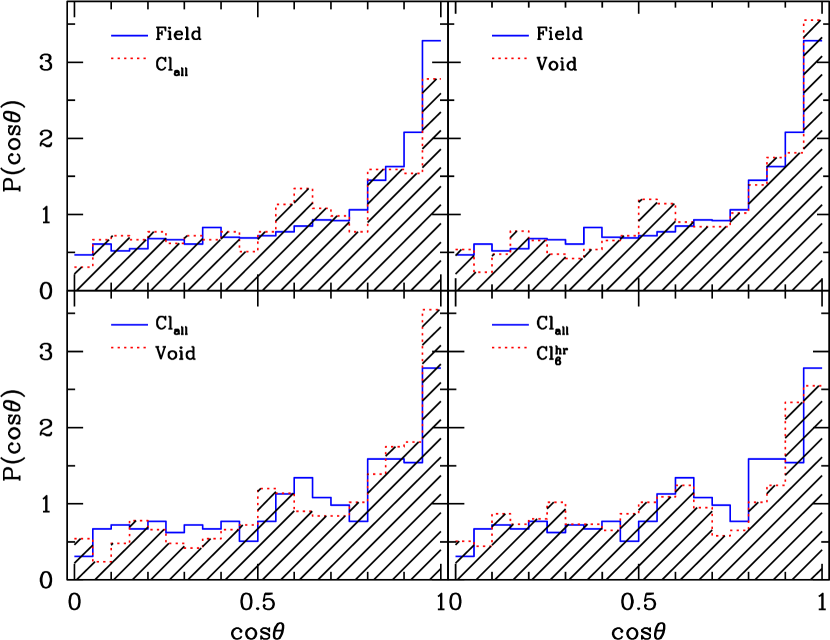
In Fig. 7 we show the distributions of the halo ellipticity for our different samples. The ellipticity distribution of sample Clall is shown in left panel while the one for sample VOID is shown in right panel. They are both well fit by a lognormal distribution,
| (2) |
with best fit values (,) given on the corresponding panels. Curves on panels are the lognormal best fits to the data. The lognormal fit of sample FIELD is shown as a dotted line in both panels for comparison purposes.
A Kolmogorov-Smirnov (KS) test shows that the probability that Clall and FIELD halo samples are drawn from the same parent distribution is very small, . Thus, according to Fig. 7, halos in clusters and their outskirts are on average more spherical than halos in voids or in the field. This conclusion may result at first at odd because, being halos in clusters more massive on average than their counterparts in voids, they are expected to be more flattened (see Fig. 6). However, the environmental effect related to the halo formation epoch seems to dominate over the weak dependence of ellipticity on mass. Halos in a high-density environment assemble earlier than in a low-density one, and as follows from Fig. 6, halos tend to be more spherical as they assemble earlier. On the other hand, when the comparison is made between halos from the VOID and FIELD samples, the mass effect seems to dominate over the environmental one, in such a way that the former are on average less flattened than the latter.
4 Spin parameter and angular momentum alignment
4.1 Spin parameter distribution
We compute the halo total angular momentum as
| (3) |
where and are the position and velocity of the ith particle with respect to the halo center of mass. We follow Bullock et al. (2001b) and define a modified spin parameter to characterize the global angular momentum of a halo
| (4) |
where is the angular momentum inside the halo radius (see §3.1), and is the circular velocity at . Hereafter, in this section, we drop the prime in .
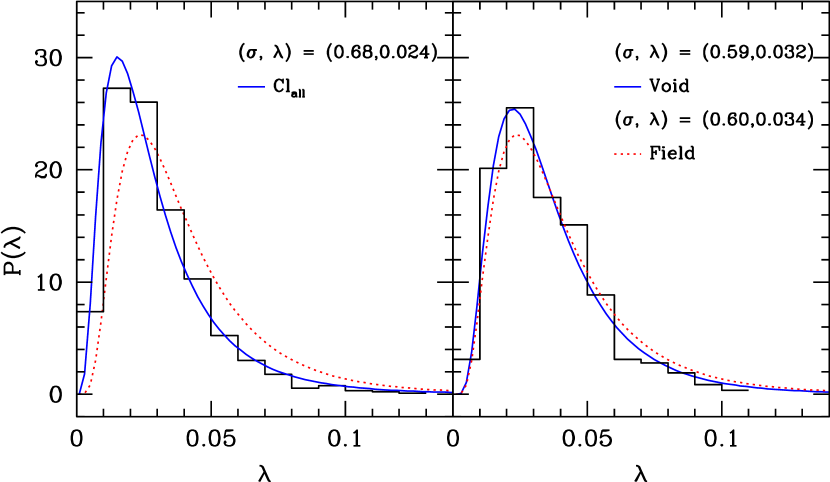
Figure 8 shows the spin parameter distributions for our different galaxy-size halo samples. In this case, halos with more than 500 particles were used. The halos that are subhalos are cut at the truncation radius. The spin distributions of the Clall and VOID samples are shown in left and right panels, respectively. Curves on panels are the corresponding lognormal best fits to the data. The lognormal fit of sample FIELD is shown as a dotted line in both panels for comparison purposes. The (,) parameters of the lognormal distributions are given inside the panels. The median values of for the different samples are presented in Table 2. The conclusion from Fig. 8 and Table 2 is clear: halos from the Clall sample have on average lower spin parameters and a wider distribution than halos from the VOID and FIELD samples. The and parameters of the former sample are 30-40% and times smaller than for the latter samples, respectively.
The difference between the distributions of halos in the Clall and VOID samples is confirmed by a KS test: the probability that both samples belong to the same parent distribution is . Our result agrees with that obtained by Reed et al. (2005). They also found that halos in high-density environments have smaller spins than halos in the field. Are these differences due to global environment effects or to the fact that CLUSTER subsamples have a higher fraction of subhalos? To address this question we compare the distributions of the parent halos and subhalos of the CLUSTER subsamples. By applying a KS test we find only slight differences in these distributions: the probabilities that both samples belong to the same parent distribution are 0.89 for the Cl sample and 0.45 for the Clall sample. On the other hand, the medians (or ) of the halo and subhalo samples in both cases agree within 5%. We notice that the FIELD sample is by construction composed of only parent halos, and the VOID halos are esentially parent ones (more than 90%).
How much of the difference we have found can be attributed to cluster-to-cluster scatter? Unfortunately, we only have one cluster, Cl, with hundreds of halos, each one with more than 500 particles inside its virial or tidal radius. The other clusters are less resolved and they thus have less halos than Cl by far. We avoid the halo low-number problem by combining these clusters to form only one, which in principle is independent from Cl. We measure for the independent Cl halo sample and test whether this distribution is similar to the one obtained for the composite Clall sample. We found differences in the values of the fitting parameters (,) of less than 5%. Slightly higher differences are measured when the comparison is made between the distribution from the same sample Clall but at two close snapshots.
Our results show that present-day halos in dense environments have a spin parameter distribution shifted to lower values with respect to those of halos in the field or in the voids. Does decrease due to the lost of high angular momentum material by halos that suffer strong tidal stripping in dense regions? A way of testing this hypothesis is by simply measuring in the cluster environment at much earlier time, when most halos have yet to experiment strong tidal stripping. We find a median value at for the CLUSTER sample, which is comparable to for the FIELD sample at present time. This result is consistent with the hypothesis above but does not actually prove it. On the other hand, we showed above that subhalos and parent halos have, according to a KS test, similar distributions. These results appear to contradict each other. Notice, however, that the histories of parent halos in high-density regions can be very different from their counterparts in low-density environments because the former undergo a “tumultuous life”. They may have suffered, for instance, tidal stripping in the past, from close encounters with major substructures, or their mass accretion could have been stopped (Kravtsov et al., 2004b). We also looked for a cluster-centric radial dependence in Clall and Cl samples. Unlike Reed et al. (2005), we did not find any systematical decreasing of as the cluster-centric radius is smaller. Notice that Reed et al. (2005) analyzed subhalos with more than 144 particles, while our subhalos have more than 500 particles; many subhalos are below this limit, but the measure of for them is not reliable.
For the VOID and FIELD samples, and 0.036 at , respectively. Therefore, for these halo samples also decreases on average from to , but very little. In this case, the small decreasing of with time could be explained by the accretion mode proposed by Peirani et al. (2004). In summary, while halos in low-dense regions seem to keep constant or slightly decrease their values from to , halos from the cluster-like regions tend to decrease significantly their values. We interpret the latter as a consequence of two effects: (i) the earlier halo assembly epochs typical of higher density regions, and (ii) the subhalo tidal stripping and the the tumultuous mass assembly history of halos in clusters and their surroundings. For a more detailed discussion of these effects it is necessary to follow the individual mass and angular momentum assembly histories of the halos. In a subsequent paper we will construct and analyze these individual histories for each one of our samples.
4.2 Internal angular momentum alignment
In previous subsection we explored the distribution of the magnitude of the angular momentum as a function of environment. Now we will explore possible differences in the distribution of the angular momentum internal alignment. We measure the typical alignment by the angle between the mean angular momentum of the particles in the inner sphere of half-mass radius and the mean angular momentum of the particles in the outer half-mass spherical shell (Bullock et al., 2001b). As discussed by Bullock et al. (2001b) large errors are involved in the determination of the direction of the angular momentum vectors and thus in . The error in is estimated in two manners. In the first one, we assign errors to each component of the angular momentum, in both inner and outer half-mass regions, using a Monte Carlo procedure similar to the one built to estimate the error in the axial ratios (§3.2), and perform a standard propagation of errors. In the second one, the Monte Carlo procedure is applied directly on . The first method gives larger errors. This is so likely because the internal and external angular momentum are not entirely independent quantities. We found that the error depends not only on the number of particles, , and but also on the intrinsic alignment: a more aligned halo have a smaller error. For as low as , the error in can reach 50% of the measurement. Bearing this in mind, we now proceed to present our results (still uncertain) and their possible intepretations.
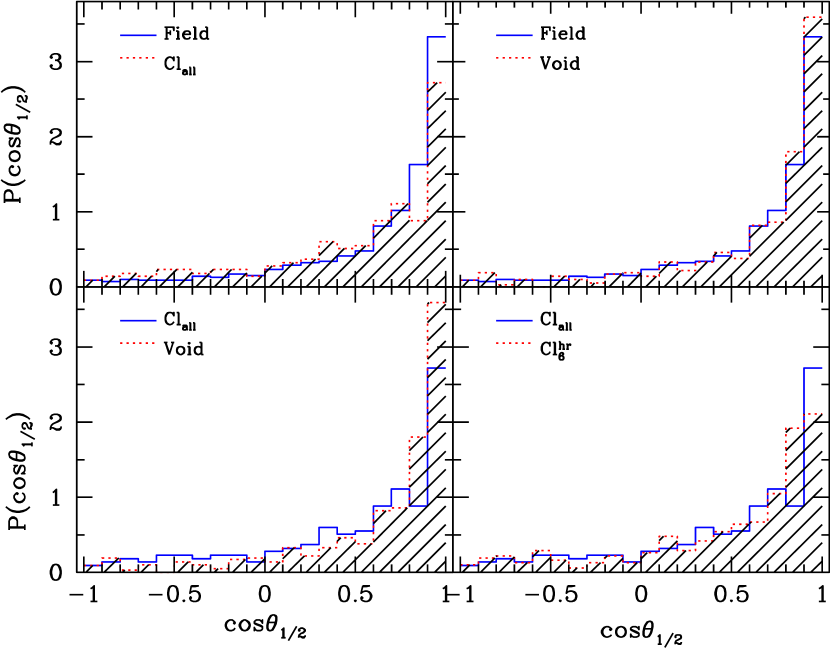
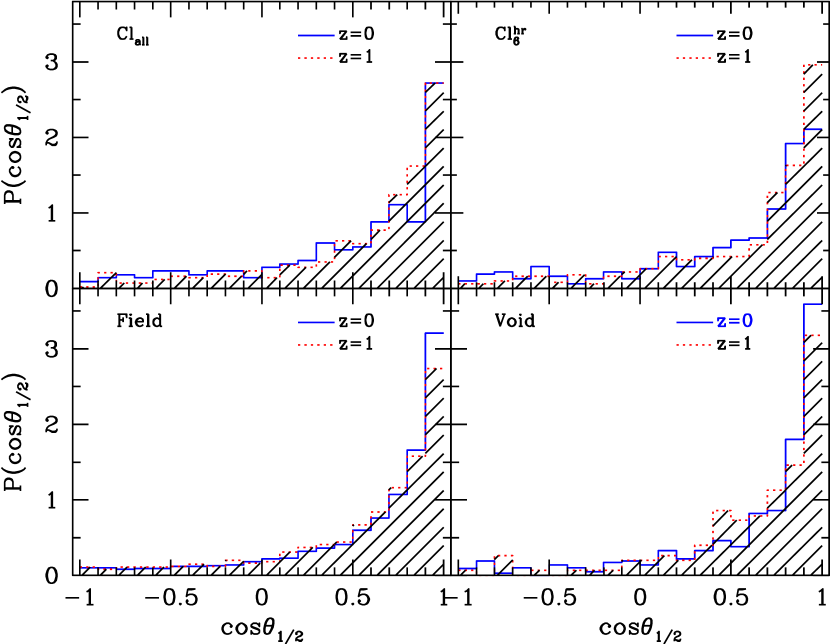
The distributions of for our different environments at are shown in Fig. 9. As it was the case for , we use halos with more than 500 particles. Figure 9 shows that the Clall halos are on average less aligned than the halos from the FIELD and VOID samples. The median values of for the Clall FIELD, and VOID samples are 0.51, 0.80, and 0.83, respectively. In order to find a possible explanation for these differences with environment, we have also measured the alignment distributions at a much earlier time, (Fig. 10). Figures 9 and 10 show that the population of VOID and FIELD halos at is more aligned on average than the one at . A more quantitative estimate of this difference is confirmed by the KS test: for the FIELD sample, for example, the probability that the populations at and belong to the same parent distribution is , with and 0.75, respectively. Regarding the Clall sample, there is no any significant difference in the alignment distributions of halos at and .
We remark that the results presented above need to be confirmed by future analysis with better resolved halos. If confirmed, we find the following explanation for the evolutionary effect seen in the internal angular momentum alignment of FIELD and VOID sample halos. On one hand, most of the angular momentum of the outer sphere, which is where essentially most of the halo angular momentum resides, was acquired during the linear grow. On the other hand, it is expected that most of the angular momentum of the inner sphere comes from the violent, initial merger-growth phase (Vitvitska et al., 2002; Peirani et al., 2004). The material accreted by the halo at later times brings angular momentum oriented in the direction of the angular momentum of the outer shell. As part of this material is incorporated into the inner sphere the alignment increases. This mechanism is not expected to apply to halos in clusters or their outskirts because they typically do not incorporate material as soon as they fall into the cluster halo; in some cases the halos in clusters even loose mass due to tidal stripping.
Regarding the question of why present-day halos in clusters are less aligned than those in the field or in voids, a comparison between Clall and FIELD halos at shows that they are equally well aligned. This is probably so because at these environments are still not too disimilar. However, unlike halos in the field and voids, halos in clusters evolve under the influence of strong tidal fields. Halos in sample CLUSTER have a mass assembly history very different from their counterparts in samples FIELD or VOID. In the cluster environment, a significant fraction of halos present at do not survive until , others end up with their masses significantly reduced, while some others, those that at present day are at cluster outskirts, may grow as what is typical of a halo in field and void environments. Figures 9 and 10 show that halos in sample Cl at are more disaligned than halos at . For the subset of halos of sample Cl that are within at (subhalos), which were also identified at , we find the same trend: the halos at are on average more aligned than the halos at . A halo by halo comparison, however, shows that the trend is not systematic; i.e., there are halos that exhibit a higher alignment at . In summary, it seems that in an environment in which halos stop growing, an increase in alignment is not expected, but even more, it seems that a cluster-like environment acts on the halo angular momentum internal alignment in a non-trivial way: the change in alignment varies halo by halo.
4.3 Alignment between the halo shape and angular momentum
Halo axis ratios as well as the directions of the principal axes are determined as explained in §3.2. We denote with the angle between the angular momentum axis within and the direction of the minor principal axis. In Fig. 11 we show the distributions of at for our different halo samples. We use here also halos with more than 500 particles, although the iterative procedure sometimes need more than that to converge. The number of halos used to draw the histograms in Fig. 11 can thus be lower than those shown in Table 2 (see §2). We repeat here the procedure we follow to evaluate the error in axial ratios and to obtain the corresponding error in . Errors in are smaller than those ones in . They amount to about 20% for halos with 500 particles. Taking into account that this particle number is a lower limit, we expect errors in to be on average less than 20%. On the other hand, errors in are also dependent on the degree of alignment but they seem to be less sensitive to it than the errors in .
The angular momentum axis of halos tends to align to the minor axis of the halo ellipsoids (in a plot like Fig. 11, a random oriented distribution would be uniform). This appears to be a generic prediction of the CDM cosmology (see also Faltenbacher et al., 2002; Bailin & Steinmetz, 2004). Besides, we find some trend of decreasing the alignment angle from Clall to FIELD and VOID halo samples. This visual result is mildly supported by a KS test: the probability that the Clall and VOID samples belong to the same parent distribution is .
The relative orientations of the halo angular momentum direction and the halo principal axes could have important consequences on disk galaxy formation, the dynamics of the disks inside the halos as well as on observational studies aimed to explore the distribution of satellite galaxies with respect to the parent halo shape and orientation.
5 Structural relations
5.1 Maximum circular velocity vs mass
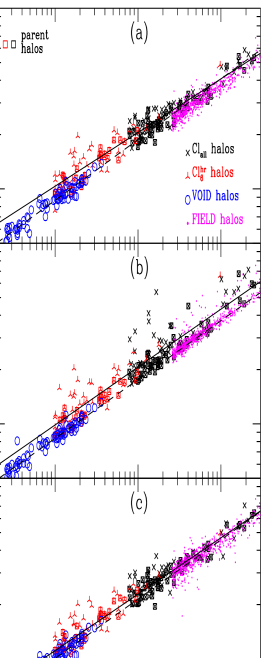
Figure 12(a) shows maximum circular velocity, , vs. mass, , for the halos from all the samples analyzed here. As usual, is the maximum value of the smoothed radial profile , computed under the assumption of spherical symmetry. The solid and dashed lines are the linear regressions for the CLUSTER and VOID samples, respectively. The Pearson correlation coefficients of the CLUSTER, VOID, and FIELD samples are 0.98, 0.97, and 0.96, respectively. The parameters of the linear regressions in the logarithmic plane are given in column (2) of Table 4.
| Sample | lglg | lglg | lglg |
|---|---|---|---|
| CLUSTER | -1.25 0.297 0.05 | -1.52 0.320 0.08 | -1.39 0.312 0.06 |
| VOID | -1.76 0.336 0.03 | -1.67 0.326 0.03 | -1.60 0.328 0.04 |
| FIELD | -1.76 0.334 0.03 | -1.71 0.327 0.04 | -1.54 0.322 0.04 |
| CLUSTER | -1.55 0.324 0.04 | -1.74 0.343 0.07 | -1.43 0.319 0.06 |
| VOID | -1.53 0.321 0.02 | -1.52 0.321 0.02 | -1.48 0.323 0.04 |
| FIELD | -1.77 0.340 0.03 | -1.82 0.370 0.05 | -1.32 0.311 0.05 |
Our results confirm the tightness of the - relation, in this case, for different environments. The relation is steeper for the VOID and FIELD samples than for the CLUSTER one. This is in agreement with the fact that the concentration-mass dependences for the former are shallower (almost absent) than for the latter (see below). In Avila-Reese et al. (1999) it was shown how does depend on ; for example, for the NFW model (their eq. 8) , where is a function of cNFW and cNFW depends on . In the limiting case of no dependence of cNFW on , , which is close to our results for VOID and FIELD halos. The steeper the dependence of cNFW on , the shallower the - relation.
As seen in Fig. 12(a), for a given mass, halos in voids and in the field have smaller than halos in clusters. At (), the circular velocity of VOID (FIELD) halos is typically () smaller than the corresponding to CLUSTER halos. On the other hand, the CLUSTER sample shows the largest scatter in the – relation. Several authors who modeled disk galaxy formation and evolution have shown that the Tully-Fisher relation (TFR) of disk galaxies is well explained mainly as an imprint of the CDM halo – relation (e.g., Mo et al., 1998; Steinmetz & Navarro, 1999; Firmani & Avila-Reese, 2000; Avila-Reese & Firmani, 2000; Buchalter et al., 2001). Thus, our results would imply that the TFR in different environments could be slightly different (see also §6).
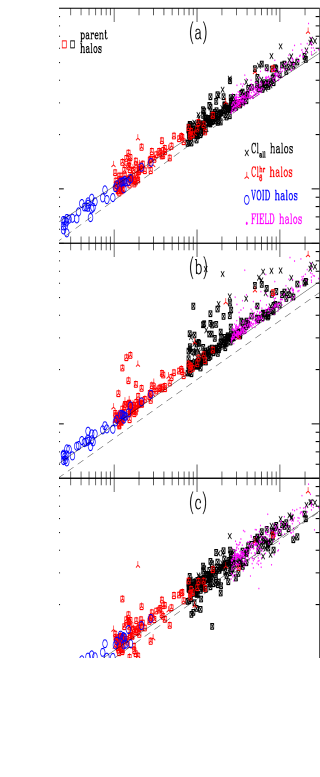
In Fig. 13(a) we present the plot corresponding to Fig. 12(a) but at . For comparison purposes, the same linear regresions shown in Fig. 12(a) (solid and dashed thin lines) are plotted. The – relations in the different environments are more similar at than at . For a given mass, halos at have on average slightly larger than at , specially for the VOID halos. This is because in a hierarchical scenario increases with time typically more than does, shifting the relation to the high mass (low velocity) side. Nevertheless, the hierarchical mass growing can be stopped or even reversed in the cluster environment. The parameters of the linear regresions for the CLUSTER, VOID, and FIELD samples at are given in column (2) of Table 4. The scatter of the - relation is smaller at than at , specially for the CLUSTER sample.
5.2 Velocity dispersion vs mass
Panels (b) and (c) of Figs. 12 and 13 show mass-weighted halo velocity dispersions vs mass for all samples at and , respectively. The total and central velocity dispersions are defined as follows:
| (5) | |||
| (6) |
where is the 3-dimensional velocity dispersion at the spherical shell with radius . The linear fitting parameters for all the samples are given in third and fourth columns of Table 4. The behaviour of the velocity dispersion-mass relations at for all the samples (environments) is similar to the one of the maximum circular velocity-mass relation (see also Antonucci-Delogu et al. 2001), reflecting this that most of the halos are close to their equilibrium state. In the plots for vs there are several outliers in the CLUSTER sample. These are mostly truncated halos. They are not outliers in the vs plot. Halos in voids and in the field have systematically smaller velocity dispersions than halos in clusters, although the difference becomes very small when the central velocity dispersion is used.
| Env.aaEnvironment: V=void, Cl=cluster | cNFW | b/d | ||||||||
|---|---|---|---|---|---|---|---|---|---|---|
| pc2 | kpc | km/s | ||||||||
| 1 | V | 12 | 0.048 | 1.75 | 0.64 | 0.54 | 1.1 | 1.1 | 3.61 | 55 |
| Cl | 19 | 0.035 | 2.42 | 0.39 | 0.74 | 12.3 | 0.7 | 6.18 | 71 | |
| 100 | V | 10 | 0.048 | 2.30 | 0.50 | 0.53 | 8.8 | 6.3 | 512 | 212 |
| Cl | 13 | 0.035 | 2.83 | 0.27 | 0.72 | 24.5 | 3.8 | 730 | 278 |
6 The halo-galaxy connection
Our study shows that present-day halos in the cluster environment are on average more concentrated, more spherical, disaligned and rotate slower than halos in the void or field environments. Our study also suggests differences in the evolution history of halos depending on the environment: halos in dense environments assemble their masses apparently earlier than halos in low-density regions (see also Sheth & Tormen, 2004). The question is whether all these differences in the halos produce visible differences in the luminous galaxies formed inside them.
A common method in galaxy modeling is to build-up a luminous galaxy linked directly to a present-day CDM halo. Several numerical and analytical works show indeed that the present-day properties of the halos keep some memory of their evolution history (typical formation epoch, average shape of the MAH, major mergers, etc.). For example, the halo concentration depends on the shape of the MAH (Avila-Reese et al., 1998; Firmani & Avila-Reese, 2000; Wechsler et al., 2002; Zhao et al., 2003), in such a way that fixing the concentration at , the main feature of the halo MAH (and of the corresponding baryon matter infall history) remains roughly determined. However, a direct ( halo)-galaxy connection may fail for subhalos (specially for the massive ones and in cluster regions). The tumultous history of galaxy-size subhalos, since they infall in the cluster halo, affects in a complex way their present-day properties and distributions. The main effect is that of tidal stripping, or even total disruption, of subhalos as they penetrate into the cluster potential (e.g., Ghigna et al., 1998, 2000; Colín et al., 1999, 2000; Taffoni et al., 2003; De Lucia et al., 2004; Kravtsov et al., 2004a, b; Diemand et al., 2004; Gao et al., 2004a; Reed et al., 2005). Thus, the halo mass function and the halo-to-galaxy mass ratio of galaxies in clusters is expected to change dramatically with time. The study of galaxy evolution in clusters, at least in their inner regions, requires a full treatment of halo evolution and baryonic physics (Springel et al. 2001; Diaferio et al. 2001; Gao et al. 2004b).
Following, we will carry out a very preliminar exploration of the effects on the disk galaxy properties when varying the present-day CDM halo concentration and , according to the results obtained above for different environments. For this, seminumerical models of disk galaxy evolution (Avila-Reese & Firmani, 2000; Firmani & Avila-Reese, 2000) will be used (see also van den Bosch, 2000). These models include in a self-consistent way the processes of formation and evolution of a spherical CDM halo and a disk in centrifugal equilibrium inside it, the adiabatic gravitational contraction of the halo due to disk formation, self-regulated SF and feedback, secular bulge formation and other evolutionary processes. Most of the galaxy properties depend mainly on (i) the present-day , (ii) the halo MAH (that determines the concentration), (iii) the spin parameter , and (iv) the disk mass fraction (). A brief description of the main ingredients of the model is presented in the Appendix. We notice that the parameter in this case follows its standard definition (e.g., Peebles, 1969). This parameter is larger than the one measured for halos in §4 by factors typically of 1.25-1.50, depending on the halo concentration (Bullock et al., 2001b).
We model disk galaxies of a given baryon mass () in halos with different concentration and spin parameters, emulating void and cluster environments. The seminumerical method is well suited for isolated (field and void) galaxies. For “void” galaxies, we assign the (high) median (calculated from ) found for VOID halos and fix the (). We then select, from random realizations, MAHs for this mass so that they yield the typical (low) concentrations of VOID halos at ; these MAHs are extended, implying late halo assembling. We carefully choose roughly regular MAHs, without dramatic changes in their shapes. The emulation of “cluster” galaxies with our method is more difficult. We will assume that the (sub)halo was accreted into the cluster halo at (3.4 Gyr ago, for the cosmology used here). Ours and previous simulations show that most subhalos in present-day cluster halos were accreted recently ( after ), and that since then, these halos have lost typically 30-50% of their masses due to tidal striping (e.g., De Lucia et al., 2004; Nagai & Kravtsov, 2005; Zentner et al., 2005; van den Bosch et al., 2005). Thus, we fix at rather than at , and we assign a low , typical of our CLUSTER halos at , which is slightly larger than at . Regarding concentrations, we fix them to the typical (high) concentrations of our CLUSTER halos by selecting the appropiate MAHs. These MAHs and the fact that the halo is fixed at , imply an early assembling of the halo/disk system. Since the disk does not accretes more gas but it continues evolving.
Models for two disk (baryonic) masses are calculated, and . For each mass, we calculate two galaxy models corresponding roughly to the extreme environments, void and cluster regions, as explained above. We set the disk mass fraction in all cases to be . The cosmologycal parameters are the same ones used in our N-body simulations (§2). Table 5 summarizes the main halo and disk input parameters as well as the obtained properties of our simulated galaxies. Recall that in the case of the “cluster” galaxies, the halo growth and gas infall are truncated at to account for the fact that it was accreted into the cluster at this time. The late-accreted halos are typically located in the periphery of the cluster halo (e.g., De Lucia et al., 2004; Nagai & Kravtsov, 2005) and are expected to host mostly spiral or S0 galaxies.
Looking at Table 5, one sees that the dependence of halo concentration and on environment found in this work should produce some changes in the disk galaxy properties. As previously reported (Avila-Reese & Firmani, 2000), influences mainly the disk scale length and surface brightness, the gas fraction and the secular bulge-to-disk ratio, while the MAH fixes the halo concentration and influences mainly the SF history, galaxy integral color and the scatter of the TFR. Thus, our expectation is that disk galaxies of a given mass formed in low– and highly concentrated halos, with a gas infall history truncated early (cluster environment), are preferentially of earlier morphologycal types, redder, shifted to the higher velocity side in the TFR, and have higher surface brightness, smaller scale lengths, and lower gas fractions than disk galaxies formed in high– and low-concentration halos (void environment). All these trends are namely seen in Table 5. The stellar central surface density, , and disk scale radius, , are the parameters of the exponential-law fit to the model stellar disk. In fact, the disks formed in CDM halos typically are not exactly exponentials, but their surface density profiles are more concentrated in the center and with an excess in the periphery compared with the exponential law (Firmani & Avila-Reese, 2000; Bullock et al., 2001b).
Our results show that owing to only differences in the halo properties (related to the environment), the galaxy disks can have significant differences. According to Table 5, disks formed in halos with properties typical of halos in voids are mag bluer in color, have central stellar surface densities lower by times (1.5 mag/arcsec2), and gas fractions higher by 1.5-2 times than disks formed in halos with properties typical of the cluster-periphery environment. According to our models, the low mass disks have lower central surface brightnesses and higher gas fractions than the high mass ones, while the colors do not change significantly with mass. The (secular) bulge-to-disk ratio depends strongly on mass, being this ratio larger for massive disks. There is also a significant increasing of this ratio from halos typical of voids to those typical of the cluster periphery. This implies that part of the morphology-density relation is due to changes in the properties of the galaxy halos with environment.
As mentioned in §5.1, one expects also differences with environment in the TFR. The slope of the model stellar TFR is (Firmani & Avila-Reese, 2000). By using this slope, we correct the velocities due to the variations in the stellar masses of each one of the models with and presented in Table 5. We obtain that at , the difference in for our void and cluster-periphery galaxies is about 20%; the difference in mass, expressed in magnitudes, is 0.6 mag, i.e. we predict that the zero-point of the TFR of void galaxies at should be brighter by mag than the one of cluster-periphery galaxies. At , the predicted difference is mag.
Real galaxies show likely more pronounced differences in their observational properties as a function of the environment than those obtained with our models (see §1.1 for references). Thus, other physical processes not considered here should certainly play an important role in galaxy dynamics and evolution. For example, we did not treat in detail the angular momentum distribution misalignment and did not take into account the halo triaxiality and the shape-to-rotation axis misalignment. These properties change with environment as was shown in §§3 and 4. Besides, deep in the cluster regions, the external effects such as tidal and ram pressure stripping, strong interactions at early epochs, and galaxy harassment (Moore et al., 1996), are likely the dominant ones in shaping morphology and other galaxy properties (see the references above).
Finally, we note that most of the differences in the halo properties with environment seen at dissapear at , although the scatters in the latter epoch are very large. As mentioned in §1.1, observations also show that the morphology-density relations flattens at higher redshifts. The main morphological evolution is seen for the galaxies in the high-density environment. Halos in clusters are also those that change most their properties.
7 Summary and Conclusions
Observations show that morphology and several properties of galaxies change systematically with environment. According to the current paradigm of galaxy formation, galaxies assemble inside CDM halos. We state then two questions: (i) do the properties of galaxy-size CDM halos/subhalos change systematically with environment?, and if this the case, (ii) do these changes in the halo/subhalo properties affect the luminous galaxies in the direction that observations show?
We studied the first question by means of high-resolution CDM cosmological N-body simulations. Several clusters with their surroundings (CLUSTER sample) and void regions (VOID sample) were selected from large-box simulations, and they were resimulated with high resolution. We also use other simulations, in particular two 60Mpc-box simulations from which the FIELD sample of parent halos was extracted. The local density contrast in our CLUSTER, VOID and FIELD samples are on average larger than 34, smaller than -0.8 and roughly 0, respectively. The second question, in a first attempt, was disscused by using standard seminumerical models of disk galaxy evolution. Disk galaxies were modeled inside CDM halos with properties that we have found they have in the different environments. Following, we summarize our main results:
For masses , halos from the CLUSTER sample are on average more concentrated and have times higher central densities than halos in voids at . While for halos in cluster regions the concentration parameters cNFW, c1/5 and cδ, and the density decrease on average with mass, for halos in voids these concentrations and do not seem to change with mass. The slope of the , and dependences for the former sample is . In the mass range of the parent FIELD halos analyzed here, concentrations and are also smaller on average than those of halos in clusters. The concentrations and of FIELD halos decrease on average with mass but less rapid than halos from the CLUSTER sample. The scatters of all of these parameters are larger for CLUSTER halos than for halos in less dense environments. For example, for reasonably well fitted NFW halos from the CLUSTER and VOID samples, (logcNFW) and , respectively.
All the differences mentioned above become less pronounced when comparing only the parent halos from the different samples (CLUSTER: ; VOID: ; FIELD: all). Therefore, the CLUSTER halos are more concentrated and internally denser than the VOID and FIELD ones due partially to a local halo-subhalo effect (subhalos are a significant fraction of the CLUSTER sample, and subhalos are systematically more concentrated than their parent halos, see also, e.g., Bullock et al. 2001a). However, we find that the parent halos and subhalos from the CLUSTER sample are still significanlty different on average than the parent halos and subhalos from the VOID and FIELD samples. Therefore, the differences in halo properties are certainly also due to a pure global environmental effect, related mainly to the typical halo formation epoch: halos in dense environments assemble their masses earlier than halos in low-density regions.
Halos in dense environments are more spherical than halos in less dense environments at . The minor-to-major axis ratios of CLUSTER halos are on average times lower than those of the FIELD halos. For a given epoch, the ellipticity of the halos tends to increase with mass. For a given mass, the ellipticity changes with age, the younger halos having on average larger ellipticities than the older halos.
The spin parameter of CLUSTER halos is on average times lower than the one of VOID or FIELD halos at . This is likely a consequence of both global (environmental) and local effects, i.e. the dependence of halo formation epoch on environment, and the tidal stripping and “tumultuos” histories that halos suffer in locally high-density regions, respectively. We do not find significant differences in the distribution of parent halos and subhalos from the CLUSTER sample. The CLUSTER halos appear to have a less aligned intrinsic angular momentum distribution than the VOID and FIELD ones, but this result needs to be confirmed by future analysis because of the large errors involved in the determination of . The spin parameter does not change significantly with mass in any environment and its distribution is well approximated by a lognormal function with a larger width and a lower peak in cluster regions than in voids and the field. The angular momentum axis of halos tends to be aligned with their minor principal axis, this behaviour being more common in the less dense environments than in the high-density ones.
A tight relation is seen for halos in all the environments. The relation is shallower (slope of 0.30) and more scattered for clusters and their surroundings than for the void and field environments (slopes of ). If this relation is the basis of the observed TFR, then slight differences in the TFR are expected in different environments. The relation slightly shifts to the lower mass side at in all the environments, but in particular in the voids. Similar results to the relation are obtained for the and relations, showing that most of the halos are close to their equilibrium state.
The differences in halo properties with environment seen at drastically diminish at . Interestingly enough, a similar result was found for the observed morphology-environment relation. As expected, the concentration parameters decrease as we go from to , being this change more pronounced for the CLUSTER halos, particularly for the less massive ones. The spin parameter of CLUSTER halos at is on average significantly larger than at , while for less dense environments, the spin parameter at is on average only slightly larger than at ; thus, evolves in a different way for halos in cluster-like regions than for halos in less dense environments. Halos in the void and field environments are systematically less aligned at than at , while halos in the cluster regions do not show any systematical change with redshift in a statistical sense.
Disk galaxies modeled in a self-consistent fashion inside CDM halos with the present-day concentrations and spin parameters found here for halos in the different environments present systematical differences: the galaxies formed in halos typical of cluster-periphery environment have higher surface density, circular velocity and secular bulge-to-disk ratio, lower gas fraction, and are redder than for those formed in halos typical of void environment. These trends agree qualitatively with observations but are not enough to explain the observed differences of galaxy properties with environment. We predict that the TFR of galaxies in low and high-density environment is different.
From our study we conclude that most of the properties of galaxy-size halos at change with environment in a statistical sense, the largest differences in the structural properties being for the less massive halos (sub- galaxies). The main changes with environment occured after and the most affected halos are the subhalos in the CLUSTER sample. The differences in halo concentrations and spin parameters along the different environments influence on the properties of galaxy disks formed inside these halos and in the same direction that observations show. However, the inclusion of angular momentum dissalignment, triaxiality, and shape-rotation axis dissalingment –halo properties that also change with environment– in the models of disk galaxy evolution is necessary in order to attempt to reproduce in more detail the observed relations of disk galaxy properties with environment. The halo merging history and its influence on luminous galaxies should also be taken into account, in particular for modelling galaxies in the high-density environments.
The halo properties discussed above and their changes with environmnet are ultimately related to the initial cosmological conditions. Based on our results, we claim that the observed galaxy properties–environment relations are partially established by the initial cosmological conditions (nature), in the sense that galaxy halos in more dense environments assemble earlier. However, our results point out that the external astrophysical factors (nurture) should play also an important role in the observed trends of changing galaxy properties with environment, specially in the highest density regions (clusters).
APPENDIX
Here we present the main physical ingredients of the self-consistent evolutionary models used in §6. For details see Firmani & Avila-Reese (2000); Avila-Reese & Firmani (2000). The disk is built up within a growing CDM halo. An extended Press-Schechter approach (Lacey & Cole, 1993; Avila-Reese et al., 1998) is used to generate the statistical MAHs of the halos from the primordial density fluctuation field, and a generalized secondary infall model is applied to calculate the time by time virialization of the accreting mass shells (Avila-Reese et al., 1998). The evolution and structure of the CDM halos calculated this way agree well with results from cosmological N-body simulations (Avila-Reese et al., 1999). Halos assembled through early active MAHs end more concentrated on average than halos with extended MAHs.
The halo mass shells are assumed to have aligned rotation axis with specific angular momentum given by , where , , Mv and are the total angular momentum, mass and energy of the halo at the shell virialization time . The spin parameter, , is assumed to be constant in time. As the result of the assembling of these mass shells, a present day halo ends with an angular momentum distribution close to the (universal) distribution measured by Bullock et al. (2001b) in N-body simulations. A fraction of the mass of each shell is assumed to cool down and form a disk layer in a dynamical time. The radial mass distribution of the layer is calculated by equating its specific angular momentum to that of its final circular orbit in centrifugal equilibrium (detailed angular momentum conservation is assumed). The superposition of these layers form the disk.
The gravitational interaction of disk and inner halo is calculated using a generalized adiabatic invariance formalism. This formalism differs from the usual one (e.g., Flores et al., 1993) in that we take into account the ellipticity of the orbits (the circular orbit assumption is relaxed); recent numerical studies (Gnedin et al., 2004) confirm the validity of our approach.
The disk SF at a given radius (azhimutal symmetry is assumed) is triggered by the Toomre gas gravitational instability criterion and self-regulated by a vertical disk balance between the energy input due to SNe and the turbulent energy dissipation in the ISM. This physical prescription for disk SF yields naturally a Schmidt law with an index , slightly varying along the disk (Firmani, Hernández & Gallagher, ). The SF efficiency depends on the gas surface density determined mainly by , and on the gas accretion rate determined by the cosmological MAH. Finally, we estimate the mass of the (secularly formed) bulge as the inner disk mass where the Toomre stellar parameter indicates disk instability (see also van den Bosch, 1998)
References
- Aguerri et al. (2004) Aguerri, J. A. L., Iglesias-Paramo, J., Vilchez, J. M., & Muñoz-Tuñón, C. 2004, AJ, 127, 1344
- Antonuccio-Delogu et al. (2002) Antonuccio-Delogu, V., Becciani, U., van Kampen, E., Pagliaro, A., Romeo, A.B., Colafrancesco, S., Germaná, A., & Gambera, M. 2002, MNRAS, 332, 7
- Avila-Reese et al. (1998) Avila-Reese, V., Firmani, C., & Hernandez, X. 1998, ApJ, 505, 37
- Avila-Reese et al. (1999) Avila-Reese, V., Firmani, C., Klypin, A., & Kravtsov, A.V. 1999, MNRAS, 310, 527
- Avila-Reese & Firmani (2000) Avila-Reese, V., & Firmani, C. 2000, RMxAA, 36, 23
- Avila-Reese et al. (2003) Avila-Reese, V., Colín, P., Piccinelli, G., & Firmani, C. 2003, ApJ, 598, 36
- Bailin & Steinmetz (2004) Bailin, J., & Steinmetz, M. 2004, ApJ submitted (astro-ph/0408163)
- Balogh et al. (1998) Balogh, M.L., Schade, D., Morris, S.L., Yee, H.K.C., Carlberg, R.G., & Ellingson, E. 1998, ApJ, 504, L75
- Balogh et al. (2004) Balogh, M.L., et al. 2004, MNRAS, 348, 1355
- Baugh et al. (1996) Baugh, C.M., Cole, S., & Frenk, C.S. 1996, MNRAS, 283, 136
- Berlind et al. (2003) Berlind, A.A., Weinberg, D.H., Benson, A.J., Baugh, C.M., Cole, S., Davé, R., Frenk, C.S., Jenkins, A., Katz, N., & Lacey, C.G. 2003, ApJ, 593, 1
- Boissier et al. (2003) Boissier, S., Monnier Ragaingen, D., Prantzos, N., van Driel, W., Balkowski, C., & O’Neil, K. 2003, MNRAS, 343, 653
- Bothun et al. (1993) Bothun, G.D., Schombert, J.M., Impey, C.D., Sprayberry, D., & McGaugh, S.S. 1993, AJ, 106, 530
- Buchalter et al. (2001) Buchalter, A., Jimenez, R., & Kamionkowski, M. 2001, MNRAS, 322, 43
- Bullock et al. (2001b) Bullock, J.S., Dekel, A., Kolatt, T.S., Kravtsov, A.V., Klypin, A.A., Porciani, C., & Primack, J.R. 2001b, ApJ, 555, 240
- Bullock et al. (2001a) Bullock, J.S., Kolatt, T.S., Sigad, Y., Somerville, R.S., Kravtsov A.V., Klypin, A.A., Primack, J.R., & Dekel, A. 2001a, MNRAS, 321, 559
- Bullock (2001) Bullock, J.S. 2001, preprint (astro-ph/0106380)
- Colín et al. (2000) Colín, P., Klypin, A. A., & Kravtsov, A. V. 2000, ApJ, 539, 561
- Colín et al. (1999) Colín, P., Klypin, A. A., Kravtsov, A. V., & Khokhlov, A. M. 1999, ApJ, 523, 32
- Croton et al. (2005) Croton, D. J. et al. 2005, MNRAS, 356, 1155
- Dalcanton et al. (1997) Dalcanton, J.J., Spergel, D.N., Summers, F.J. 1997, ApJ, 482, 659
- De Lucia et al. (2004) De Lucia, G., Kauffmann, F., Springel, V., White, S.D.M., Lanzoni, B., Stoehr, F., Tormen, G., & Yoshida, N. 2004, MNRAS, 348, 333
- Diaferio et al. (2001) Diaferio, A., Kauffmann, G., Balogh, M. L., White, S. D. M., Schade, D., & Ellingson, E. 2001, MNRAS, 323, 999
- Diemand et al. (2004) Diemand, J., Moore, B., & Stadel, J. 2004, MNRAS, 352, 535
- Domínguez et al. (2001) Domínguez, M., Muriel, H., & Lambas, D.G. 2001, AJ, 121, 1266
- Domínguez et al. (2002) Domínguez, M.J., Zandivarez, A.A., Martínez, H.J., Merchán, M.E., Muriel, H., & Lambas, D.G. 2002, MNRAS, 335, 825
- Dressler (1980) Dressler, A. 1980, ApJ, 236, 351
- Dressler et al. (1985) Dressler, A.; Thompson, I. B.; Shectman, S. A. 1985, ApJ, 288, 481
- Eke, Navarro, & Steinmetz (2001) Eke, V.R., Navarro, J.F., & Steinmetz, M. 2001, ApJ, 554, 114
- Faltenbacher et al. (2002) Faltenbacher, A., Gottlöber, S., Kerscher, M. & Müller, V. 2002, A&A, 395, 1
- Firmani & Avila-Reese (2000) Firmani, C., & Avila-Reese, V. 2000, MNRAS, 315, 457
- Firmani & Avila-Reese (2003) _______. 2003, in ”Galaxy Evolution: Theory and Observations”, eds. V. Avila-Reese et al., RevMexA&A (SC), 17, 109
- (33) Firmani, C., Hernández, X. & Gallagher, J. 1996, A&A, 308, 403
- Flores et al. (1993) Flores, R.A., Primack, J. R., Blumenthalk G. R. & Faber S.M. 1993, ApJ, 412, 443
- Frenk (2002) Frenk, C.S. 2002, Phil. Tran. Roy. Soc. 300, 1277
- Gao et al. (2004a) Gao, L., De Lucia, G., White, S. D. M., & Jenkins, A. 2004a, MNRAS, 352, L1
- Gao et al. (2004b) Gao, L., White, S. D. M., Jenkins, A., Stoehr, F. & Springel, V. 2004b, MNRAS, 355, 819
- Gardner (2001) Gardner, J.P. 2001, ApJ, 557, 616
- Ghigna et al. (1998) Ghigna, S., Moore, B., Governato, F., Lake, G., Quinn, T., & Stadel, J. 1998, mnras, 300, 146
- Ghigna et al. (2000) Ghigna, S., Moore, B., Governato, F., Lake, G., Quinn, T., & Stadel, J. 2000, ApJ, 544, 616
- Giovanelli & Haynes (1985) Giovanelli, R. & Haynes, M.P. 1985, ApJ, 292, 404
- Gnedin et al. (2004) Gnedin, O. Y., Kravtsov, A. V., Klypin, A. A. & Nagai, D. 2004, ApJ, 616, 16
- Gómez et al. (2003) Gómez, P.L., et al. 2003, ApJ, 584, 210
- Goto et al. (2004) Goto, T, Yagi, M., Tanaka, M., & Okamura, S. 2004, MNRAS, 348, 515
- Goto et al. (2003) Goto, T., Yamauchi, Ch., Fujita, Y., Okamura, S., Sekiguchi, M., Smail, I., Bernardi, M. & Gomez, P. L., MNRAS, 346, 601
- Gottlöber, Klypin & Kravtsov (2001) Gottlöber, S., Klypin, A., & Kravtsov, A.V. 2001, ApJ, 546, 223
- Gottlöber et al. (2003) Gottlöber, S., Łokas, E.L., Klypin, A.A., & Hoffman, Y. 2003, MNRAS, 344, 715
- Hogg et al. (2004) Hogg, D.W., et al. 2004, ApJ, 601, L29
- Hopkins et al. (2005) Hopkins, P.F., Bahcall, N.A., & Bode, P. 2005, ApJ, 618, 1
- Jimenez, Verde & Oh (2003) Jimenez, R., Verde, L., Oh, S. P. 2003, MNRAS, 339, 243
- Jing (1999) Jing, Y.P. 1999, ApJ, 515, 45
- Kauffmann et al. (1993) Kauffmann, G., White, S.D.M., & Guiderdoni, B. 1993, MNRAS, 264, 201
- Kauffmann et al. (2004) Kauffmann, G., White, S., Heckman, T. M., Menard, B., Brinchmann, J., Charlot, S., Tremonti, C., & Brinkmann, J. 2004, MNRAS, 353, 713
- Klypin & Holtzman (1997) Klypin, A.A., & Holtzman, J., 1997, preprint (astro-ph/9712217)
- Klypin et al. (1999) Klypin, A.A., Gottlöber, S., Kravtsov, A.V., & Khokhlov, A.M 1999, ApJ, 516, 530
- Klypin et al. (2001) Klypin, A.A., Kravtsov, A. V., Bullock, J.S., & Primack, J.R. 2001, 554, 903
- Kodama et al. (2001) Kodama, T., Smail, I., Nakata, F., Okamura, S., & Bower, R.G. 2001, ApJ, 562, L9
- Kravtsov et al. (1997) Kravtsov, A.V., Klypin, A.A., & Khokhlov, A.M., 1997, ApJS, 111, 73
- Kravtsov et al. (2004a) Kravtsov, A. V., Berlind, A. A., Wechsler, R. H., Klypin, A. A., Gottlöber, S., Allgood, B., & Primack, J. R. 2004a, ApJ, 609, 35
- Kravtsov et al. (2004b) Kravtsov, A.V., Gnedin, O.Y., & Klypin, A.A. 2004b, ApJ, 609, 482
- Lacey & Cole (1993) Lacey, C., & Cole, S. 1993, MNRAS, 262, 627
- Lemson & Kauffmann (1999) Lemson, G., & Kauffmann, G. 1999, MNRAS, 302, 111
- Lewis et al. (2002) Lewis, I., et al. 2002, MNRAS, 334, 673
- Manrique et al. (2003) Manrique, A., Raig, A., Salvador-Solé, E., Sanchis, T., & Solanes, J.M. 2003, ApJ, 593, 26
- Mo et al. (1998) Mo, H.J., Mao, S., & White, S.D.M. 1998, MNRAS, 295, 319
- Mo et al. (2004) Mo, H. J., Yang, X., van den Bosch, F. C. & Jing, Y. P. 2004, MNRAS, 349, 205
- Moore et al. (1996) Moore, B., Katz, N., Lake, G., Dressler, A. & Oemler, A., Jr. 1996, Nature, 379, 613
- Moore et al. (1999) Moore, B., Ghigna, S., Governato, F., Lake, G., Quinn, T., Stadel, J., Tozzi, P. 1999b, ApJ, 524, 19
- Nagai & Kravtsov (2005) Nagai, D. & Kravtsov, A. V. 2005, ApJ, 618, 557
- Navarro, Frenk, & White (1997) Navarro, J.F., Frenk, C.S., & White, S.D.M. 1997, ApJ, 490, 493
- Navarro et al. (2004) Navarro, J.F., Hayashi, E., Power, C., Jenkins, A.R., Frenk, C.S., White, S.D.M., Springel, V., Stadel, J., & Quinn, T.R. 2004, MNRAS, 349, 1039
- Okamoto & Habe (1999) Okamoto, T., & Habe, A. 1999, ApJ, 516, 591
- Peebles (1969) Peebles, P.J.E. 1969, ApJ, 155, 393
- Peirani et al. (2004) Peirani, S., Mohayaee, R., & de Freitas Pacheco, J.A. 2004, MNRAS, 348, 921
- Pimbblet et al. (2002) Pimbblet, K.A., Smail, I., Kodama, T., Couch, W.J., Edge, A.C., Zabludoff, A.I., & O’Hely, E. 2002, MNRAS, 331, 333
- Postman & Geller (1984) Postman, M. & Geller, M. J. 1984, ApJ, 281, 95
- Postman et al. (2005) Postman, M., et al. 2005, ApJ, in press (astro-ph/0501224)
- Power et al. (2003) Power, C., Navarro, J.F., Jenkins, A., Frenk, C.S., White, S.D.M., Springel, V., Stadel, J., & Quinn, T. 2003, MNRAS, 338, 14
- Reed et al. (2005) Reed, D., Governato, F., Quinn, T., Gardner, J., Stadel, ,J., & Lake, G. 2005, MNRAS, 387, 52
- Rojas et al. (2004) Rojas, R.R., Vogeley, M.S., Hoyle, F., & Brinkmann, J. 2004, ApJ, 617, 50
- Rosenbaum & Bomans (2004) Rosenbaum, S.D., & Bomans, D.J. 2004, A&A, 422, L5
- Sato et al. (2000) Sato, S., Akimoto, F., Furuzawa, A., Tawara, Y., Watanabe, M., & Kumai, Y. 2000, ApJ, 537, L73
- Sheth & Tormen (2004) Sheth, R. K. & Tormen, G. 2004, MNRAS, 350, 1385
- Smith et al. (2004) Smith, G. P., Treu, T., Ellis, R. S., Moran, S. M., & Dressler, A. 2004, astro-ph/0403455, ApJ, submitted
- Somerville & Primack (1999) Somerville, R.S., & Primack, J.R. 1999, MNRAS, 310, 1087
- Springel et al. (2001) Springel, V., White, S. D. M., Tormen, G., & Kauffmann, G. 2001, MNRAS, 328, 726
- Steinmetz & Navarro (1999) Steinmetz, M., & Navarro, J.F. 1999, ApJ, 513, 555
- Taffoni et al. (2003) Taffoni, G., Mayer, L., Colpi, M., & Governato, F. 2003, MNRAS, 341, 434
- Tanaka et al. (2004) Tanaka, M., Goto, T., Okamura, S., Shimasaku, K., & Brinkman, J. 2004, AJ, 128, 2677
- Tasitsiomi et al. (2004) Tasitsiomi, A., Kravtsov, A. V., Gottlöber, S. & Klypin A. A. 2004. ApJ, 607, 125
- Tovmassian et al. (2004) Tovmassian , H. M., Plionis, M. & Andernach, H. 2004, ApJ, in press (astro-ph/0411105)
- Tran et al. (2001) Tran, K.H., Simard, L., Zabludoff, A.I., & Mulchaey, J.S. 2001, ApJ, 549, 172
- Tran et al. (2002) Tran, K-V.H., Simard, L., Zabludoff, A.I., Mulchaey, J.S., 2002, ApJ, 549, 172
- Treu et al. (2003) Treu, T., Ellis, R. S., Kneib, J., Dressler, A., Smail, I., Czoske, O., Oemler, A., & Natarajan, P. 2003, ApJ, 591, 53
- van den Bosch (1998) van den Bosch, F. C. 1998, ApJ, 507, 601
- van den Bosch (2000) van den Bosch, F. C. 2000, ApJ, 530, 177
- van den Bosch et al. (2005) van den Bosch, F. C., Tormen, G. & Giocoli, C. 2005, MNRAS, 359, 1029
- Vitvitska et al. (2002) Vitvitska, M., Klypin, A., Kravtsov, A., Wechsler, R., Primack, J., & Bullock, J. 2002, ApJ, 581, 799
- Wechsler et al. (2002) Wechsler, R.H., Bullock, J.S., Primack, J.R., Kravtsov, A.V., & Dekel, A. 2002, ApJ, 568, 52
- Whitmore et al. (1993) Whitmore, B.C., Gilmore, D.M., & Jones, C. 1993, ApJ, 407, 489
- Zabludoff & Franx (1993) Zabludoff, A.I., & Franx, M. 1993, AJ, 106, 1314
- Zhao et al. (2003) Zhao, D. H., Mo, H. J., Jing, Y. P. & Börner, G. 2003, MNRAS, 339, 12
- Zentner et al. (2005) Zentner, A. R., Berlind, A. A., Bullock, J. S., Kravtsov, A. V. & Wechsler, R. H. 2005, ApJ, 624, 505