GRB050223: A faint Gamma-Ray Burst discovered by Swift
Abstract
GRB050223 was discovered by the Swift Gamma-Ray Burst Explorer on 23 February 2005 and was the first Gamma-Ray Burst to be observed by both Swift and XMM-Newton. At the time of writing (May 2005), it has one of the faintest GRB afterglows ever observed. The spacecraft could not slew immediately to the burst, so the first X-ray and optical observations occurred approximately 45 minutes after the trigger. Although no optical emission was found by any instrument, both Swift and XMM-Newton detected the fading X-ray afterglow. Combined data from both of these observatories show the afterglow to be fading monotonically as 0.99 over a time frame between 45 minutes to 27 hours post-burst. Spectral analysis, allowed largely by the higher through-put of XMM-Newton, implies a power-law with a slope of = 1.75 and shows no evidence for absorption above the Galactic column of 7 1020 cm-2.
From the X-ray decay and spectral slopes, a low electron power-law index of = 1.3–1.9 is derived; the slopes also imply that a jet-break has not occured up to 27 hours after the burst. The faintness of GRB050223 may be due to a large jet opening or viewing angle or a high redshift.
keywords:
gamma-rays:burstsReceived / Accepted
1 Introduction
The Swift Gamma-Ray Burst Explorer (Gehrels et al. 2004) was launched on 20th November 2004. It is a multi-wavelength observatory, covering the gamma-ray, X-ray and UV/optical bands. The observatory is designed to slew rapidly and autonomously to point narrow-field instruments (the X-ray and Ultra-Violet/Optical Telescopes - XRT and UVOT, respectively) towards any Gamma-Ray Bursts (GRBs) detected by the Burst Alert Telescope (BAT). This allows prompt observations of the afterglow on a timescale of minutes, much more quickly than was previously feasible on a regular basis. The on-board instruments are described in detail in Barthelmy (2004, 2005; BAT), Burrows et al. (2004, 2005; XRT) and Roming et al. (2004, 2005; UVOT).
Swift is significantly more sensitive to detecting GRBs than previous instruments capable of providing rapid, accurate (to within a few arcmin) localisations (e.g., HETE-2 and BeppoSAX). Thanks to its rapid repointing capability, Swift is also able to observe afterglows at early times. Since GRB afterglows fade rapidly, this ensures they are observed at their brightest, allowing Swift to detect fainter afterglows and thus look further down the GRB afterglow luminosity function than has previously been possible. Investigating the faint end of this function is of particular importance in understanding the structure of the bursts themselves. Faint bursts may be manifestations of many different effects, such as a large luminosity distance [Swift should be able to detect bursts out to z 15–20 (Lamb & Reichart 2000)] or differences in the fireball emission (shock generation, jet structure). Alternatively, they could be due to a separate population of low luminosity, relatively nearby (z 0.2) bursts (e.g. Sazonov et al. 2004). The combined study of the prompt and afterglow emission of these bursts will make it possible to distinguish between these possibilities.
Here results of Swift and XMM-Newton observations of GRB050223, which has one of the faintest X-ray afterglows to date, are presented and constraints are placed on some of the burst and afterglow parameters.
2 Observations
GRB050223 (Swift Trigger 106709) was detected by the Swift BAT at 03:09:06 UT on 23 February 2005 (Mitani et al. 2005), at a location of RA(J2000) = 18h05m34s, Dec(J2000) = 62∘2852, with an uncertainty of 4 arcmin; the burst was also detected by INTEGRAL (Mereghetti et al. 2005). Because of the Earth-limb constraint, the Swift spacecraft could not slew to the BAT position until 03:44 UT, at which point the observatory was in the South Atlantic Anomaly (SAA). The XRT began collecting data upon exiting the SAA, at 03:56:37 UT. An uncatalogued X-ray source was identified at RA(J2000) = 18h05m32.6s, Dec(J2000) = 62∘2819.7, with an uncertainty of 8 arcsec (Giommi et al. 2005); this is 33 arcsec from the BAT position. The UVOT began observations slightly before the XRT, at 03:55:28 UT.
Since this GRB was detected during the calibration phase of Swift, the XRT was in Manual State, where data-mode switching is not automatically enabled; there were, therefore, no automatic alerts sent out via TDRSS (the Tracking and Data-Relay Satellite System). Also, during the initial observation all data were obtained in Photon Counting (PC) mode, rather than the standard cycle starting with an Image Mode frame.
Swift software version 1.2 was used to process the XRT and BAT data. The BAT files were processed using the latest version (2.17) of the analysis script, which produces mask-weighted spectra and light-curves. For the XRT, events below a threshold of 80 DN (approximately 0.2 keV) were filtered out and the bad pixels removed. This method ensures that the event-file is as clean as possible, removing the effects of the sunlit Earth, and is the default pipeline method for later releases of the software.
Source and background spectra were then extracted using a circular region of radius 15 pixels (1 pixel = 2.36 arcsec). Only grade 0 events were used for the XRT PC mode spectra, since the response matrix (RMF) for these single pixel events (swxpc020010101v006.rmf) was the best calibrated at the time of analysis; using all calibrated grades (0–12) did not significantly improve the statistics. Grades 0–12 were used for the light-curves, however. The ftool xrtmkarf was used to generate suitable ancillary response function (ARF) files for the spectral fitting.
XMM-Newton also observed the field of GRB050223 (Gonzalez-Riestra et al. 2005; Rodriguez 2005; De Luca & Campana 2005). SAS v6.1 was used for these data, choosing patterns (equivalent to Swift grades) 0–12 for MOS and 0–4 for PN. Background light-curves showed frequent flaring for the later XMM-Newton observation, particularly in the PN data, so a small source extraction radius (35 arcsec) was used in addition to screening out the worst of the background contribution. The SAS tasks rmfgen and arfgen were then run to produce the RMF and ARF files respectively.
All spectra were grouped to a minimum of 20 counts per bin, in order to facilitate fitting in xspec v11.3.1. Throughout this Letter, errors are given at the 90 per cent level (e.g., = 2.7 for one degree of freedom).
2.1 Gamma-ray data
The BAT light-curve of GRB050223 shows a slow rise and fall, superimposed by several short peaks (Mitani et al. 2005; Figure 1). T90 for this burst is 23 seconds, while the peak flux, over a 1-second interval, was 0.8 photon cm-2 s-1 (15–350 keV; Mitani et al. 2005).

The INTEGRAL IBIS/ISGRI (Imager on-Board the INTEGRAL Satellite/INTEGRAL Soft Gamma-Ray Imager) instrument also detected GRB050223, measuring a peak flux (1-second integration) of 0.6 photon cm-2 s-1 over 20-200 keV (Mereghetti et al. 2005).
A single power-law gave a good fit (/dof = 48/57; Figure 2) for = 1.85 0.19111When considering spectral slopes in X-ray astronomy, the convention is to give the value as , the photon index, where f(E) E-Γ; f(E) in units of photon cm-2 s-1., which was not improved upon by using the Band model (Band et al. 1993). The energy fluence over 15–350 keV was 9.69 10-7 erg cm-2, placing it in the lowest third of the Swift-measured fluence distribution.

2.2 X-ray Data
Table 1 lists the times and durations of the X-ray data obtained from Swift and XMM-Newton. All the useful Swift data were obtained in PC mode, both for the initial (three orbits of data) and second (seven orbits when settled on the source) observations. The XMM-Newton MOS1 and MOS2 data were checked for consistency and then co-added for subsequent analysis. The XMM-Newton PN data are more badly affected by the high background, so are not presented here, but the results are in agreement with the MOS.
| Instrument | Observation | Orbit | Start time | End time |
|---|---|---|---|---|
| (s after BAT trigger) | (s after BAT trigger) | |||
| Swift XRT | 1 | 1 | 2847 | 3973 |
| Swift XRT | 1 | 2 | 9150 | 9710 |
| Swift XRT | 1 | 3 | 14665 | 15475 |
| Swift XRT | 2 | 1-7 | 38265 | 73530 |
| XMM MOS1/MOS2 | 3 | - | 35746/35745 | 49526/49533 |
| XMM MOS1/MOS2 | 4 | - | 57450/57527 | 96452/96456 |
2.2.1 Light-curve Analysis
Because of the location of GRB050223, most of the Swift-XRT pointings were close to the Earth limb (small ‘Bright Earth’ angles). This led to a high optical background in the field of view which, together with the afterglow being faint, complicated the X-ray data analysis.
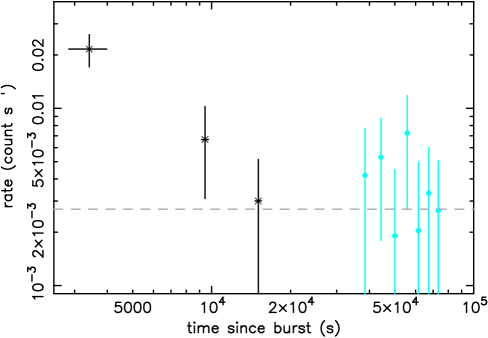
Light-curves were extracted for each individual orbit of data. Because of the faintness of the afterglow, there were very few counts in each of the orbit bins (Table 2) so, in order to improve the statistics, a large background region was used (circle of radius 60 pixels) and the number of background counts scaled down to the size of the source region (radius 15 pixels). The count-rates were corrected for the fractional exposure where required. As Figure 3 shows, only the first two orbits of data show count rates significantly above the background level of around 2.7 10-3 count s-1 (within the 15-pixel radius circle). Considering the second Swift observation as a whole, the source is detected at the 3 level (using the detect command in ximage).
| Observation number | Orbit number | Source counts | Time-bin (s) | Exposure fraction |
| 1 | 1 | 24.3 | 1125 | 0.89 |
| 1 | 2 | 3.7 | 560 | 0.96 |
| 1 | 3 | 2.4 | 810 | 0.84 |
| 2 | 1 | 1.7 | 400 | 1.0 |
| 2 | 2 | 2.6 | 495 | 1.0 |
| 2 | 3 | 0.7 | 385 | 1.0 |
| 2 | 4 | 2.8 | 380 | 1.0 |
| 2 | 5 | 0.7 | 340 | 1.0 |
| 2 | 6 | 1.7 | 525 | 1.0 |
| 2 | 7 | 1.6 | 590 | 1.0 |
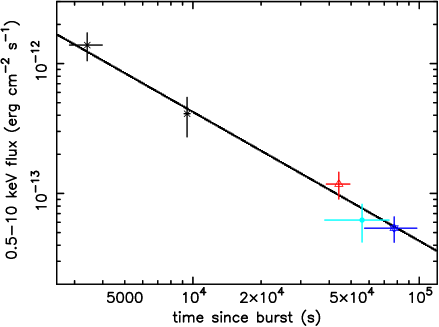
In order to compare the data from XMM-Newton (Obs. ID 0164570601) with the Swift results, the light-curve has to be plotted in terms of flux using the spectral fit given in Section 2.2.2, rather than count-rate, because of the differences between the two instruments. The background for the XMM-Newton-MOS detectors was checked and found to be about a third the count-rate of the source before the ground station outage, and about half afterwards, so the burst is clearly detected. A combined light-curve of the Swift and XMM-Newton observations is plotted in Figure 4, showing a decay slope222f(t,) t where = 1. of = 0.99. The second Swift observation occured simultaneously with the XMM-Newton observations, with the values from the different satellites being in good agreement.
2.2.2 Spectral Analysis
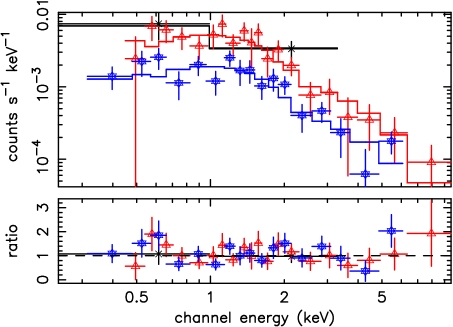
Because of the faintness of the X-ray afterglow and the high optical background, the Swift-XRT spectrum is of low statistical quality. However, simultaneously fitting the spectrum, derived from the three orbits in the first observation, and the co-added XMM-Newton-MOS spectra produces a good fit (/dof = 28/34; Figure 5) for a single power-law of = 1.75 absorbed by the Galactic column of 7 1020 cm-2 (Dickey & Lockman 1990), with a different constant of normalisation between the individual spectra. No change in spectral shape is found between the XMM-Newton spectra.
Note that the spectrum is shown in detected counts s-1 keV-1 for each of the instruments. Thus, while the XMM-Newton spectrum may have a higher count-rate, due to the higher throughput, this does not correspond to an increased flux.
The unabsorbed fluxes (0.5–10 keV) for observations one, three and four (as named in Table 1) were found to be (8.18) 10-13, (1.18) 10-13 and (5.42) 10-14 erg cm-2 s-1 respectively.
2.3 UV and Optical data
Neither the Swift-UVOT (Gronwall et al. 2005) nor the XMM-Newton Optical Monitor (Blustin et al. 2005) detected a source at the position of the X-ray afterglow. As mentioned above, the UVOT observation started about 46 minutes after the BAT trigger, due to the delayed slew; the XMM-Newton-OM data were collected 11 hours after the trigger.
No new sources were identified by ROTSE-III (to a limiting unfiltered magnitude of 18 from approximately a minute after the burst; Smith 2005), the Mount John University Observatory (to R = 20.5, 10 hours after the burst; Gorosabel et al. 2005) or the PROMPT robotic telescope array (limiting magnitude of 21 for Rc, V and Ic filters, with the mean time for these observations being 4–5 hours after the trigger; Nysewander et al. 2005).
3 Discussion
GRB050223 has, at the time of writing (May 2005), one of the faintest GRB X-ray afterglows observed by Swift; comparison with figure 1 of Piro (2004) shows the 11 hour flux of GRB050223 to be below all those detected by BeppoSAX.
3.1 Afterglow models
Three GRB afterglow models are initially considered, as summarised by Zhang & Mészáros (2003). The ‘ISM’ model has a fireball expanding into the (homogeneous) interstellar medium (Sari, Piran & Narayan 1998), while, in the ‘Wind’ model, the fireball expands into a wind environment, with the density, r-2 (Chevalier & Li 1999). In these models the beaming angle (1/, where is the Lorentz factor; this is simply the cone into which the emission is beamed due to relativistic effects) is less than any jet opening angle. As the jet slows down, 1/ will become larger; when it becomes equal to the opening angle, a transition, known as the jet-break, is seen. At this point, the emission observed decreases due to both the edge effect (less emission per unit solid angle is seen) and the sideways spreading of the causally-connected region. These effects may not happen simultaneously, but are thought to be close in time (Panaitescu & Mészáros 1999; Sari Piran & Halpern 1999). The third model is for post jet-break evolution, when the finite angular extent of the jet dominates (Sari et al. 1999), which is valid for both ISM and wind cases.
The reasonable assumptions that the X-ray afterglow lies above the synchrotron injection frequency () and that during the XRT observations, hours after the GRB, slow cooling is effective (i.e. , the X-ray frequency is greater than the cooling frequency) are made. Then the afterglow temporal decay and spectral indices ( = 0.99 and = 1.75) indicate an electron power-law index = 1.3–1.9 for a spherical blast-wave since = (3+10)/16 for the ISM case, (+6)/8 for wind cooling and (+6)/4 for the jet-dominated case, while is given by 1+(/2) for each (Dai & Cheng 2001).
The data are consistent with either an ISM or wind regime. For jet-dominated evolution the high frequency emission falls off as t-(p+6)/4, much steeper than the decay observed in GRB050223. As might be expected for these relatively early observations, our spectral and temporal slopes are inconsistent with post jet-break evolution.
A value of less than two is not generally thought to be physical (e.g., Panaitescu & Kumar 2001), although possible ways to generate such a flat spectrum have been suggested (e.g., Bykov & Mészáros 1996). A similarly low value for was among the possibilities for GRB050128 (Campana et al. 2005) if the observed change in slope of the decay-curve was caused by a jet-break in that burst.
A jet-break in the light-curve for a large opening angle would naturally occur at a late time (Piran 1999). A late jet-break is in agreement with the analysis above, which indicates that the outflow prior to the jet-break is being observed, with no indication of such a break up to at least 105 seconds. Jet-breaks are frequently observed at longer than a day after the burst (see, e.g., Frail et al. 2001), so this is not unusual. A large opening angle could also explain the relative faintness of the X-ray afterglow and the BAT fluence being at the lower end of the Swift fluence distribution.
The GRB jet opening angle can be estimated to be 0.35–0.4 rad using the observed correlations of gamma-ray fluence and X-ray afterglow decay index with a jet opening angle measured by jet-break times for ten GRBs by Liang (2004). Our jet angle estimate is relatively large compared to the sample of Frail et al. (2001). It should, however, be noted that the Liang relationships were derived from a sample of only ten bursts and doubts about their general applicability remain. Also, Bloom, Frail & Kulkarni (2003) list bursts (e.g., GRB000418 and GRB021004) which are bright, yet have larger than typical opening angles.
If GRB050223 produced a structured jet [that is, () ], then the faintness seen here could be due to a large viewing angle from the jet axis. In this case the viewing angle corresponds to a low energy density in the jet. The absence of a jet-break before one day in our data is consistent with an off-axis viewing angle (Zhang & Mészáros 2002; Rossi, Lazzati & Rees 2002).
Alternatively, the observed low afterglow flux and prompt fluence could be explained by GRB050223 being at high redshift. In this case, any jet-break is delayed by a factor proportional to . Indeed, Swift bursts to date are on average fainter than those detected by BeppoSax and HETE-2 (Piro 2004; Berger et al. 2005) and the median redshift of the six Swift bursts for which it has been measured so far is large, at z = 2.4, compared to a median z = 1.0 for non-Swift bursts333Values taken from Jochen Greiner’s website at http://www.mpe.mpg.de/jcg/grbgen.html.
4 Summary
Observations by Swift and XMM-Newton have shown GRB050223 to have faint prompt gamma-ray and X-ray afterglow emission. The X-ray data agree with the standard stellar wind and constant circumstellar density afterglow models if the electron power-law index, = 1.3–1.9. A jet-break does not appear to have occured up to one day after the burst. The faintness of GRB050223 may be due to a large jet opening or viewing angle, or a high redshift.
5 ACKNOWLEDGMENTS
We thank Don Lamb for useful comments on the paper and Jochen Greiner for his GRB afterglows website. This work is supported at the University of Leicester by the Particle Physics and Astronomy Research Council (PPARC), at Penn State by NASA contract NAS5-00136 and in Italy by funding from ASI (contract number I/R/039/04). JRC is supported by a National Research Council Associateship award at NASA’s Goddard Space Flight Center.
References
- [Band 1993] Band D. et al. , 1993, ApJ, 413, 281
- [Barthelmy 2005] Barthelmy S.D. et al. , 2005, Sp.Sc.Rev., in press (astro-ph/0507410)
- [Barthelmy 2005] Barthelmy S.D. et al. , 2004, SPIE, 5165, 175
- [Berger 2005] Berger E. et al. , 2005, ApJ, in press (astro-ph/0505107)
- [Bloom 2003] Bloom J.S., Frail D.A., Kulkarni S.R., 2003, ApJ, 594, 674
- [Blustin 2005] Blustin et al. , 2005, GCN 3093
- [Burrows 2005] Burrows D.N. et al. , 2005, Sp.Sc.Rev., in press
- [Burrows 2004] Burrows D.N. et al. , 2004, SPIE, 5165, 201
- [Bykov 96] Bykov A.M., Mészáros P., 1996, ApJ, 461, L37
- [Campana 2005] Campana S. et al. , 2005, ApJL, in press
- [Chevalier 1999] Chevalier R.A., Li Z.Y., 1999, ApJ, 520, L29
- [Dai 2001] Dai Z.G., Cheng K.S., 2001, ApJ, 558, L109
- [De Luca 2005] De Luca A., Campana S., 2005, GCN 3109
- [Dickey 1990] Dickey J.M., Lockman F.J., 1990, ARA&A, 28, 215
- [Frail 2001] Frail D.A. et al. , 2001, ApJ, 562, L55
- [Gehrels 2004] Gehrels N. et al. , 2004, ApJ, 611, 1005
- [Giommi 2005] Giommi P. et al. , 2005, GCN 3054
- [Gonzalez-Riestra 2005] Gonzalez-Riestra R. et al. , 2005, GCN 3060
- [Gorosabel 2005] Gorosabel J. et al. , 2005, GCN 3061
- [Gronwall 2005] Gronwall C. et al. , 2005, GCN 3057
- [Lamb 2000] Lamb D.Q., Reichart D.E., 2000, ApJ, 536, 1
- [Liang 2004] Liang E.W., 2004, MNRAS, 348, 153
- [Mitani 2005] Mitani T. et al. , 2005, GCN 3055
- [Nysewander 2005] Nysewander M. et al. , 2005, GCN 3067
- [Panaitescu 2001] Panaitescu A., Kumar P., 2001, ApJ, 560, L49
- [Panaitescu 1999] Panaitescu A., Mészáros P., 1999, ApJ, 526, 707
- [Piran 1999] Piran T., 1999, Physics Reports, 1999, 314, 575
- [Piro 2004] Piro L., 2004, 4th workshop on Gamma-Ray Bursts in the Afterglow Era, ASP Vol.312, in press (astro-ph/0402638)
- [Rodriguez 2005] Rodriguez P., 2005, GCN 3065
- [Roming 2005] Roming P.W.A et al. , 2005, Sp.Sc.Rev., in press (astro-ph/0507413)
- [Roming 2004] Roming P.W.A et al. , 2004, SPIE, 5165, 262
- [Rossi 2002] Rossi E., Lazzati D., Rees M.J., 2002, MNRAS, 332, 945
- [Sari 1999] Sari R., Piran T., Halpern J.P., 1999, ApJ, 519, L17
- [Sari 1998] Sari R., Piran T., Narayan R., 1998, ApJ, 497, L17
- [Sazonov 2004] Sazonov S.Y., Lutovinov A.A., Sunyaev R.A., 2004, Nat, 430, 646
- [Smith 2005] Smith D., 2005, GCN 3056
- [Zhang 2004] Zhang B., Mészáros P., 2004, Int.J.Mod.Phys, 19, 2385
- [Zhang 2002] Zhang B., Mészáros P., 2002, ApJ, 571, 876