Using Spitzer Colors as Diagnostics of Star Formation Regions: The Interacting Galaxy Arp 107
Abstract
We present Spitzer infrared imaging of the peculiar galaxy pair Arp 107, and compare with an optical H map and a numerical model of the interaction. The [3.6] [4.5] colors of clumps in the galaxy do not vary around the ring-like primary spiral arm and are consistent with those of stars, thus these bands are dominated by starlight. In contrast, the [5.8 m] [8.0 m] colors are consistent with those of interstellar dust, and vary by about 0.2 magnitudes around the ring/spiral, with redder colors associated with regions with stronger star formation as indicated by H and mid-infrared luminosity. The [4.5 m] [5.8 m] colors for clumps in this arm are bluer than dust and redder than stars, and vary by 1.3 magnitudes around the arm. This color is therefore a measure of the relative number of young stars to old stars, with a redder color indicating a higher proportion of young stars. There is a clear azimuthal sequence in the [4.5] [5.8] color around the arm, indicating a sequence in average stellar age. The LHα/L8.0μm ratio varies around the arm by a factor of 7; this variation may be due to extinction or to PAH excitation by non-ionizing photons. Our model of Arp 107 accounts for the general morphology of the system, and explains the age variation along the arm as the result of differences in the time of maximum compression in the arm. Using Spitzer colors, we are able to distinguish background quasars and foreground stars from star forming regions associated with Arp 107.
1 Introduction
Tidal interactions, collisions, and mergers of galaxies play a major role in the evolution of galaxies, drastically modifying both the morphology and the star formation rates of galaxies (see review by Struck, 1999). Interaction-induced star formation was first investigated by Larson & Tinsley (1976) and Struck-Marcell & Tinsley (1978), who provided evidence that interacting galaxies have a larger scatter in star formation properties than isolated galaxies. The Infrared Astronomical Satellite (IRAS) revealed a new population of high infrared luminosity galaxies with large star formation rates (Soifer et al., 1987; Smith et al., 1987) that are the result of mergers (Sanders et al., 1988). Mid-infrared observations with the Infrared Space Observatory (ISO) suggested that the mid-infrared is a good measure of the global star formation rate in galaxies (Roussel et al., 2001; Förster Schreiber et al., 2004). The mid-infrared emission is dominated by broad dust emission features, which are believed to be due to polycyclic aromatic hydrocarbons (PAHS) (Léger & Puget, 1984; Allamandola, Tielens, & Barker, 1985). With the advent of the Spitzer infrared telescope (Werner et al., 2004), higher angular resolution mid-infrared imaging of galaxies is now possible, making feasible the detailed study of individual star formation complexes in interacting systems.
In this paper, we present Spitzer infrared images of the interacting galaxy pair Arp 107 (UGC 5984), and compare with an optical H map to investigate the properties of star forming clumps with the galaxy. We also present a new numerical model of the interaction. The larger galaxy in the pair has a Seyfert 2 nucleus (Keel et al., 1985), a strong primary spiral arm with a partial ring-like structure, and a tidal tail (Arp, 1966; see Figure 1). It is connected to the smaller companion by a bridge. Arp 107 is at a distance of 138 Mpc (Keel et al., 1985), asssuming Ho = 75 km s-1 Mpc-1.
Globally, Arp 107 has a relatively low normalized star formation rate compared to other interacting galaxies. Its far-infrared luminosity (40 120 m) is 1.1 1010 L, similar to the median for other Arp Atlas galaxies, however, it has a far-infrared to blue luminosity ratio LFIR/LB = 1.6 and an IRAS 60-to-100 m flux ratio F = 0.19, at the low end of the range for Arp galaxies (Bushouse, Lamb, & Werner, 1988). Arp 107 is relatively rich in gas, with a total HI mass of 1.2 1010 M (Bushouse, 1987) and a molecular gas mass of 9.6 109 M in a 22′′ beam (Zhu et al., 1999), assuming the standard Galactic ICO/NHI ratio (Bloemen et al., 1986).
2 Observations
2.1 Spitzer Observations
Images of Arp 107 were made on December 17, 2004 in the 3.6, 4.5, 5.8, and 8.0 m broadband filters of the Spitzer Infrared Array Camera (IRAC; Fazio et al., 2004). The full bandwidths of these filters at 50% of the average in-band transmission are 0.75 m, 1.01 m, 1.42 m, and 2.93 m, respectively (Fazio et al., 2004). A total of 23 dithered exposures of 12 seconds each were made per filter, giving a total integration time per filter of 276 seconds. The standard post-pipeline Basic Calibrated Data (post-BCD) mosaicked images were used for this analysis, providing a platescale of 12 per pixel. The FWHM of the point spread function at 3.6, 4.5, 5.8, and 8.0 m are 17, 17, 19, and 20, respectively (Fazio et al., 2004). The total field of view mapped with IRAC is 90 148, with the long axis at a position angle of 19.8∘ east of north. For 3.6, 4.5, 5.8, and 8.0 m, the rms noise levels in the final maps are 0.0072, 0.0099, 0.041, and 0.041 MJy sr-1, respectively.
Additional observations of Arp 107 were made on December 3, 2004, using the 24 m filter (bandwidth 5 m) of the Spitzer Multiband Imaging Photometer (MIPS; Rieke et al., 2004). Two 10-second cycles were made with the standard photometry AOT, giving an effective exposure of 312 seconds. The pixel size of the post-BCD images is 245, and the FWHM of the point spread function is 6′′. The total field of view mapped is 74 81, with the long axis of the field of view at a position angle of 23.9∘ east of north. The final rms noise level in this map is 0.048 MJy sr-1.
2.2 Optical Observations
Optical images of Arp 107 were obtained with the 0.6 meter Erwin Fick telescope in Boone Iowa on 2005 April 8, 14, and 15, under clear dark skies. An 1024 1024 Andor DU434-BV CCD was used with a pixel size of 105, giving a field of view of 179. A total of seven 120 second exposures were made in a broadband R filter, along with 7 450 second images in a redshifted H filter centered at 6814Å with FWHM 73Å. For Arp 107, this filter contains both H and the [N II] 6583 line. The data were reduced in the standard way using the Image Reduction and Analysis Facility (IRAF222IRAF is distributed by the National Optical Astronomy Observatories, which are operated by the Association of Universities for Research in Astronomy, Inc., under cooperative agreement with the National Science Foundation.) software. Continuum subtraction was accomplished using the scaled R band image. The standard star Feige 56 was observed for H calibration. The H calibration is estimated to be accurate to 30.
3 RESULTS
3.1 The Optical Images
The final co-added Fick R band image of Arp 107 is presented in Figure 1. In this image, the strong primary arm/ring-like structure is apparent in the south, which connects to a tidal tail to the northwest. A bridge connects the main galaxy to a compact companion to the northeast. The bridge appears double in this image, and a plume is visible to the northeast of the companion.
The continuum-subtracted H+[N II] map is shown in Figure 2. Seven star formation regions were detected in the ring/arm, in addition to the Seyfert nucleus. The H+[N II] luminosities of these HII region complexes range from 4 1039 erg s-1 to 3 1040 erg s-1 in 5′′ circular apertures (see Table 1). These are similar to those of the most luminous HII regions in ring galaxies (Marston & Appleton, 1995; J. Higdon 2004, private communication). The total H+[N II] luminosity for this system, excluding the Seyfert nucleus, is 1.1 1041 erg s-1, at the lower end of the range for the ring galaxies in the Marston & Appleton (1995) sample. For the Seyfert nucleus, L 2 1041 erg s-1, consistent with the Keel et al. (1985) measurements. The 3 L upper limit for the companion is 4 1040 erg s-1. Approximately correcting for [N II] in the filter and excluding the Seyfert nucleus, the far-infrared to H luminosity ratio for Arp 107 is LFIR/LHα 520. This is typical of interacting galaxies (Bushouse, 1987).
3.2 The Spitzer Images
The Spitzer images at the five wavelengths are presented in Figure 3. The morphology of this system varies with wavelength. The bridge is clear at 3.6 m but almost disappears by 8.0 m. In contrast, the knots in the northwestern part of the ring/arm are more prominent at 8.0 m than at 3.6 m. The companion is very faint at 24 m but the ring/arm is clearly seen. The double bridge structure is visible in the two shorter wavelength IRAC bands.
At 3.6, 4.5, 5.8, 8.0, and 24 m, the total flux densities for the larger galaxy in the pair are 21.7 mJy, 14.2 mJy, 19.9 mJy, 38.0 mJy, and 53.4 mJy, respectively. For the smaller galaxy, the total flux densities are 13.2 mJy, 8.5 mJy, 13.0 mJy, 4.4 mJy, and 0.48 mJy, respectively. Absolute calibration uncertainties are 10 (IRAC Data Manual; MIPS Calibration Manual). Statistical uncertainties are 1, except for the companion at 8.0 and 24 m (2 and 17, respectively). Ambiguities in selecting the boundaries of the galaxies and sky subtraction introduce an additional uncertainty of 20 in most cases, 40 at 5.8 m, and 60 for the companion at 24 m.
The global LHα/L8.0μm and LHα/L3.6μm ratios are 0.0083 and 0.012, respectively, for the main galaxy (excluding the Seyfert nucleus), and 0.025 and 0.0061 for the companion. For comparison, the global log LHα/L8.0μm and LHα/L3.6μm ratios for the spiral galaxy NGC 7331 are 0.013 and 0.030, respectively, calculated using the Young et al. (1996) H measurement and the Spitzer flux densities of Regan et al. (2004).
3.3 IRAC Colors of Star Forming Clumps
In the 8 m image, 29 clumps were identified by eye in the vicinity of Arp 107. These are labeled on the 8 m image in Figure 4, encircled by 5′′ radii regions, and are listed in Table 1. Note that some fainter clumps are not included. When a second fainter clump was very close to a brighter clump so that their regions strongly overlapped, the second clump was excluded.
Photometry of these clumps was done using the IRAF daophot routine, with 4.1 pixel (5′′) radii apertures (Table 1). For background subtraction, the local galaxian background was determined using the mode in an annulus surrounding the source, with an inner radius of 5 pixels (6′′) and an outer radius of 10 pixels (12′′). To estimate the uncertainty in the Spitzer colors of the clumps due to background subtraction, we experimented with varying the method of determining the sky. In addition to the statistical uncertainties determined from the rms in the background annuli, in calculating the colors we added in quadrature a second uncertainty term, determined from comparing the clump colors obtained with the above method with those obtained with slightly larger inner and outer annulus radii of 7 pixels (84) and 12 pixels (144). This additional term increases the median size of the final uncertainties in the [3.6] [4.5], [4.5] [5.8], [5.8] [8.0], and [3.6] [8.0] colors by 15, 33, 8, and 66, respectively.
No color corrections were made in determining the IRAC colors. Aperture corrections were included, although they have only a tiny effect on the IRAC colors of these clumps. As given in the IRAC Data Manual, the aperture corrections are 1.06, 1.06, 1.07, and 1.09 for IRAC bands 1 4, thus the changes to the IRAC colors due to the aperture corrections are negligible. These clumps are unresolved or barely resolved at the resolution of the mosaicked images (24 36, compared with 20 24 for bright point sources in the field).
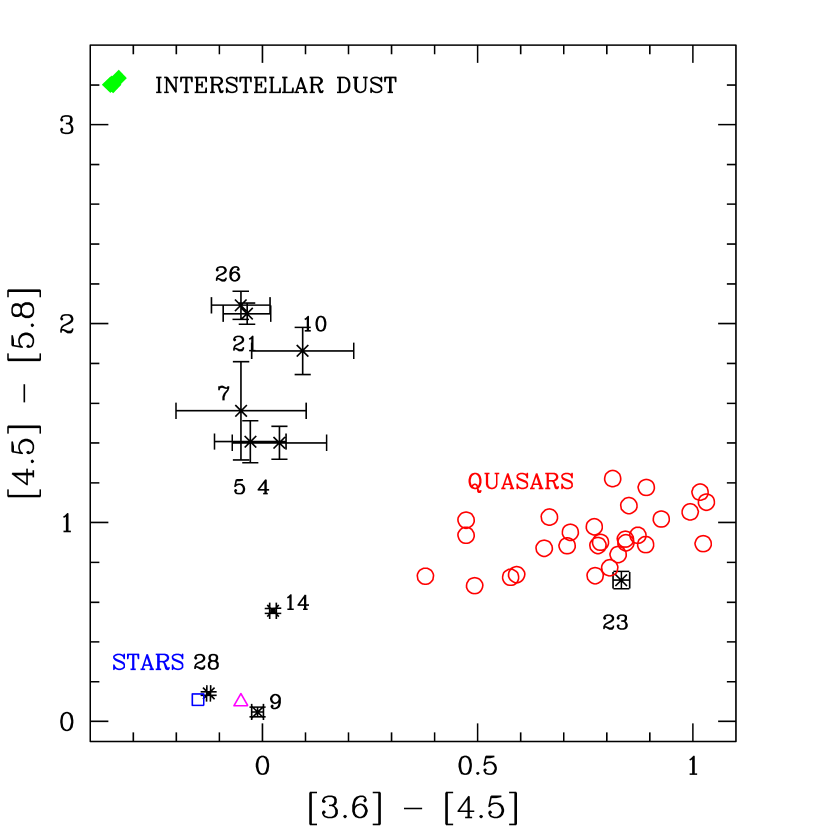
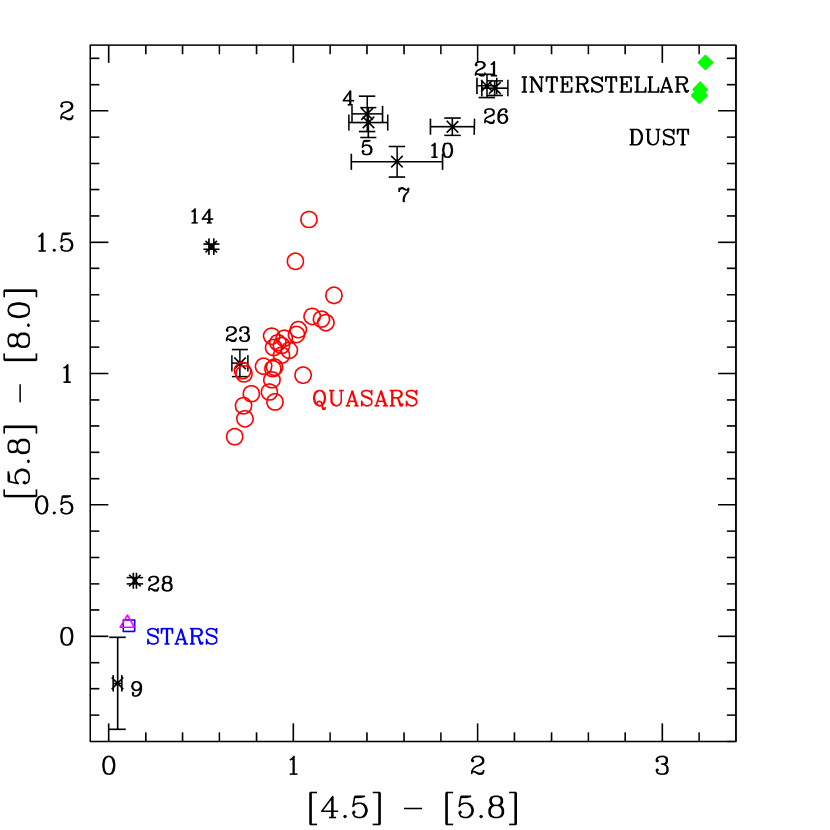
In Figures 5 and 6, the IRAC colors of the brightest 8 m clumps in Arp 107 are plotted (black crosses) and identified. Both statistical and background selection uncertainties are included in these plots, but absolute calibration uncertainties (10; IRAC Data Manual) are not included. Figures 5 and 6 also contain the colors of M0III stars (open dark blue square) (from M. Cohen 2005, private communication) and the mean colors for the field stars in Whitney et al. (2004) (magenta triangle). The colors of normal stars all lie within 0.5 magnitudes of 0,0 on these plots (M. Cohen 2005, private communication). The green diamonds in these figures mark the predicted IRAC colors for interstellar dust from Li & Draine (2001) (see Table 5 in that paper), for a very large range of interstellar radiation field (ISRF) intensities (from 0.3 10,000 that in the solar neighborhood). Note that the IRAC colors of the Li & Draine (2001) dust model varies very little with ISRF. The red circles in Figure 5 show the locations of the Sloan Digitized Sky Survey quasars in the Spitzer Wide-Area Infrared Extragalactic Survey (SWIRE) Elais N1 field (Hatziminaoglou et al., 2005). These quasars have redshifts between 0.5 and 3.65; since their spectral energy distributions are power laws, their infrared colors do not vary much with redshift.
The colors of Source #23 (the bright source to the west of the galaxy) are similar to those of the quasars. Thus this is likely a background quasar, unassociated with Arp 107. The nucleus of the companion, source #28, is very blue, with stellar colors at all wavelengths. Thus it contains almost all old stars and little ISM. This is consistent with its absorption-line optical spectrum (W. Keel 2005, private communication). The nucleus of the primary galaxy, #14, is also quite blue, suggesting an old stellar population, but not as old as the companion nucleus #28. This nucleus also has some interstellar matter, as shown by its large [5.8] [8.0] color. Source #9, a concentration inside the radius of the ring, also has colors indicative of an old star, suggesting it is a foreground star. This is confirmed by its optical spectrum, which is that of an M12V star (W. Keel 2005, private communication).
The clumps in the upper part of Figure 6 have [5.8] [8.0] colors close to that predicted by the Li & Draine (2001) dust model, indicating that these wavelengths are dominated by dust. The 8.0 m IRAC band includes the strong 7.7 and 8.6 m PAH emission features as well as a dust continuum from transiently-heated very small grains, while the 5.8 m IRAC band contains the 5.7 m PAH feature (Li & Draine, 2001). In contrast, the [4.5] [5.8] colors of the Arp 107 clumps are much bluer than those of dust, thus there are stellar contributions at 4.5 m. The [3.6] [4.5] colors of these clumps are similar to those of stars (Figure 5), indicating that these bands are dominated by starlight.
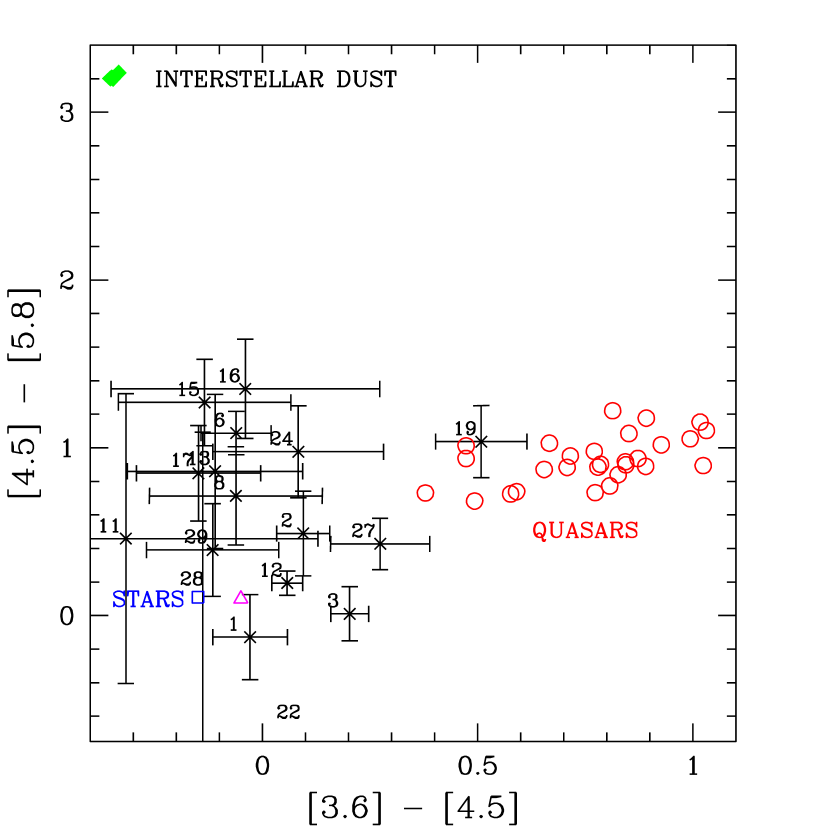
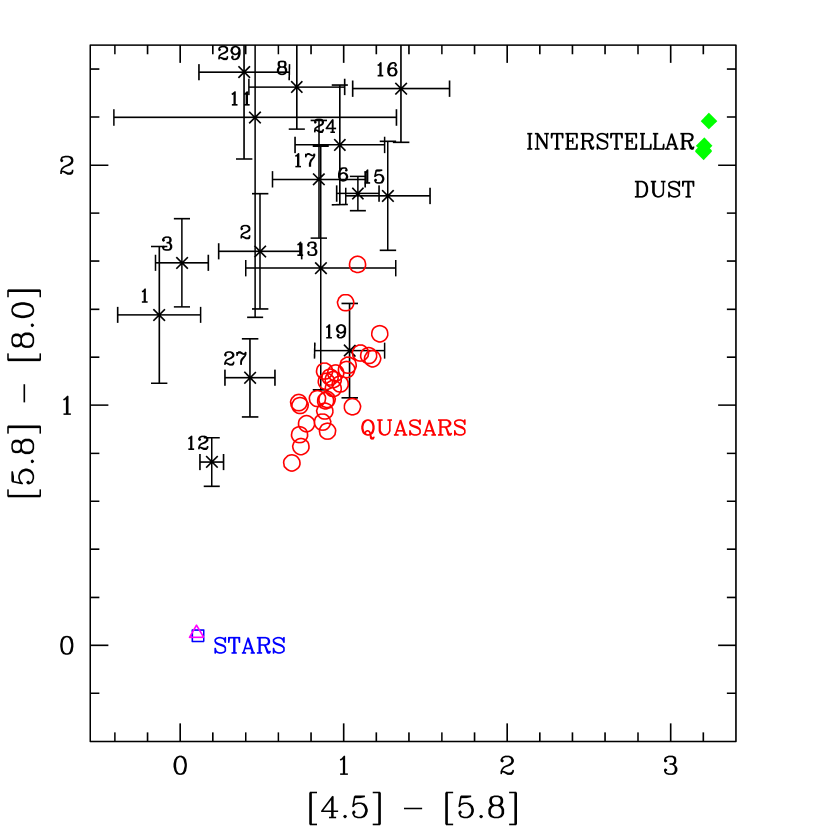
In Figures 7 and 8, we have plotted the IRAC colors of the fainter Arp 107 clumps. The colors of Source #19, off the western side of the galaxy, indicate that it is likely a background quasar. Sources #1, #2, and #3 (south of the ring), #12 (west of the ring), #27 (in the bridge), #29 (at the northern tip of the tail), and #25 (northwest of the ring) have [3.6] [4.5] and [4.5] [5.8] colors like old stars, but have excess emission in the 8.0 m band compared to old stars. This suggests that either these are very old star formation regions associated with the galaxy, with some PAH emission but mainly cooler stars, or they are foreground stars, and the 8 m band is contaminated by extended dust emission from Arp 107.
3.4 An Azimuthal Color Gradient Around the Ring/Arm
In the [4.5] [5.8] vs. [5.8] [8.0] plot for the bright clumps (Figure 6), there is a sequence of sources at an almost constant [5.8] [8.0] color of 2, with increasing [4.5] [5.8] colors. The sequence from left to right at the top of Figure 6 is a sequence in increasing ratio of young stars/old stars. This sequence, #4, #5, #7, #10, #21, and #26, is the order these clumps appear in the ring/arm, going in a counterclockwise direction from #4 to #26. The northern part of the ring/arm (clumps #21 and #26) has a younger stellar population than the southern part (#4 and #5) on average. This trend in the [4.5] [5.8] color is better shown in Figure 9, plots of position angle (east of north) vs. the IRAC colors. There is a strong azimuthal variation in the [4.5] [5.8] color of 1.3 magnitudes. In contrast, no variation is visible in the [3.6] [4.5] color around the ring/arm. The approximately constant [3.6] [4.5] color of 0.0 around the ring/arm suggests that these bands are dominated by emission by cool stars.
In the [5.8] [8.0] color, the variation is small (0.2 magnitudes) compared to that in [4.5] [5.8], and the northern clumps are redder in [5.8] [8.0] than the southern clumps. This small variation and the similarity to the colors of interstellar dust indicates that these two bands are dominated by dust emission, and the dust spectrum does not vary strongly around the ring/arm. The [5.8] [8.0] color increases in the north, in the regions where the H and mid-infrared luminosities get larger (see Section 3.6). Thus this color gets redder as the ISRF gets stronger, as predicted by theoretical models of interstellar dust (see Table 5 in Li & Draine, 2001). As the ISRF increases, the underlying mid-infrared continuum from very small grains increases, contributing to the 8 m IRAC band, and producing redder [5.8] [8.0] colors.
Figure 9 shows a large variation in the [3.6] [8.0] color around the ring/arm (bottom panel), which is mainly due to changes in the [4.5] [5.8] color (second panel).
3.5 The IRAC-MIPS Colors of Clumps
From the MIPS 24 m map, 24 m fluxes were measured using a 5′′ radius aperture. The background was determined using the mode in an annulus with an inner radius of 10′′ and an outer radius of 15′′. The 5′′ radius aperture is too small to include all of the light from the clump, given the 6′′ FWHM PSF for MIPS 24 m observations and the 2.45′′/pixel plate scale. Using a larger aperture radius, however, is not a viable option, since the clumps are crowded. Thus a substantial aperture correction is required. According to the MIPS Data Handbook, a 5′′ aperture includes only 50 of the total light from a point source. Testing this using large aperture data for the isolated source #23 (which may be a background quasar; see Section 3.3) and two bright sources in the field far from the galaxy, we get consistent aperture corrections. This correction and the 8 m aperture correction given above increases the [8.0] [24] colors by 0.65 magnitudes. No color corrections were included in determining these colors. To estimate the uncertainty in the colors due to the selection of background regions, we also calculated colors with a smaller background annulus with inner radius of 5′′ and outer radius of 10′′, and compared with the original colors. This additional color uncertainty was added in quadrature to the statistical uncertainty. This extra factor increases the sizes of the errorbars on the IRAC-MIPS colors of the clumps by a factor of 2.7 over the statistical errors.
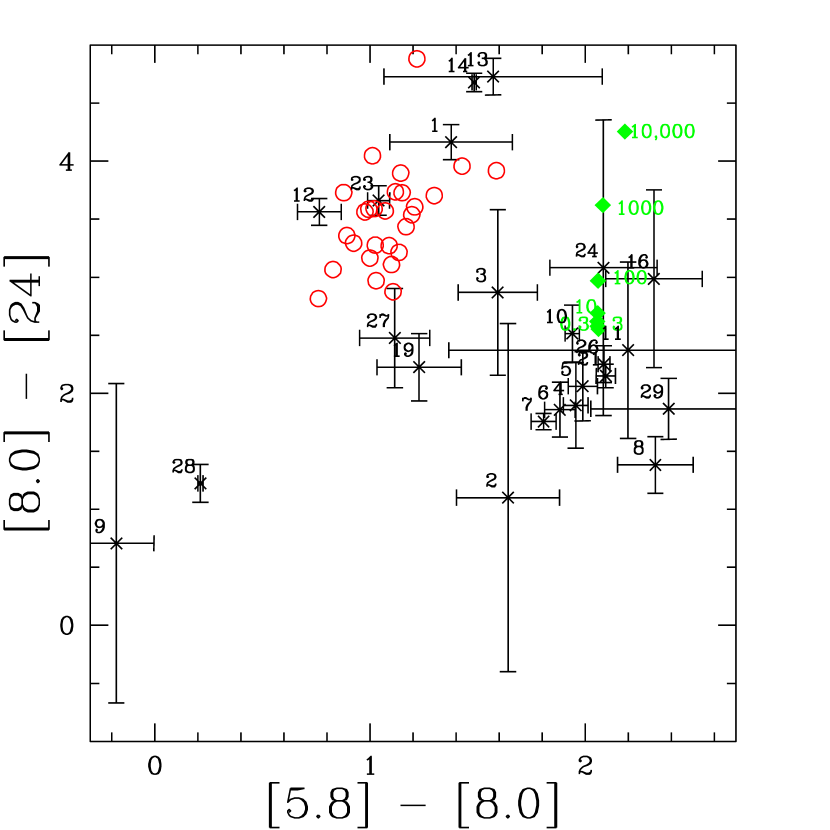
In Figure 10, the [5.8] [8.0] vs. [8.0] [24] aperture-corrected colors for the clumps are plotted. The green diamonds show the locations of the Li & Draine (2001) dust models for various ISRFs. The red circles are the locations of the Hatziminaoglou et al. (2005) quasars. Stellar photospheres are expected to lie near [5.8] [8.0] 0, [8.0] [24] 0.
The foreground star #9 again has colors similar to those of stars, as expected. The [8.0 m] [24 m] color of Source #23, like its IRAC colors, is similar to those of the quasars, further supporting the hypothesis that it is a background quasar. Sources #1 and #12 are also in the vicinity of the quasars. In this plot, the Seyfert nucleus, clump #14, has colors similar to those of quasars, with a very red [8.0] [24] color. The nucleus of the companion, #28, shows a small excess relative to the expected [8.0] [24] color of stars (0.0), thus there may be a small amount of cold dust associated with this nucleus.
The [8.0] [24] colors of the brightest ring/arm clumps, #10, #21, and #26, are similar to those expected for standard dust models with weak radiation fields (approximately solar neighborhood). This is consistent with their relatively low observed average 5 8.5 m surface brightnesses of 10 L pc-2, which corresponds to an ISRF of 2 times that in the solar neighborhood, according to Förster Schreiber et al. (2004). In Figure 11, the [8.0] [24] colors for the ring/arm clumps are plotted as a function of position angle. A possible trend is seen, in that the clumps near the southern part of the ring/arm, #4 #7, have slightly bluer [8.0] [24] colors than those in the northwest, however, this is uncertain. If this is confirmed, it would imply that the ISRF is stronger in the northern part of the ring/arm, as also indicated by the IRAC colors.
3.6 H to Mid-Infrared Ratios
Of the extra-nuclear star formation regions in Arp 107, only clumps #4, #5, #7, #10, #16, #21, and #26 were detected in H, with clumps #4 and #5 detected at the 5 level (Section 3.1; Table 1). In the top panel of Figure 12, for the selected clumps we compare the ratio of the H luminosity LHα to the 3.6 m luminosity L3.6μm with the 8.0 m magnitude, correcting for [N II] in the H filter assuming [N II]/H 0.3. In the second panel of Figure 12, we plot LHα/L8.0μm vs. the 8.0 m magnitude. For the clumps detected in H, log LHα/L8.0μm 1.3 to 2.2.
Figure 12 shows that clumps #4, #5, #6, and #7 are deficient in observed H compared to clumps #10, #21, and #26. The ratios LHα/L8.0μm and LHα/L3.6μm vary systematically around the ring/arm (Figure 13), with LHα/L8.0μm 2 11 times larger in the north and west compared to the south and east.
One possible explanation for the low LHα/L8.0μm ratios in clumps #4 7 is that these clumps have some contributions to their 8 m emission from starlight. However, the fact that their [5.8] [8.0] colors are similar to those of interstellar matter and also to the other clumps in the ring/arm indicates that this is not the case.
A second hypothesis is that in clumps #10, #21, and #26, strong radiation fields may be destroying the PAH molecules contributing to the 8.0 m Spitzer data, causing an increase in LHα/L8.0μm. Using ISO data for a large sample of spiral and starburst galaxies, Förster Schreiber et al. (2004) found a good correlation between the mid-infrared luminosity and inferred star formation rates for 5 8.5 m surface brightnesses below 104 L pc-2; above this surface brightness, the mid-infrared appeared weaker than expected, suggesting PAH destruction. In Arp 107, however, such large-scale PAH destruction is not expected to happen, since the radiation fields are not intense enough. For the brightest clumps in the Arp 107 ring/arm, the 5 8.5 m surface brightnesses of 10 L pc-2 are well below this threshold, thus large-scale PAH destruction is not expected. Furthermore, the [5.8] [8.0] colors of clumps #21 and #26 are slightly redder than those of #4 and #5, opposite to what would be expected if the 8 m broadband flux is being depressed due to destruction of PAHs by an intense UV field.
A third possibility is that non-ionizing photons in the southern part of the ring/arm contribute significantly to heating the PAH molecules, and therefore the 8 m band is not a perfect tracer of star formation. PAH excitation by non-ionizing photons has been noted in reflection nebulae (Sellgren et al., 1990; Uchida, Sellgren, & Werner, 1998; Uchida et al., 2000; Li & Draine, 2002), and has been suggested as a contributor to the global mid-infrared of spiral galaxies based on ISO data (Boselli, Lequeux, & Gavazzi, 2004). The PAH features may therefore be a tracer of B stars as well as O stars (Peeters, Spoon, & Tielens, 2004). If the southern and eastern part of the ring/arm contains a significant post-starburst population, these moderately-young stars may be sufficient to excite the PAH molecules and produce the observed mid-infrared emission. The bluer [4.5] [5.8], [5.8] [8.0], and [8.0] [24] colors of the southern clumps #4 and #5 compared to clumps #21 and #26 suggest that the mid-infrared continuum from very small grains is weaker in the south, and therefore the exciting UV field is weaker. This is consistent with the hypothesis of an older stellar population in the south. This possibility should be investigated further with optical and infrared spectroscopy and stellar population synthesis modeling.
A fourth possibility is that the H emission is more extincted in the clumps in the southern and eastern part of the ring/arm compared to the northwest. A relative extinction of AV 1.5 magnitudes around the ring/arm could account for the observed deficiency in the H luminosity. This possibility should be tested further with optical spectroscopic measurements of the Balmer decrement and/or high angular resolution CO and HI maps. This will determine whether the observed azimuthal trend in LHα/L8.0μm in the ring/arm is due to extinction or to PAH excitation by non-ionizing photons.
In the LHα/L3.6μm vs. [8.0] plot, the same trends are seen: the LHα/L3.6 ratios for clumps #4, #5, #6, and #7 are lower than clumps #10, #21, and #26. The foreground star #9 has a very low LHα/L3.6μm ratio, as expected.
4 A Numerical Model of the Encounter
The morphology of the primary galaxy in Arp 107 consists of a small central bar-like bulge and a single strong spiral arm with a ring-like shape. Most of this arm is quite circular, though the circle is not centered on the bulge and nucleus. Given this, and the fact that there is material between the companion and the primary, like parts of a bridge, the system also looks like an asymmetric colliding ring galaxy (Lynds & Toomre, 1976; Theys & Spiegel, 1977; Appleton & Struck, 1996). On the other hand, off-center ring waves usually look like ovals, not one-armed spirals (Toomre, 1978; Struck-Marcell, 1990; Smith & Wallin, 1992). In addition, our Spitzer maps reveal a strong azimuthal gradient in the ratio of young stars to old stars around the ring of Arp 107. This asymmetry is also consistent with the hypothesis that this structure was produced by an off-center collision between two galaxies. Theoretical models suggest that such encounters lead to strong azimuthal variations in the gas density and star formation rate in collisional rings (Appleton & Struck-Marcell, 1987; Struck-Marcell & Appleton, 1987; Charmandaris, Appleton, & Marston, 1993).
No complete velocity field of Arp 107 is currently available. However, Keel (1996) obtained a long-slit optical spectrum of Arp 107 along a position angle of 41∘ east of north. He found that the southwestern side of the main disk is redshifted compared to the nucleus. The companion has a velocity cz = 10,572 50 km s-1, redshifted by 200 km s-1 from the main galaxy (W. Keel 2005, private communication).
To resolve the nature of this collisional system and to better understand the structure of the star formation in the arm we have attempted to numerically model it. Given that we have limited kinematical information and very little information on the gas distribution, we have not attempted to model it in great detail, but rather to produce a reasonable preliminary model.
4.1 Details of the Model
We have used the SPH code described in Struck (1997). The version used here is essentially the same as that used in Struck & Smith (2003). Briefly, this code uses rigid dark halo potentials for the two galaxies, and hydrodynamic forces are computed on a grid with fixed spacing. Local gravitational forces are computed between particles in adjacent cells. The galaxy disks are made up of gas particles and collisionless star particles of equal mass. In these models the particle numbers were as follows: 34,550 primary disk gas particles, 18,090 companion disk gas particles, 7890 primary star particles and 2490 companion star particles.
Because the companion appears to be an early type galaxy, its star particles were initialized with a large range of distances from the central plane and a large velocity dispersion perpendicular to that plane to give a very thick disk or bulge-like structure. A substantial gas disk was also added to the companion, even though there is no evidence for the existence of a gas disk. The goal was to see how it would be affected by the collision, and whether we would expect it to be detectable in current or future observations.
We adopt the following scaling constants for the model: time unit = 400 Myr, length unit = 2.0 kpc, and mass unit = . With these scalings we obtain a peak rotation velocity in the primary of about 170 km/s, which is reasonable within the very limited constraints.
The mass ratio of the two galaxies, determined by comparing the mass of each within a radius of 10 kpc, is 0.16. The form of the rigid potential used gives a test particle acceleration of,
| (1) |
where is a halo mass scale, is a core radius (set to 4.0 and 2.0 kpc for the primary and companion, respectively), and the index specifies the compactness of the halo. For the primary we use , which gives a flat rotation curve at large radii. For the companion we take , which gives a declining rotation curve at large radii. This latter choice seems to produce somewhat better results than two flat rotation curves, but we have not undertaken a detailed examination of the effects of different values for these exponents. Because the two galaxies have different halo potentials, the effective mass ratio (i.e., the ratio of masses contained within radii equal to the galaxy separation) is large for small separations, and small for large large separations. This effect makes encounters between the two galaxies quite impulsive. The model presented here does not include the effects of dynamical friction, but other runs included a Chandrasekhar-like frictional term (see Struck & Smith, 2003). This term was found to be negligible except for brief times near closest approach. It had a small effect at the first closest approach, but ultimately draws the two galaxies into a merger at times past the present (the second close encounter).
The initial disk sizes were as follows: primary gas disk = 15 kpc, primary star disk = 12 kpc, companion gas disk = 9.0 kpc, and companion star disk = 3.6 kpc. These are relatively arbitrary values until 21 cm mapping of the HI distribution becomes available. The companion disk was initialized in the computational x-y plane. The primary disk was initialized in the x-y and then tilted around the x-axis such that positive y values had positive z values. After the run the viewing angle was adjusted by rotating the system around the x-axis, around the y-axis, and around the z-axis. The initial position and velocity vectors of the companion relative to the primary center were: (7.0 kpc, 7.0 kpc, 8.0 kpc) and (70 km s-1, 44 km s-1, 24 km s-1).
4.2 Model Results
The dashed lines in the top panels of Figure 14 show that, although the companion collides with the outermost part of the primary gas disk, it then flies a considerable distance radially out from the disk center and below it (assuming it began ‘above’ it, i.e., at positive z coordinate values). The model seems to fit the observed morphology best at a time just before or after the companion again passes through the primary disk. This is in accord with the significant line-of-sight velocity difference between the two galaxies.
The lower panels in the figure show that at earlier times there was a substantial bridge between the two galaxies, and the primary had much more of the two-armed appearance characteristic of prograde encounters. However, by the present time, most of the bridge material has fallen onto one or the other galaxies. What little is left is projected along the line-of-sight, and not very visible. Some bridge gas originating from the companion continues to fall onto the primary. This mass transfer was greater in the past, and could plausibly play a role in feeding the Seyfert nucleus of the primary.
We have run a number of additional exploratory models, and in many of them the companion has a substantial tidal tail. Depending on initial and orbital parameters these tails can have many different orientations. In some cases tail material might account for the debris to the east of the companion and north of the primary. In the present model, however, debris to the east and west of the companion consists mostly of stars pulled off the primary disk (see Figure 14).
In these models the primary arm originates as a tidal counter-tail drawn from primary disk material on the opposite side from the companion’s closest approach point. The bridge arm originates on the companion side near the beginning of the models, and its outer part becomes the bridge as described above. The inner part of the bridge arm is overrun by the primary arm at about the present time in many of the models. The models suggest that the peculiar ‘nob’ on the eastern side of the primary arm is a remnant of the bridge arm. In sum, the models suggest that the one-armed appearance of the primary galaxy is the result of the asymmetric evolution of an essentially two-armed disturbance. This asymmetric evolution is the result of substantial m=0 (ring-like) and m=1 (perturbed center) components of that disturbance.
The new Spitzer observations resolve many star-forming clumps in the primary arm. Interestingly, there seem to be clumps along almost the whole arm, and the star formation is not significantly stronger in the inner arm regions where one might expect the gas density to be greater. Moreover, as described above, there is evidence that clump populations are younger as one tracks the arm outward and around.
The model results in the lower panels of Figure 14 offer some possible explanations for these trends. These show that the arm has narrowed and stretched in the last 400 Myr. The overlaps of test particle rings show that compressions increased greatly on the leading edge of the arm in the west in the first half of this time period. The figure shows that compressions in the outermost parts of the arm develop later. The feedback algorithm in the models shows that star-forming clumps appear rather stochastically at late times in the outer tail, which is consistent with the test particle results convolved with a random element in the way gas densities push over a threshold. We suggest that this may be how clumps #16, 21 and 29 formed. Alternatively, clumps #21, 22, 24 and 26 might be the result of companion debris interacting with the primary disk.
We should emphasize that this relatively straightforward picture of the nature of the star formation in the primary arm is strongly based on the Spitzer infrared colors. The situation would be considerably murkier if we had only H data to compare to the models.
5 Conclusions
We see a strong azimuthal variation of 1.3 magnitudes in the [4.5] [5.8] colors of clumps in the ring/primary arm of Arp 107. These colors are in between those of stars and dust, implying an azimuthal sequence in the ratio of the number of old stars to the number of young stars. In contrast, no variation is seen in the [3.6] [4.5] color, and these colors are consistent with old stars. Thus these two shorter wavelength bands are dominated by an older stellar population. Only a small variation of 0.2 magnitudes is seen in the [5.8] [8.0] color, and these colors are consistent with those of interstellar dust, thus these bands are dominated by interstellar matter. The [5.8] [8.0] color becomes redder in regions with stronger star formation, as indicated by the H and mid-infrared luminosities.
Our numerical model suggests that Arp 107 is the result of a hybrid collision: part small impact parameter/large angle of attack, as in colliding ring galaxies, and part prograde planar encounter, as in M51-type bridge/tail systems. Specifically, the model shows that the strongest compressions occur at different times along the primary arm. Assuming these compressions trigger star formation, this differential delay can account for the observed variation of clump age with azimuth. The Spitzer observations have allowed us to detect this trend, and the model comparison allows us to understand the driving mechanism. This example suggests bright prospects for learning about star formation mechanisms by comparing Spitzer data to models of interacting galaxies.
References
- Allamandola, Tielens, & Barker (1985) Allamandola, L. J., Tielens, A. G. G. M., & Barker, J. R. 1985, ApJ, 290, L25
- Appleton & Struck-Marcell (1987) Appleton, P. N., & Struck-Marcell, C. 1987, ApJ, 312, 382
- Appleton & Struck (1996) Appleton, P. N. & Struck, C. 1996, Fun. Cosmic Phys., 16, 111
- Arp (1966) Arp, H. 1966, Atlas of Peculiar Galaxies (Pasadena: Caltech)
- Bloemen et al. (1986) Bloemen, J. B. G. M., et al. 1986, A&A, 154, 25
- Boselli, Lequeux, & Gavazzi (2004) Boselli, A., Lequeux, J., & Gavazzi, G. 2004, A&A, 428, 409
- Bushouse (1987) Bushouse, H. A. 1987, ApJ, 320, 49
- Bushouse, Lamb, & Werner (1988) Bushouse, H. A., Lamb, S. A., & Werner, M. W. 1988, ApJ, 335, 74
- Charmandaris, Appleton, & Marston (1993) Charmandaris, V., Appleton, P. N., & Marston, A. P. 1993, ApJ, 414, 154
- Fazio et al. (2004) Fazio, G. G., et al. 2004, ApJS, 154, 10
- Förster Schreiber et al. (2004) Förster Schreiber, N. M., Roussel, H., Sauvage, M., & Charmandaris, V. 2004, A&A, 419, 501
- Hatziminaoglou et al. (2005) Hatziminaoglou, E., et al. 2005, AJ, 129, 1198
- Keel (1996) Keel, W. C. 1996, AJ, 111, 696
- Keel et al. (1985) Keel, W. C., Kennicutt, R. C., Jr., Hummel, E., & van der Hulst, J. M. 1985, AJ, 90, 708
- Larson & Tinsley (1976) Larson, R. B. & Tinsley, B. M. 1976, ApJ, 219, 46
- Léger & Puget (1984) Léger, A., & Puget, J. L. 1984, A&A 137, L5
- Li & Draine (2001) Li, A. & Draine, B. T. 2001, ApJ, 554, 778
- Li & Draine (2002) Li, A. & Draine, B. T. 2002, 572, 232
- Lynds & Toomre (1976) Lynds, R., & Toomre, A. 1976, ApJ, 209, 382
- Marston & Appleton (1995) Marston, A. P., & Appleton, P. N. 1995, AJ, 109, 1002
- Peeters, Spoon, & Tielens (2004) Peeters, E., Spoon, H. W. W., & Tielens, A. G. G. M. 2004, ApJ, 613, 986
- Regan et al. (2004) Regan, M. W., et al. 2004, ApJS, 154, 204
- Rieke et al. (2004) Rieke, G. H., et al. 2004, ApJS, 154, 25
- Roussel et al. (2001) Roussel, H., Sauvage, M., Vigroux, L., & Bosma, A. 2001, A&A, 372, 427
- Sanders et al. (1988) Sanders, D. B., Soifer, B. T., Elias, J. H., Madore, B. F., Matthews, K., Neugebauer, G., & Scoville, N. Z. 1988, ApJ, 325, 74
- Schombert, Wallin, & Struck-Marcell (1990) Schombert, J. M., Wallin, J. F., & Struck-Marcell, C. 1990, AJ, 99, 497
- Sellgren et al. (1990) Sellgren, K., Luan, L., & Werner, M. W. 1990, ApJ, 359, 384
- Smith & Wallin (1992) Smith, B. J., & Wallin, J. F. 1992, ApJ, 393, 544
- Smith et al. (1987) Smith, B. J., Kleinmann, S. G., Huchra, J. P., & Low, F. 1987, ApJ, 318, 161
- Soifer et al. (1987) Soifer, B. T., Sanders, D. B., Madore, B. F., Neugebauer, G., Danielson, G. E., Elias, J. H., Lonsdale, C. J., & Rice, W. L. 1987, ApJ, 320, 238
- Struck-Marcell & Appleton (1987) Struck-Marcell, C., & Appleton, P. N. 1987, ApJ, 323, 480
- Struck-Marcell (1990) Struck-Marcell, C. 1990, AJ, 99, 71
- Struck-Marcell & Tinsley (1978) Struck-Marcell, C., & Tinsley, B. M. 1978, ApJ, 221, 562
- Struck (1997) Struck, C. 1997, ApJS, 113, 269
- Struck (1999) Struck, C. 1999, Phys. Rep., 321, 1
- Struck & Smith (2003) Struck, C. & Smith, B. J. 2003, ApJ, 589, 157
- Theys & Spiegel (1977) Theys, J. C., & Spiegel, E. A. 1977, ApJ, 212, 616
- Toomre (1978) Toomre, A. 1978, Proceedings of the I. A. U. Symposium ‘The Large Scale Structure of the Universe’ (Dordrecht: D. Reidel Publishing Co.), 79, 109
- Uchida, Sellgren, & Werner (1998) Uchida, K. I., Sellgren, K., & Werner, M. W. 1998, ApJ, 493, L109
- Uchida et al. (2000) Uchida, K. I., Sellgren, K., Werner, M. W., & Houdashelt, M. L. 2000, ApJ, 530, 817
- Werner et al. (2004) Werner, M. W., et al. 2004, ApJS, 154, 1
- Whitney et al. (2004) Whitney, B. A., et al. 2004, ApJS, 154, 315
- Young et al. (1996) Young, J. S., Allen, L., Kenney, J. D. P., Lesser, A., & Rownd, B. 1996, AJ, 112, 1903
- Zhu et al. (1999) Zhu, M., Seaquist, E. R., Davoust, E., Frayer, O. T., & Bushouse, H. A. 1999, AJ, 118, 145


| ID | R.A. | Dec. | F3.6μm | F4.5μm | F5.8μm | F8.0μm | F24μm | F | ||||
|---|---|---|---|---|---|---|---|---|---|---|---|---|
| (J2000) | (mJy) | (mJy) | (mJy) | (mJy) | (mJy) | (10-15 | ||||||
| erg s-1 cm-2) | ||||||||||||
| 1 | 10 | 52 | 15.8 | 30 | 2 | 42.9 | 0.123 | 0.078 | 0.045 | 0.086 | 0.461 | 1.0 |
| 2 | 10 | 52 | 14.0 | 30 | 2 | 43.5 | 0.079 | 0.056 | 0.057 | 0.140 | 0.044 | 1.0 |
| 3 | 10 | 52 | 17.8 | 30 | 2 | 51.3 | 0.132 | 0.103 | 0.068 | 0.159 | 0.258 | 1.0 |
| 4 | 10 | 52 | 15.4 | 30 | 2 | 56.7 | 0.279 | 0.176 | 0.417 | 1.367 | 0.907 | 1.7 |
| 5 | 10 | 52 | 14.7 | 30 | 2 | 58.1 | 0.237 | 0.159 | 0.375 | 1.268 | 0.979 | 2.7 |
| 6 | 10 | 52 | 15.9 | 30 | 3 | 0.2 | 0.289 | 0.177 | 0.313 | 0.957 | 0.613 | 1.0 |
| 7 | 10 | 52 | 13.6 | 30 | 3 | 2.6 | 0.207 | 0.128 | 0.350 | 1.001 | 0.584 | 2.6 |
| 8 | 10 | 52 | 17.0 | 30 | 3 | 11.7 | 0.155 | 0.095 | 0.119 | 0.548 | 0.227 | 1.0 |
| 9 | 10 | 52 | 14.1 | 30 | 3 | 12.7 | 1.685 | 1.079 | 0.732 | 0.336 | 0.075 | 1.0 |
| 10 | 10 | 52 | 12.8 | 30 | 3 | 17.3 | 0.180 | 0.127 | 0.458 | 1.478 | 1.733 | 12.8 |
| 11 | 10 | 52 | 16.3 | 30 | 3 | 18.3 | 0.057 | 0.027 | 0.027 | 0.111 | 0.114 | 1.0 |
| 12 | 10 | 52 | 18.6 | 30 | 3 | 21.2 | 0.306 | 0.209 | 0.162 | 0.177 | 0.546 | 1.0 |
| 13 | 10 | 52 | 14.0 | 30 | 3 | 26.7 | 0.105 | 0.061 | 0.088 | 0.202 | 1.824 | 1.0 |
| 14 | 10 | 52 | 15.0 | 30 | 3 | 28.4 | 2.793 | 1.848 | 2.003 | 4.250 | 36.603 | 1.0 |
| 15 | 10 | 52 | 17.2 | 30 | 3 | 29.0 | 0.146 | 0.083 | 0.174 | 0.528 | 0.584 | 1.0 |
| 16 | 10 | 52 | 12.6 | 30 | 3 | 32.3 | 0.042 | 0.026 | 0.059 | 0.269 | 0.486 | 3.6 |
| 17 | 10 | 52 | 16.9 | 30 | 3 | 37.7 | 0.157 | 0.088 | 0.125 | 0.406 | 0.679 | 1.0 |
| 18 | 10 | 52 | 13.6 | 30 | 3 | 39.0 | 0.005 | 0.001 | 0.005 | 0.053 | 0.258 | 1.0 |
| 19 | 10 | 52 | 10.9 | 30 | 3 | 45.1 | 0.038 | 0.039 | 0.067 | 0.112 | 0.100 | 1.0 |
| 20 | 10 | 52 | 16.2 | 30 | 3 | 47.1 | 0.071 | 0.040 | 0.006 | 0.064 | 0.290 | 1.0 |
| 21 | 10 | 52 | 12.8 | 30 | 3 | 49.1 | 0.130 | 0.081 | 0.348 | 1.298 | 1.087 | 5.8 |
| 22 | 10 | 52 | 15.7 | 30 | 3 | 54.3 | 0.060 | 0.042 | 0.015 | 0.195 | 0.446 | 1.0 |
| 23 | 10 | 52 | 9.9 | 30 | 3 | 56.8 | 0.147 | 0.205 | 0.256 | 0.361 | 1.219 | 1.0 |
| 24 | 10 | 52 | 15.8 | 30 | 4 | 1.1 | 0.054 | 0.038 | 0.061 | 0.224 | 0.443 | 1.0 |
| 25 | 10 | 52 | 11.3 | 30 | 4 | 1.5 | 0.133 | 0.092 | 0.005 | 0.037 | 0.041 | 1.0 |
| 26 | 10 | 52 | 14.7 | 30 | 4 | 5.3 | 0.188 | 0.116 | 0.517 | 1.913 | 1.760 | 8.7 |
| 27 | 10 | 52 | 17.6 | 30 | 4 | 8.1 | 0.116 | 0.097 | 0.093 | 0.141 | 0.159 | 1.0 |
| 28 | 10 | 52 | 18.5 | 30 | 4 | 20.9 | 5.457 | 3.145 | 2.326 | 1.530 | 0.546 | 1.0 |
| 29 | 10 | 52 | 12.6 | 30 | 4 | 21.3 | 0.072 | 0.042 | 0.039 | 0.190 | 0.122 | 1.0 |