Lithium and Lithium Depletion
in Halo Stars on Extreme Orbits
Abstract
We have determined Li abundances in 55 dwarfs and subgiants that are metal-poor (3.6 [Fe/H] 0.7) and have extreme orbital kinematics. Our purpose is to examine the Li abundance in the Li-plateau stars and its decrease in low-temperature, low-mass stars. For the stars in our sample we have determined chemical profiles in Stephens & Boesgaard (2002). The Li observations are primarily from the echelle spectrograph on the 10 m Keck I telescope with HIRES covering 4700 - 6800 Å with a spectral resolution of 48,000. The spectra have high signal-to-noise per pixel from 70 to 700, with a median of 140. The Li I resonance doublet was detected in 42 of the 55 stars. Temperatures were found spectroscopically by Stephens & Boesgaard (2002). Abundances or upper limits were determined for all stars with typical errors of 0.06 dex. Corrections for the deviations from non-local thermodynamical equilibrium for Li in the stellar atmospheres have been made which range from 0.04 to +0.11 dex. Our 14 dwarf and turn-off stars on the Li plateau with temperatures greater than 5700 K and [Fe/H] 1.5 give A(Li) = log N(Li)/N(H) + 12.00 of 2.215 0.110, consistent with earlier results. We find a dependence of the Li abundance on metallicity as measured by [Fe/H] and the Fe-peak elements Cr and Ni, with a slope of 0.18. We have examined the possible trends of A(Li) with the chemical abundances of other elements and find similar dependences of A(Li) with the alpha elements, Mg, Ca, and Ti. These slopes are slightly steeper at 0.20, resulting from an excess in [/Fe] with decreasing [Fe/H]. For the n-capture, rare-earth element, Ba, we find a relation between A(Li) and [Ba/H] which has a shallower slope of 0.13; over a range of 2.6 dex in [Ba/H], the Li abundance spans only a factor of two. We have also examined the possible trends of A(Li) with the characteristics of the orbits of our halo stars. We find no trends in A(Li) with kinematic or dynamic properties. For the stars with temperatures below the Li plateau there are several interesting results. The group of metal-poor stars possess, on average, more Li at a given temperature than metal-rich stars. When we divide the cool stars into smaller subsets with similar metallicities, we find trends of A(Li) with temperature for the different metallicity groups. The decrease in A(Li) sets in at hotter temperatures for the higher metallicity stars than for the lower metallicity stars. The increased Li depletion in cooler stars could be a result of the increased action of convection since cooler stars have deeper convection zones. This would also make it easier for additional mixing mechanisms, such as those induced by rotation, to have a greater effect in cooler stars. Since the model depth of the convection zone is almost independent of metallicity at a given effective temperature, the apparent metallicity-dependence of the Li depletion in our data may be pointing to subtle but poorly understood mixing effects in low mass halo dwarfs. Predictions for Li depletion from standard and non-standard models seem to underestimate the degree of depletion inferred from the observations of the cool stars.
1 Introduction
The study of Li in metal-poor stars has produced a cascade of papers after the initial studies by the Spites (Spite & Spite 1982; Spite, Maillard & Spite 1984). Most of the papers have been concerned primarily with the determination of the value the amount of Li produced during the Big Bang. Some recent examples include Ryan et al. (1996); Bonifacio & Molaro (1997); Ryan & Deliyannis (1998); Ryan et al. (1999); Ryan et al. (2000); Ryan (2002); Zhang & Zhao (2003); Meléndez & Ramírez (2004). This primordial Li, called A(Lip), where A(Li) = log N(Li)/N(H) +12.00, is of importance in our understanding of the conditions during the Big Bang and subsequently. Recently Coc et al. (2004) have compared the predictions from the Wilkinson Microwave Anisotropy Probe, (WMAP; Spergel et al. 2003) with the observations of A(Lip) from Ryan et al. (2000) (and Ryan, Norris & Beers 1999) which reveal a significant discrepancy. Coc et al. (2004) find WMAP+SBBN (standard Big Bang nucleosynthesis) produces a value for A(Lip) of 2.62 0.05 compared to the observed value of 2.0 - 2.2. Meléndez and Ramírez (2004) suggest a marginal consistency with the observed A(Lip) of 2.37 through their use of a hotter temperature scale.
The 55 stars selected for this Li project are all metal-poor (3.6 [Fe/H] 0.7) dwarfs and subgiants with extreme orbital characteristics. The orbits have one or more of these criteria: extreme retrograde velocities, from the outer Galactic halo, high altitudes above the Galactic plane. In addition there are a few stars with intermediate characteristics for comparison. The stars are presently in the solar neighborhood, but they are transients from remote parts of the Galaxy.
This research is motivated by several new aspects of Li in metal-poor stars. 1) Our sample includes a large subset of cool stars so we can investigate the decline in Li in low-temperature, low-mass stars. 2) Because our selection of stars are halo stars with extreme orbits, we can examine if there are different Li abundances related to orbital dynamics. 3) Abundances of ten elements have been determined so we have a sample with an unusually complete chemical profile, including -fusion products, Fe-peak elements, and neutron-capture elements (Stephens & Boesgaard 2002, hereafter SB02); thus we can look for trends of elemental abundances with Li. 4) Some of the abundance findings in SB02 can be attributed to chemical-enrichment products from SNII so we can check if there is any Li-enrichment from the -process (Timmes et al. 1995).
2 Observations and Data Analysis
The spectra for this research were obtained primarily from the W. M. Keck 10 m telescope with the high-resolution spectrometer, HIRES (Vogt et al. 1994) and have a spectral resolution of 48,000 and a wavelength coverage of 4500 - 6800 Å. Three of the stars were observed with the KPNO Mayall 4 m telescope and the echelle spectrometer, ECH (Pilachowski & Willmarth 1981) with a resolution of 35,000. The observations were made at high ratios of signal-to-noise pixel-1 (S/N): between 70 and 700 in the order containing the Li I resonance line at 6707. The median S/N is 140 and 67% of the stars have S/N between 100 and 200 with another 20% above 200. The details of the observations and data reduction procedures can be found in SB02.
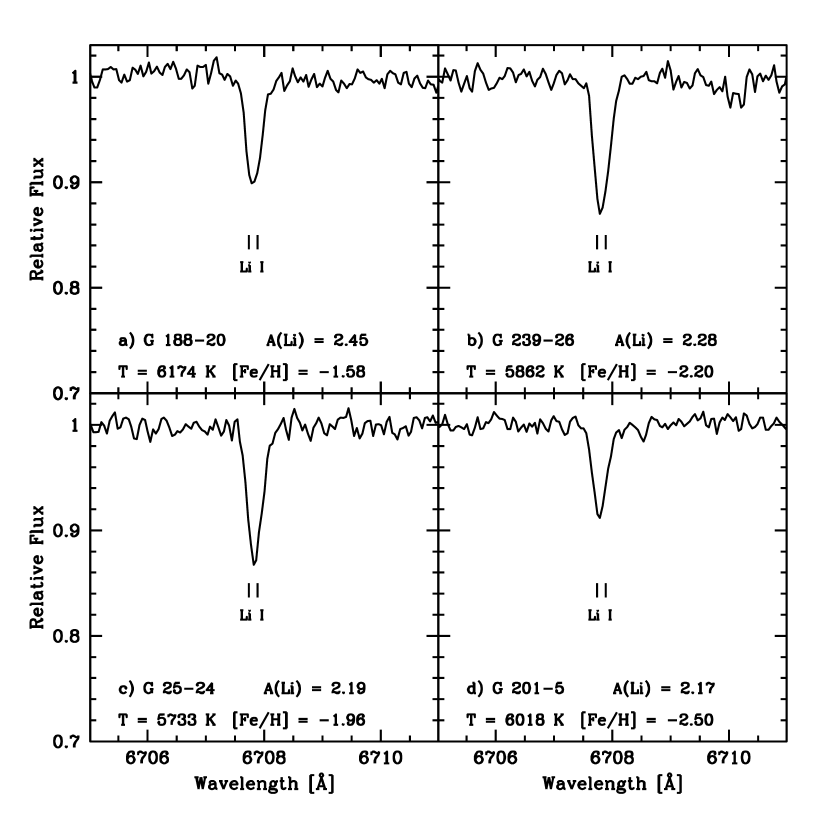
Examples of some of the spectra in the Li region are shown in Figure 1. These spectra are of stars that are hotter than 5700 K, i.e. stars on the Li plateau. The stars shown have a range in metallicity of an order of magnitude; the spectra shown are of stars from the outer halo and/or from high in the halo (see figure caption).
3 Abundances
The spectrum of each program star was examined for Li I resonance line. The 6707 Å blend was confidently detected in 42 of the 55 stars while upper limits were calculated for the remaining 13. The Cayrel (1988) formula (as recast in Deliyannis et al. 1993) was used to calculate upper limits given the S/N in the Li order of the spectrum. The Li equivalent widths were measured in IRAF routine splot assuming a gaussian profile. Table 1 lists each star, the S/N in the Li order, the model parameters used, the measured Li equivalent width or the 3 upper limit along with the measurement error, the calculated Li abundance or upper limit, A(Li), the NLTE abundance, A(Li)NLTE (see below), and the 1 error in A(Li).
The grid of Kurucz model atmospheres was used to produce interpolated models with the stellar parameters in Table 1. These parameters are those derived in SB02. Temperatures were determined spectroscopically from some 30-40 weak Fe I lines of a range of excitation potentials. Gravities were found by forcing neutral and ionized lines of both Fe and Ti to give the same elemental abundances. In SB02 our temperatures were compared with those of Carney et al. (1994) and Alonso et al. (1996) and found fairly good agreement. The stars with the largest differences were those with 0.05, but the spectroscopic temperatures are not affected by large and uncertain reddening corrections as are the photometric temperatures. There is a slight systematic trend with the Carney et al. (1994) temperatures such that our temperatures are higher by 100 K at 5000 K, by 50 K at 5500 K, but in excellent agreement at 6000 K. In the comparison with Alonso et al. (1996) the trends with temperature are such that our temperatures are hotter by 40 K at 5000 K, in excellent agreement at 5500 K and 50 K cooler at 6000 K. These differences seem minor as none of the scales is more accurate than 100 K. We have made comparisons with other temperature determinations by Fulbright (2000), Bonifacio & Molaro (1997), Ryan et al. (1999), and Akerman et al. (2004) for the handful of stars in common with each of those samples. The various methods and calibrations used by different researchers show a spread in derived temperatures of as much as 100 - 200 K. We proceed here with our spectroscopically derived temperatures because they have been done consistently and are insensitive to reddening. Only weak Fe I lines, log Wλ/ less than 5.15 (or Wλ 40 mÅ near 5600 Å), were used to derive so the same set of Fe I lines could not be used in the metal-poor stars as in the metal-rich stars. However, the line sets had many lines in common going along the metallicity ladder. The total number of Fe I lines in the line set was 133.
Abundances were determined from the Li equivalent widths through use of MOOG (Sneden 1973, http://verdi.as.utexas.edu/moog.html). The Li abundances are quite insensitive to uncertainties in the derived values of log g, [Fe/H], and microturbulent velocity, . The effect of decreasing log g by 0.5 dex is at most a decrease of 0.01 in A(Li), but the uncertainty in log g averages 0.33 0.07 dex (not as much as 0.5 dex). A decrease in [Fe/H] of 0.5 is at most a decrease of 0.01 dex in A(Li), while the uncertainties in [Fe/H] are typically much smaller at 0.06. There is no change in A(Li) when is changed by 0.2 km s-1. The uncertainty in is a more important contributor where an increase of 100 K produces an increase in A(Li) of 0.07-0.10 dex. The uncertainties in are listed in Table 5 of SB02 and these were used to find the error in A(Li) for each star. One other contributor to the error is the measurement uncertainty in the Li equivalent width. As shown in SB02 for spectra with S/N 150 this error is 1 mÅ. A conservative error of 2 mÅ gives an error of 0.025 in A(Li). The errors on A(Li) listed in Table 1 are the square root of the quadrature sum of the uncertainties in A(Li) due to temperature and equivalent width measurement uncertainties, and they are typically 0.06 dex.
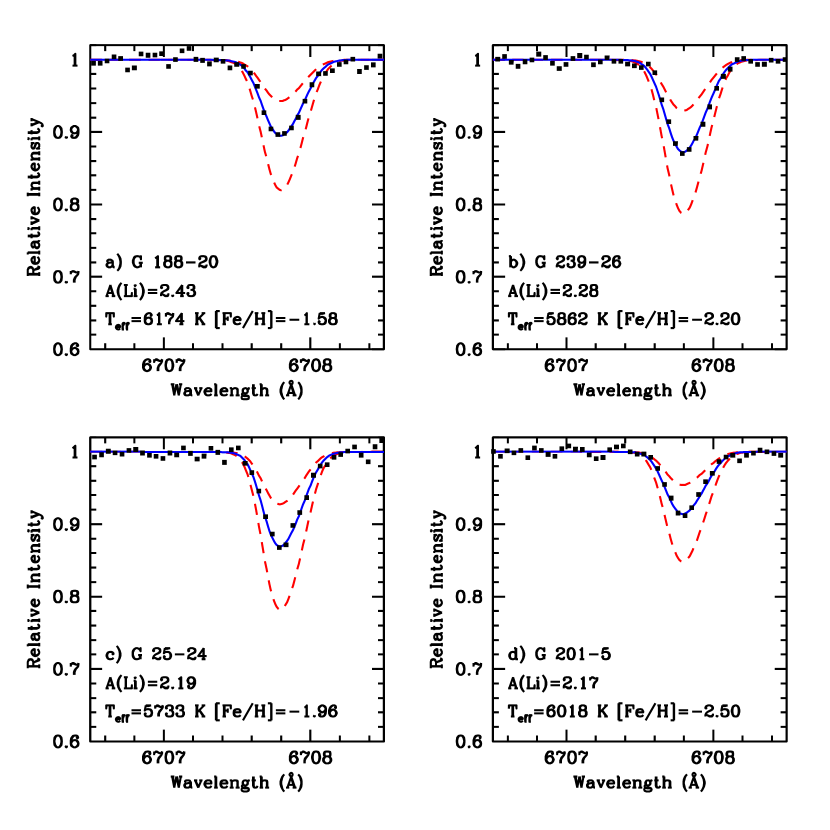
For a subset of eight stars we have determined A(Li) from spectrum synthesis with MOOG. For seven of the stars the agreement is perfect. For G 188-20 the synthesis value of A(Li) is 0.02 dex lower than the equivalent width result; this is certainly within the errors of the determination for this star of 0.05 dex. The synthesis for the four stars in Figure 1 is shown in Figure 2.
According to the work of Carlsson et al. (1994), there can be sizable corrections to the Li abundances due to the effects of non-local thermodynamic equilibrium (NLTE). We have used the routines supplied by them to determine the NLTE Li abundances given the LTE Li abundance, and the values of , log g, and [Fe/H]. The corrections range from 0.04 to +0.11 with the negative corrections are for the hotter stars while the larger positive corrections apply to the cooler stars. For some of our stars one or more of the four input values were out of the range of their calculations. In some cases we used log g = 4.5 when our value marginally exceeded that or [Fe/H] = 3.0 for the three stars which were lower that that value. In two cases with low, but detected Li we extrapolated below the A(Li) = 0.6 limit in their calculations. The NLTE Li abundances are included in Table 1 where the values for the stars with parameters beyond the calculation limits have a “:” after the number to show that they are uncertain. Most of the NLTE corrections increase the LTE values by 0.01 to 0.11 dex (32 stars) while for six stars they decrease the LTE values and for eight stars there is no change. The largest (positive) changes are for the cooler stars (5100 - 5200 K) with intermediate metallicities ([Fe/H] = 1.34 to 1.90). The small negative corrections are for the hotter stars (6100 - 6300 K).
4 Results and Discussions
4.1 General Abundance Results
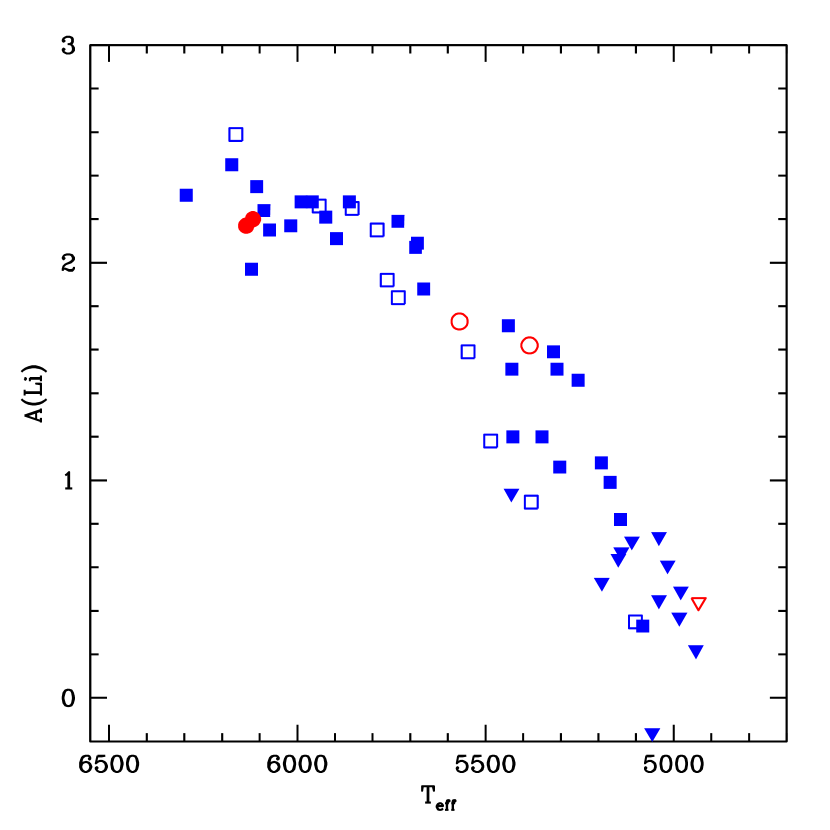
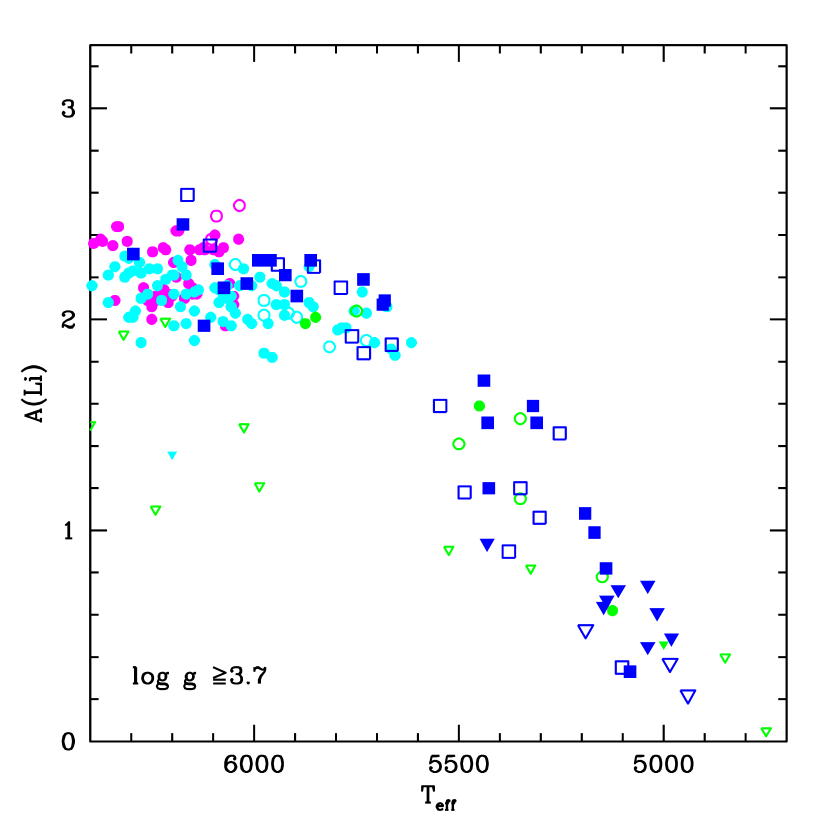
Figure 3 shows the overall distribution of A(Li) in our star sample as a function of temperature. The hot stars in the sample are on the Li plateau while the cooler star portion below 5700 K is heavily populated. Solid squares and triangles represent metal-poor ([Fe/H] 1.5) stars with Li detections and upper limits, respectively. Open squares represent the metal-rich star Li detections. This [Fe/H] dividing line isolates true metal-poor halo stars, i.e. those likely to possess a primordial Li abundance, from stars whose surface abundance may be more affected by Galactic chemical enrichment. A further division was made in log g; the open circles have log g 3.7, potentially subgiants. This distinction is interesting when discussing Li as the deepening convection zone of stars evolving off the main sequence can penetrate to depths where Li is absent, resulting in the dilution of the surface Li abundance. Hence subgiant abundances may not represent an unadulterated initial Li abundance. Only five of our stars could be considered to be subgiants, and three of those have temperatures below 5700 K.
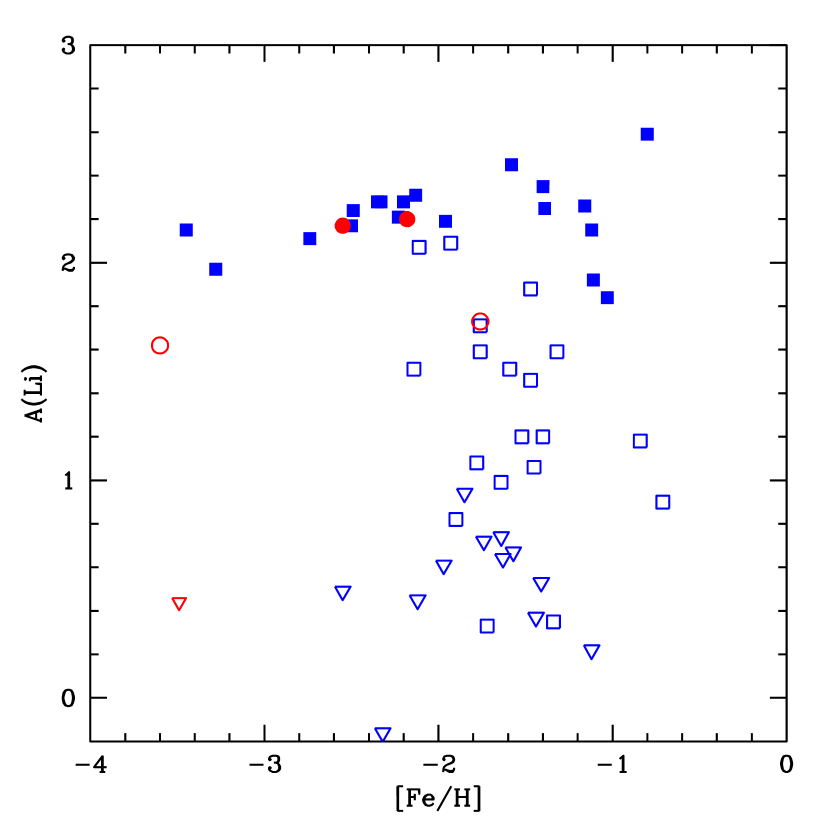
The distribution of A(Li) with [Fe/H] is shown in Figure 4. The stars plotted as solid squares are the ones hotter than 5700 K with log g 3.7 and the open squares are the cooler stars. The circles refer to stars with log g 3.7. The two most metal-poor stars in the sample are cool subgiants: G 82-23 and G 238-30. The star with the highest A(Li) is “metal-rich” at [Fe/H] = 0.80 (G 121-12). Stars that are Li-deficient are the cooler ones, and occur at a range of metallicity. The stars with upper limits (triangles) occur at all metallicities, but only for the cooler stars. We have not discovered any additional ultra-Li deficient stars (at Li plateau temperatures) in this sample. Figure 5 puts our results into a larger context of Li abundances in dwarfs. The literature data are from Norris et al. (1997), the compilation of Ryan et al. (1996), Ryan & Deliyannis (1998), Ryan et al. (1999) and Meléndez & Ramírez (2004).
There are 12 Li plateau stars with [Fe/H] 1.5, Teff 5700 K and log g 3.7. These stars have a mean A(Li) = 2.22 0.12 similar to traditional Li plateau abundances of 2.2 dex, e.g. Bonifaco & Molaro (1997). Other work has also focussed on the plateau stars. The Ryan et al. (1999) study concentrated on the hottest and most metal-deficient halo dwarfs, finding a very thin plateau and a low A(Lip) of 2.0. The estimate of primordial Li by Ryan (2002) is 2.09 0.16. Zhang & Zhao (2003) find the Li plateau from 21 stars to be A(Li) = 2.33 and correct for a metallicity dependence to derive A(Lip) 2.08. The recent reevaluation of Li observations with revised temperatures (IRFM) by Meléndez & Ramírez (2004) yields A(Lip) = 2.37, with an uncertainty in the absolute abundance scale of 0.1. Recently, Novicki (2005) has found both a metallicity and a temperature dependence in the Li plateau from 116 stars; after corrections for Li depletion and galactic chemical evolution, she finds A(Lip) = 2.44 0.18.
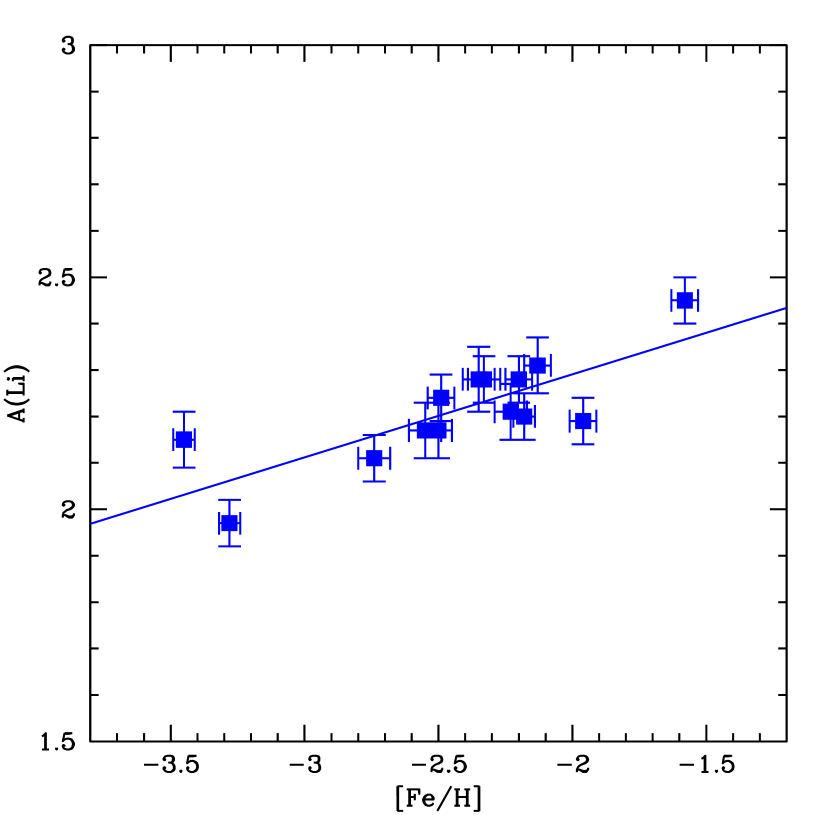
We add two stars to our sample of 12 Li plateau stars which have log g = 3.54 and 3.53; these are the two stars with solid circles in Figures 3 and 4 and have Li plateau abundances (G 88-32 and G165-39). The mean for A(Li) for these 14 stars is 2.215 0.110. As can be seen in Figure 4 there is a trend of A(Li) with metallicity. The least squares fit of this trend seen in Figure 6a is
A(Li) = 0.179 (0.040) [Fe/H] + 2.649 (0.099)
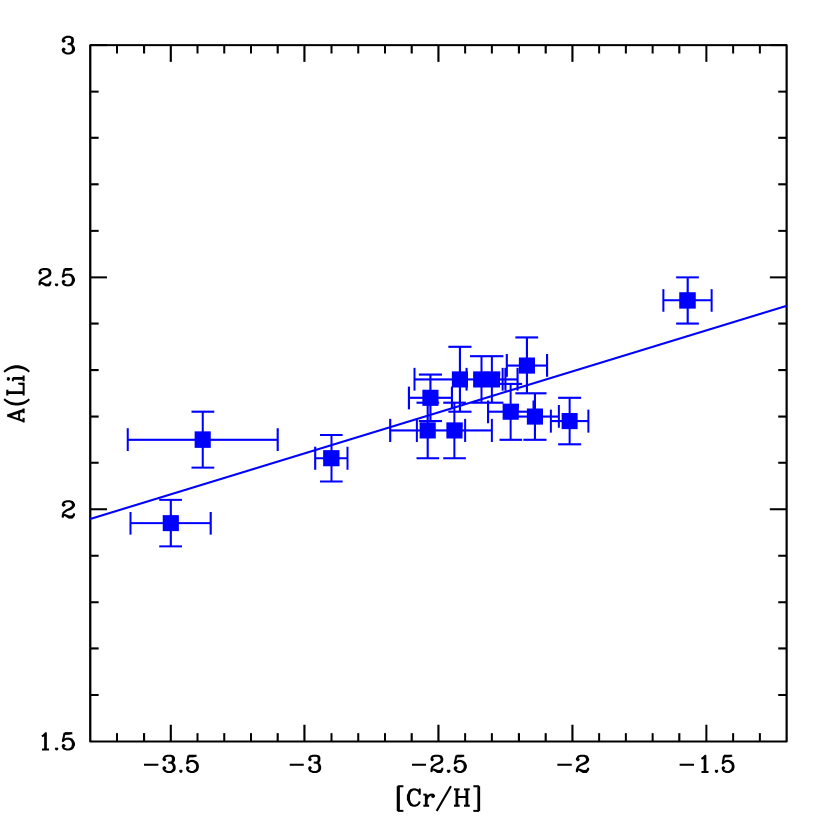
Although the sample size is small, this does agree with other detections of a metallicity dependence (e.g. Ryan et al. 1999, Spite et al. 2000, Novicki 2005). Figure 6b shows the trend of Li with another Fe-peak element, [Cr/H]; the [Cr/H] values are also from SB02. For [Cr/H] the slope of the relationship is 0.177 0.036, in excellent agreement with the slope between [Fe/H] and A(Li). A similar relationship is found for the other Fe-peak element, [Ni/H]; that slope is a little shallower at 0.147 0.040, but the same within the errors. Such trends could indicate that some chemical evolution of Li has taken place even in these stars on extreme orbits. On the other hand, the lower Li in the lowest metallicity stars could result from greater Li depletion in stars with lower quantities of the Fe-peak elements. This could be expected if the stars with the lowest Fe are the oldest stars, which would have had more time to deplete their original Li. We do not find a believable trend with temperature in this sample, i.e. the slope per 100 K is 0.0121 0.0215.
Our subgiant abundance data do not deviate from the data collected by Pilachowski et al. (1993) and Ryan & Deliyannis (1995). The three more evolved subgiants (cooler temperatures) follow the typical pattern of decreased Li with decreasing temperature, a trend attributed (in part) to main sequence Li burning and subgiant Li dilution (Pilachowski et al. 1993). The two hotter stars with higher log g, G 88-32 and G 165-39, show the plateau Li abundances (as mentioned above) of 2.17 and 2.20.
4.2 Trends with Composition and Kinematics
We have made a sub-sample of metal-poor stars ([Fe/H] 1.5) with 5700 K to examine the potential trends with orbital characteristics from SB02. This subset contains only 14 stars and shows values for A(Li) ranging from 1.97 to 2.45. We have investigated trends with orbital parameters for this subset. The stars with large values (20-45 kpc) of (the distance at apogalacticon) have the same mean value of A(Li) as those of with of 8-12 kpc. The orbital energy, , is similar for the five stars with the highest A(Li) and those with lower A(Li). This subset has a mean A(Li) = 2.22 0.11. Eight of those 14 stars are from the outer halo and show essentially the same A(Li): 2.25 0.10. Four stars are from the high halo and have A(Li) = 2.18 0.07, similar to the total sample of 14 stars. The small difference between outer halo stars and high halo stars is not significant, nor are either different from the halo samples of other research on halo stars on “normal” orbits. That we have found no important differences is not surprising given the primordial origin of Li.
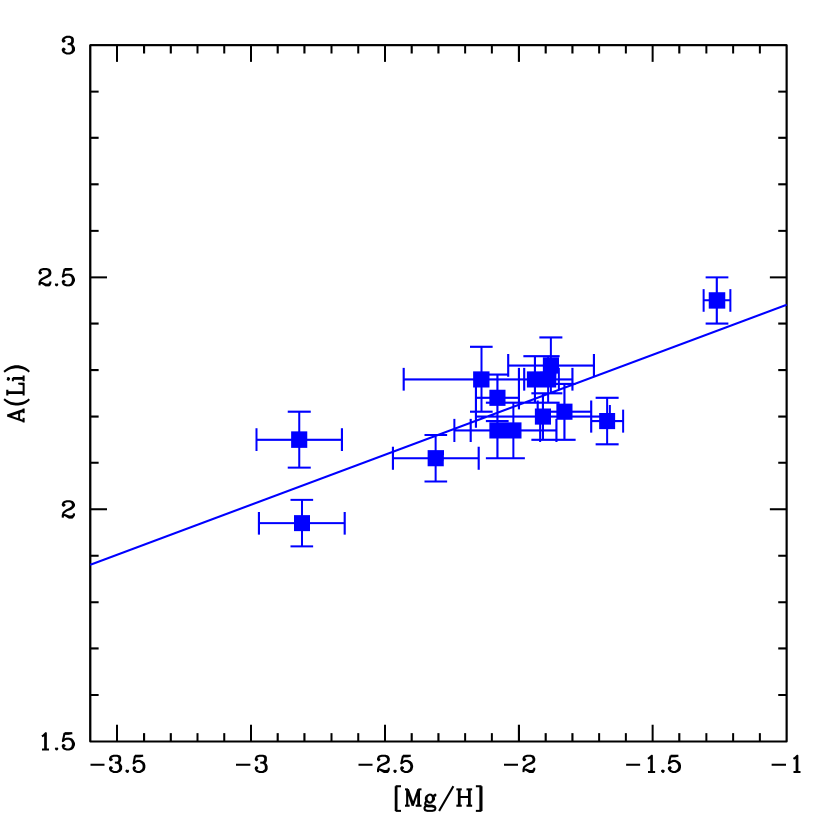
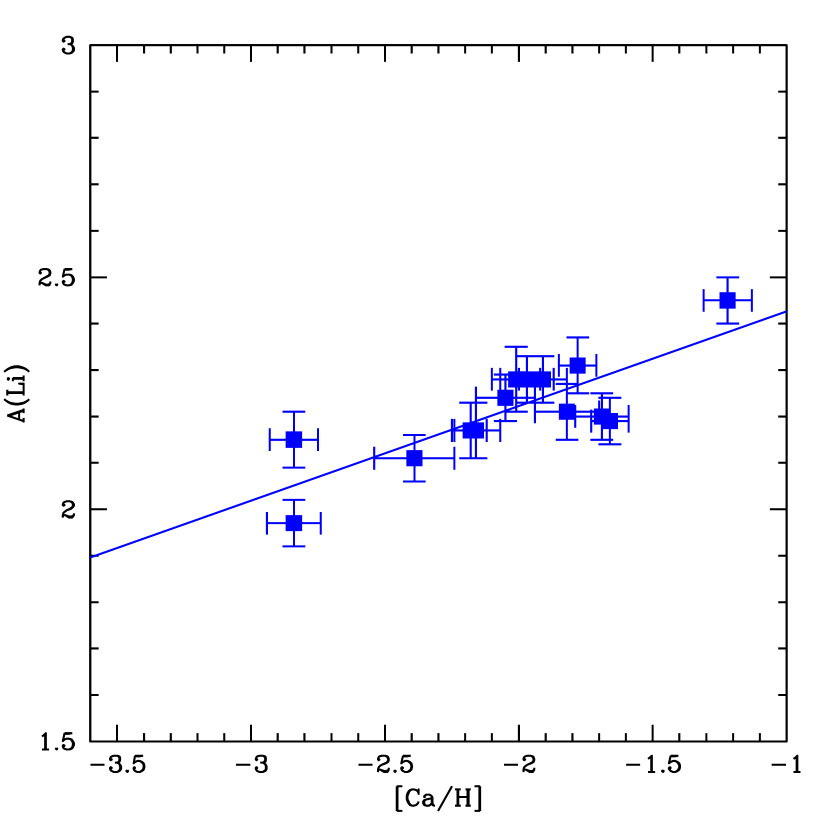
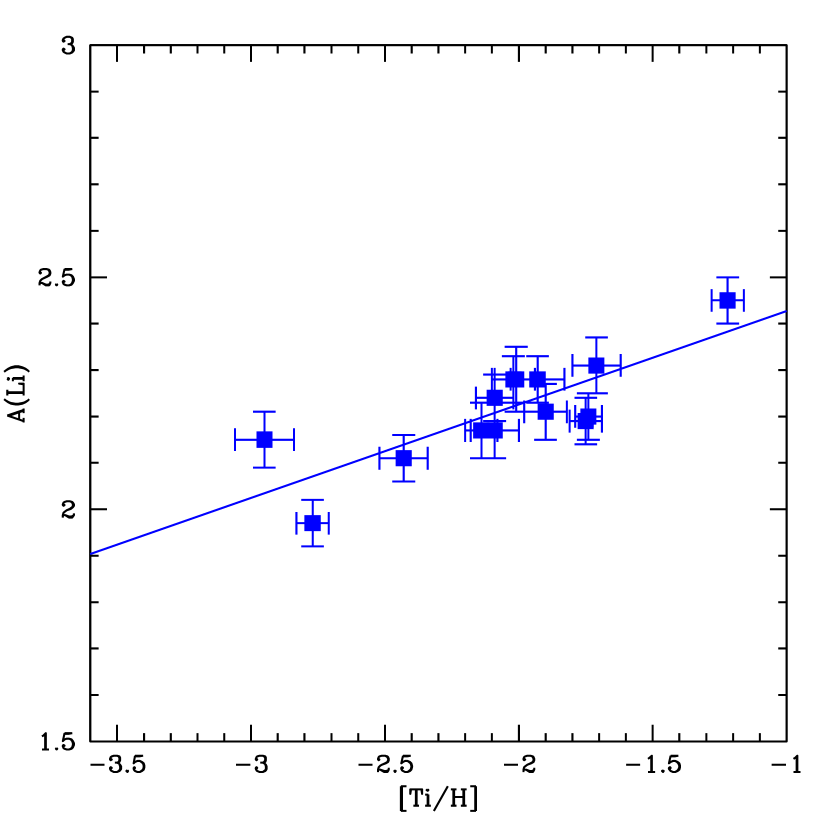
Table 2 lists the stars in the plateau subset of 14 stars along with their parameters and the abundances and errors of several elements. This group is the true halo plateau sample with Teff 5700 K, log g 3.5 and [Fe/H] 1.5. The values of [Mg/H], [Ca/H] and [Ti/H] were used as indicators of alpha-element enrichment. (Only 2 of the 14 stars have measurements of the other alpha-element, Si.) The abundance of Li increases in these stars with all three of the -element ratios: [Mg/H], [Ca/H] and [Ti/H]. Figure 7a and 7b show the increase with Mg and Ca and Figure 8a shows the increase with Ti. The slopes of these three relationships are remarkably similar at 0.216 0.047 for Mg, 0.202 0.042 for Ca, and 0.201 0.043 for Ti. These slopes are higher than those of the three Fe-peak elements as would be expected because of the super-solar values of [/Fe] in old, metal-poor stars and the increasing rise to higher [/Fe] with decreasing [Fe/H] as found in SB02.
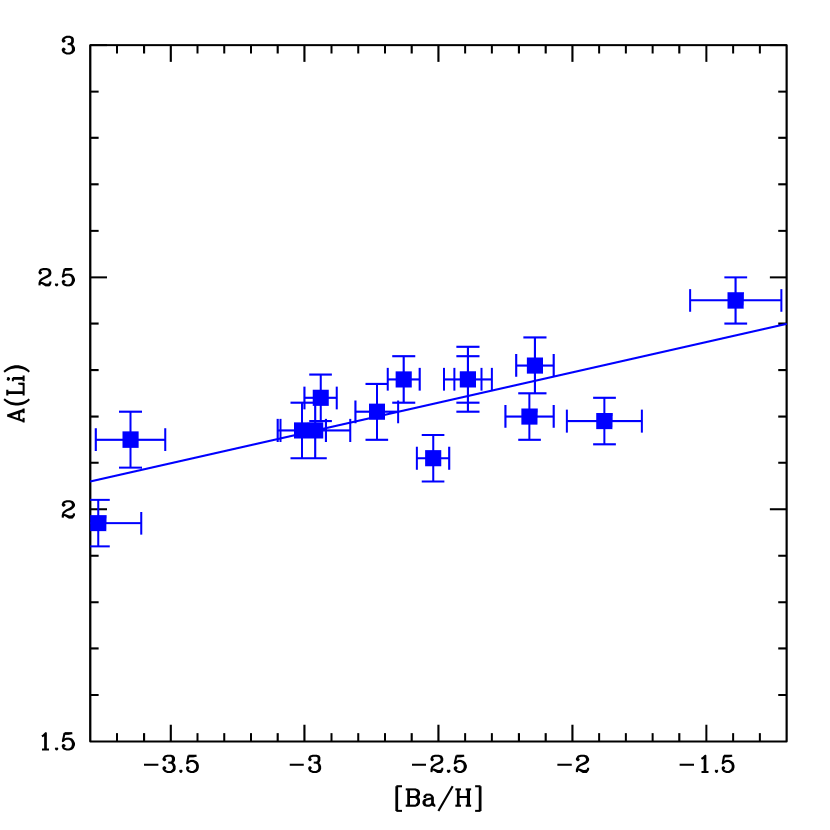
In addition we looked for trends of A(Li) with the neutron-capture elements. Although Y was only measurable in four of the 14 stars, we have abundances of Ba in all of them. This trend is shown in Figure 8b. In the case of [Ba/H] the slope is small: 0.130 0.032. The material that formed these halo stars was apparently not exposed to as much enrichment of s-process products as to the -process products. The increase in A(Li) is only a factor of about 2 over the span of 2.6 dex in [Ba/H].
It is interesting to observe how much chemical enrichment has occurred in these halo stars and how the apparent Li enrichment has kept pace. Quite different mechanisms are involved as Li is produced by spallation and the others by stellar nucleosynthesis. However, we see no particular evidence that there is any Li over-enrichment in these stars that could be attributed to the -process. Furthermore, the possibility remains that we are not seeing evidence of Li enrichment by spallation, but rather evidence of Li depletion which is larger in the lower metallicity (older?) halo stars.
4.3 Cool Metal-Poor Stars
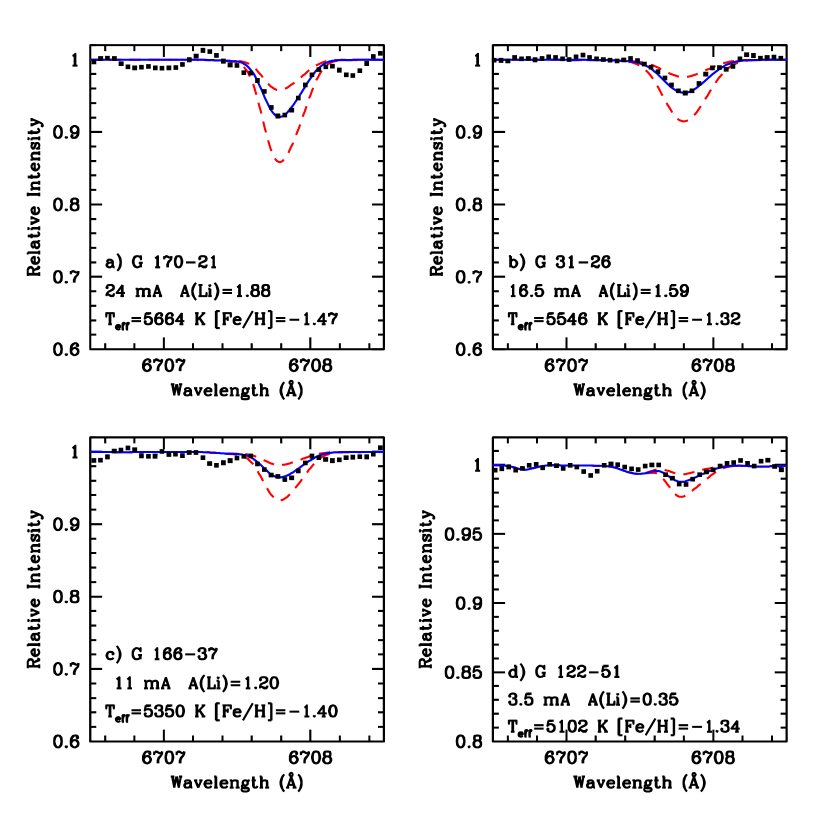
The data on the non-plateau stars exhibit some interesting new trends. This dataset is unique in that it contains a large number of metal-poor stars with effective temperatures cooler ( 5700 K) than the Li plateau. Figure 9 shows examples of the spectrum synthesis of Li in four stars with similar metallicities in which the Li line strength and A(Li) decline with decreasing temperature. The best synthesis fits are shown along with syntheses which are a factor of two more and two less Li.
It is clear from Figure 3 that the cool, metal-poor stars (solid squares) possess, on average, more Li than stars with similar temperatures and larger metallicities (open squares). The metal-richer stars appear to fall along a “lower envelope” while the metal-poorest stars appear to define an “upper-envelope” to the Li depletion curve over the entire range of temperatures cooler than the plateau. This result agrees with similar findings based on much less data (Deliyannis, Pinsonneault, & Duncan 1993; Ryan & Deliyannis 1995; and Ryan & Deliyannis 1998).
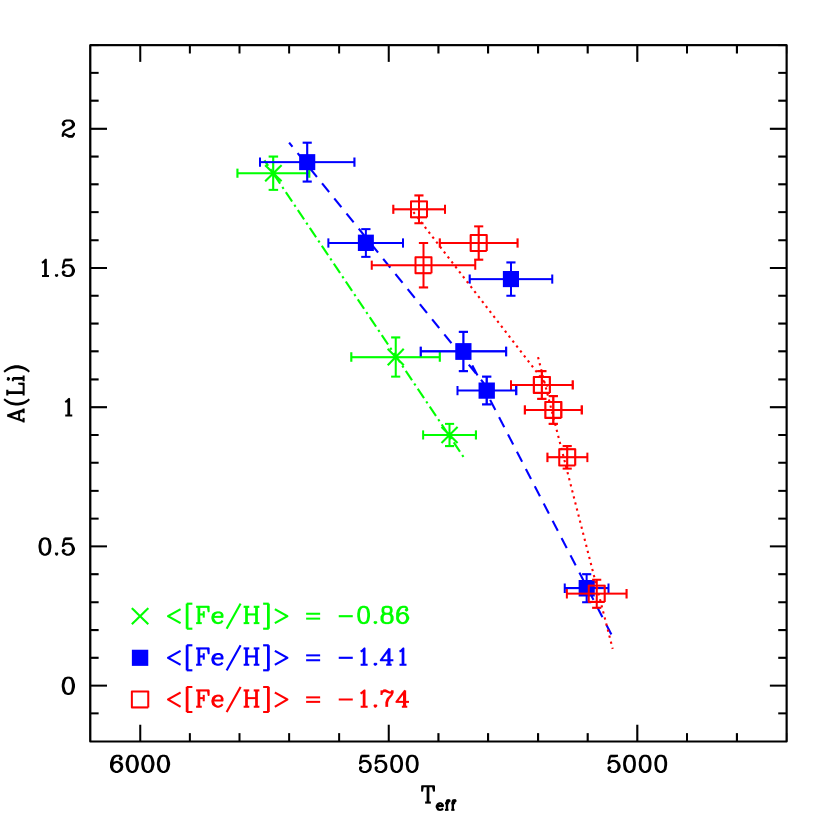
In order to examine the trends of Li depletion with metallicity in the cool stars in more detail, we divide the stars into different metallicity sub-groups. We have excluded stars with log g 3.7, stars hotter than 5800 K, and those with only upper limits on A(Li). The resulting sample of 22 stars has been subdivided into three metallicity groups: [Fe/H] = 0.70 to 1.03; 1.24 to 1.47; and 1.58 to 1.90. (Of the remaining six stars, three fall between these groups. One star, G 97-40, was not plotted because at [Fe/H] = 1.52 it is intermediate between our metallicity groupings, but at [5427,1.20] it is in reasonable accord with the [Fe/H] = 1.24 to 1.47 group. Three have lower metallicity and could fit with our lowest metallicity group, but that would extend the range in that group to [Fe/H] to 2.14.) The stars in the three groups are listed in Table 3. All have log g 4.14.
The trends with metallicity become even more apparent in Figures 10 and 11. The decline in A(Li) with temperature is similar in the three groups, but it is offset toward cooler temperatures for the lower metallicity groups. The lines shown in Figure 10 are the least squares fits through the points with two such fits for the two lower metallicity groups. (The outlier, G189-050, at [5254,1.46] was excluded from the fit. The most likely source of error is the value of [Fe/H]; if this were lower by 0.1 dex it would be included in the lower metallicity grouping, where it lies in Figure 10.) The change in the slopes occurs near A(Li) 1.1. The slopes for the upper parts are 2.66 (0.02) 10-5, 2.21 (0.08) 10-5, and 2.06 (0.84) 10-5 for [Fe/H] = 0.86, 1.41, and 1.74, respectively. These are very similar slopes, but the same Li depletion occurs at cooler temperatures for the l͡ower metallicity stars. At a given temperature, e.g. 5400 K, there is more than 4 times as much Li depletion in the more metal-rich stars. The slopes steepen for the cooler, more metal-poor stars.
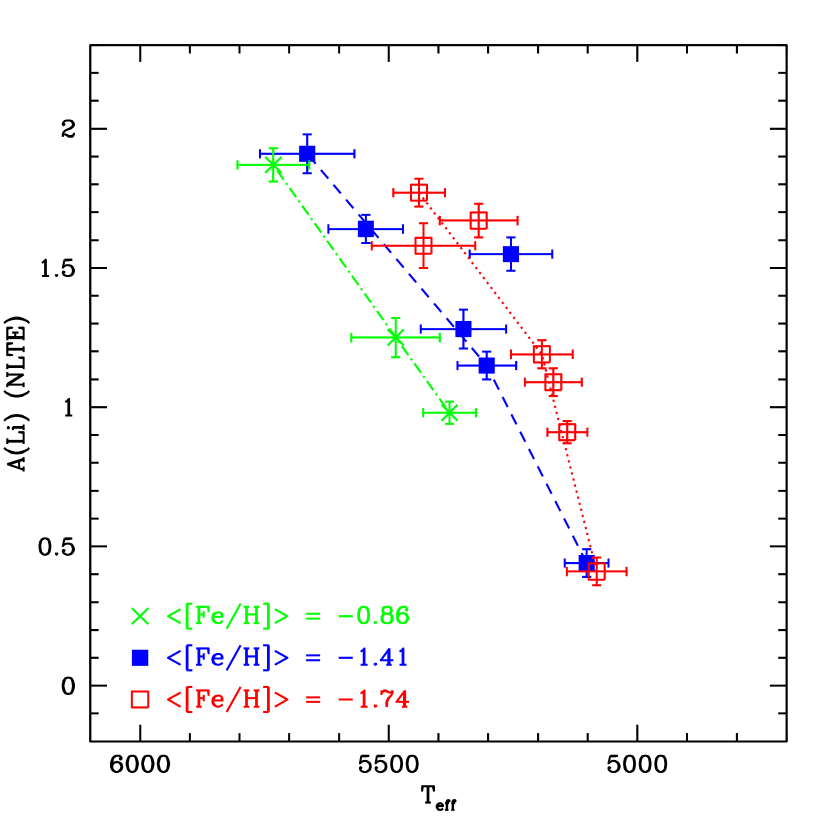
Figure 11 shows the same type of plot, but it is for the NLTE A(Li) values. (The lines shown in Figure 11 are not “fits” to the data, but rather eyeball connect-the-dots lines.) In that diagram the Li abundances are systematically higher resulting in an apparent shift toward the right for the connect-the-dots lines.
Although the error bars are shown for both Teff and A(Li) in the figures, the question arises about systematic differences in temperature scales. Of the 16 stars in Table 3 there are 5 in common with the Alonso et al. (1996) temperature determinations. Within the errors the temperatures for four of the stars agree with ours, but the errors in the Alonso determinations in these cool stars are large: 108 K to 206 K with a mean of 152 K. (Our errors for these five temperatures are 40 - 89 K with a mean of 63 K.) Five of the stars in Table 3 have large reddening corrections which makes deriving photometric temperatures more problematic, but we can compare the temperatures of the other 11 stars with those of Carney et al. (1994). The temperature differences (SB02 Cetal) range from -69 to +205 K. While our temperatures are generally hotter than those of Carney et al. for these cool stars, the effect of using cooler temperatures would be to decrease the Li abundance. This generally moves the data points in Figures 10 and 11 along the lines drawn, and may flatten the slopes somewhat. For a change of 100 K the value of A(Li) is decreased by 0.10 dex.
The decline in Li abundance sets in at higher temperatures for the metal-rich stars than for the metal-poor stars in both Figures 10 and 11. This may result from a simplified view of the extent and influence of convection in metal-poor stars. The surface convection zone deepens with decreasing temperature which causes the depletion of Li in cool stars as Li gets mixed to deeper, hotter layers by convection currents and destroyed there by nuclear reactions. In low-metal stars there is less internal opacity which results in shallower convection zones in those stars with lower metal content. As we have shown in Figures 10 and 11 there is less Li destruction at a given temperature in the metal-poor stars and a given depletion of Li occurs at cooler temperatures in metal-poor stars.
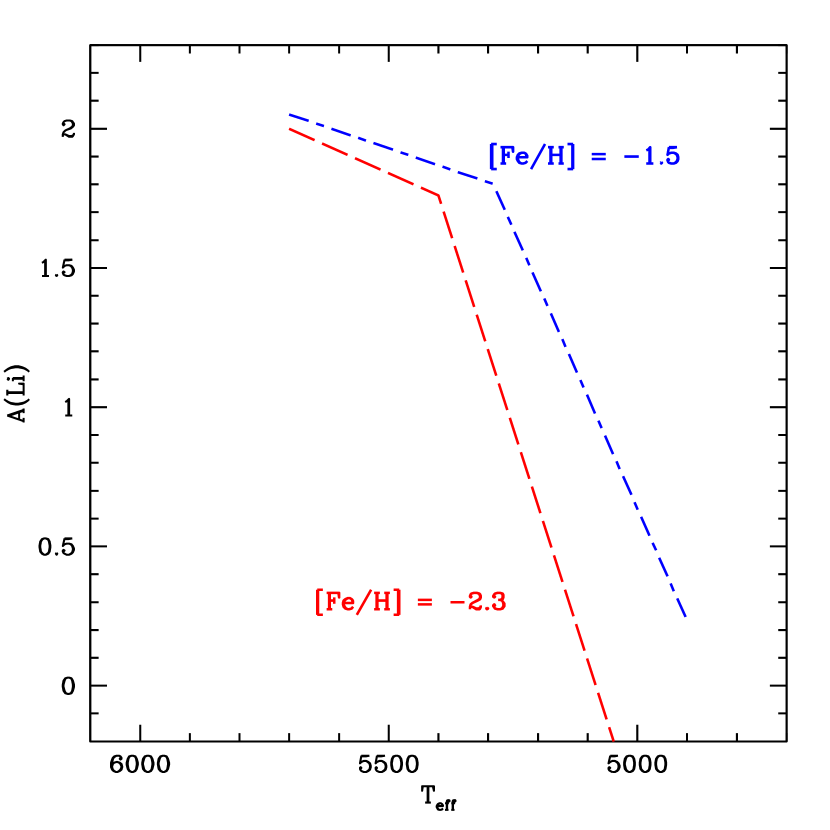
However, the results in Figures 3, 10, and 11 are in stark contrast with the actual predictions of “standard” stellar models of light element depletion. Such models ignore diffusion, rotation, mass loss, and magnetic fields and predict that metal-poor stars should experience more depletion than metal-rich stars at the same (Deliyannis, Demarque, & Kawaler 1990; Deliyannis & Demarque 1991). Figure 12 shows, on the same scale, the predictions from the models for 16.5 Gyr of Li depletion tracks for [Fe/H] = 1.5 and 2.3 from the Yale “standard” models (from Ryan & Deliyannis 1998). Not only do the models predict more Li depletion rather than less for the metal-poorest stars, they also predict a steeper decline in Li abundance than is observed. These standard model predictions fail to reproduce the abundance trends.
The depth of the convection zone in the models is nearly independent of metallicity for a given temperature. So the metallicity dependence that we have found (Figure 10) points out that the mixing effects are poorly understood for low mass halo dwarfs. There may be one aspect where the models marginally agree. Halo star models which track instabilities due to superficial spin-down and angular momentum loss (Deliyannis, Pinsonneault, & Duncan 1993; Pinsonneault, Deliyannis, & Demarque 1992, Pinsonneault et al. 1999) predict a larger Li dispersion should be present in stars with increasing metallicity (at a given ). It is not clear from Figures 3 and 5 if there really is a larger Li dispersion in the higher metallicity stars (open symbols) compared to the lower metallicity ones (solid symbols). And such a difference in dispersion could also be due to Galactic Li enrichment, perhaps seen in Figures 6-8 of increasing Li with increasing Fe, Cr, Mg, Ca, Ti, and Ba.
Those models which include rotationally-induced mixing are surely more realistic “ standard models.” There are other lines of evidence suggest that rotationally-induced mixing is a plausible cause of the observed light element abundance patterns in metal-poor stars. In particular, the correlation between A(Li) and A(Be) in field and cluster disk stars is best explained by rotationally-induced mixing (e.g. Boesgaard et al. 2004). Also, Li is enhanced at a given in short-period tidally-locked binaries which are thought to experience little rotationally-induced mixing (Ryan & Deliyannis 1995). And trends with and [Fe/H] (Thorburn 1994, Norris, Ryan, & Stringfellow 1994, Ryan et al. 1996, Ryan et al. 1999) in the Li plateau may be caused by internal mixing process affects the superficial light element concentrations in metal-poor stars.
5 Summary and Conclusions
We have obtained spectra of 55 metal-poor stars, primarily with the Keck I telescope with HIRES at high S/N per pixel (70 - 700) and high spectral resolution (48,000) and have determine Li abundances in 42 stars and upper limits on Li in the other 13. The Li abundances were found with the assumption of local thermodynamic equilibrium and then corrected for NLTE effects.
For our 14 stars in the Li plateau region ( 5700 K) with [Fe/H] 1.5 and log g 3.5 we find A(Li) = 2.215 0.110. For this subset we find trends in A(Li) with the Fe-peak elements, Cr, Fe, and Ni, with similar slopes near 0.15 to 0.18. In addition, there are clear correlations between A(Li) and the -elements, [[Mg/H]. [Ca/H], and [Ti/H]. For these elements the slopes are somewhat greater than those for the Fe-peak elements at 0.20 to 0.21. This is to be expected because of the super-solar ratios of alpha-elements in metal-poor stars which rise to higher values of [/Fe] with decreasing [Fe/H], as shown in SB02. The neutron-capture element ratio, [Ba/H] is also correlated with A(Li) with a shallower slope of 0.13 possibly indicating that these low metallicity stars have not been exposed to much enrichment by the s-process. The observed correlations could result from Galactic chemical enrichment of these elements with time, or be the result of slow Li depletion with preferentially greater depletion occurring in successively more metal-poor stars. We examined this dataset for Li abundance patterns with orbital characteristics, e.g. total orbital energy, distance at apogalacticon, stars from the high halo, or on retrograde orbits, and found no significant differences.
The majority of our stars are cool, metal-poor dwarf stars and these stars exhibit interesting trends of A(Li) with . As with metal-rich disk dwarfs, A(Li) declines with temperature as the surface convection zone deepens and Li is depleted as it is mixed to high enough temperatures to destroy it. Our stars with [Fe/H] 1.4 form an upper envelope of this depletion profile. We have looked at this in more detail with three metallicity subsets with mean [Fe/H] values of 0.9, 1.4, 1.7. The depletion sets in at cooler temperatures for successively metal-poorer stars. It is expected that the convection zones are not as extensive for the lower metallicity stars due to their lower internal opacity. Yet the observations are in contrast to the predictions for Li depletion from standard “Yale” models. Nor do the models with rotational spin-down agree with the sense or the size of the depletion with metallicity. The errors in A(Li) are typically 0.06 and 70 K for so the observations seem secure.
References
- (1)
- (2) Akerman, C.J., Carigi, L., Nissen, P.E., Pettini, M. & Asplund, M. 2004, A&A, 414, 931
- (3)
- (4) Boesgaard, A.M., Armengaud, E., King, J. R., Deliyannis, C.P. & Stephens, A. 2004, ApJ, 613, 1202
- (5)
- (6) Bonifacio, P. & Molaro, P. 1997, MNRAS, 285, 847
- (7)
- (8) Carlsson, M., Rutten, R.J., Bruls, J.H.M.J. & Shchukina, N.G. 1994, A&A, 288, 860
- (9)
- (10) Cayrel, R. 1988, in The Impact of Very High S/N Spectroscopy on Stellar Physics, eds. G. Cayrel de Strobel and M. Spite, (Dordrecth: Kluwer), p. 345
- (11)
- (12) Coc, A., Vangiono-Flam, E. Descouvemont, P., Adahchour, A. & Angulo, C. 2004, ApJ, 600, 544
- (13)
- (14) Deliyannis, C. P. & Demarque, P. 1991, ApJ, 370, 89
- (15)
- (16) Deliyannis, C. P. & Demarque, P. & Kawaler, S. D. 1990, ApJS, 73, 21
- (17)
- (18) Deliyannis, C. P., Pinsonneault, M. H., & Duncan, D. K. 1993, ApJ, 414, 740
- (19)
- (20) Fulbright, J. 2000, AJ, 120, 1841
- (21)
- (22) Kiselman, D. & Carlsson, M. 1996, A&A, 311, 680
- (23)
- (24) Kurucz, R.L. 1993, CD-ROM 1, Atomic Data for Opacity Calculations (Cambridge: SAO)
- (25)
- (26) Meléndez, J. & Ramírez, I. 2004, ApJ, 615, L33
- (27)
- (28) Norris, J. E., Ryan, S. G., & Stringfellow, G. S. 1994, ApJ, 423, 386
- (29)
- (30) Norris, J. E., Ryan, S. G., Beers, T. C., & Deliyannis, C. P. 1997, ApJ, 485, 370
- (31)
- (32) Novicki, M. 2005, Ph.D. Thesis, Univ. of Hawaii
- (33)
- (34) Pilachowski, C., Sneden, C., & Booth, J. 1993, ApJ, 407, 699
- (35)
- (36) Pilachowski, C. & Willmarth, D. 1981, Kitt Peak National Observatory Newsletter, 13, 5
- (37)
- (38) Pinsonneault, M. H., Deliyannis, C. P. & Demarque, P. 1992, ApJS, 78, 179
- (39)
- (40) Pinsonneault, M. H., Walker, T. P., Steigman, G. & Narayanan, V. K. 1999, ApJ, 527, 180
- (41)
- (42) Ryan, S.G., Beers, T.C., Deliyannis, C. P., & Thorburn, J. A 1996, ApJ, 458, 543
- (43)
- (44) Ryan, S.G., & Deliyannis, C. P. 1998, ApJ, 500, 398
- (45)
- (46) Ryan, S.G., & Deliyannis, C. P. 1995, ApJ, 453, 819
- (47)
- (48) Ryan, S.G., Norris, J.E., & Beers, T.C. 1999, ApJ, 523, 654
- (49)
- (50) Ryan, S.G., Kajino, T., Beers, T.C., Suzuki, T.K., Romano, D., Mattecucci, F. & Rosolankova, K. 2001, ApJ, 549, 55
- (51)
- (52) Ryan, S.G., Beers, T.C., Olive, K.A., Fields, B.D. & Norris, J.E. 2000, 530, L57
- (53)
- (54) Ryan, S.G. 2002, Pub. Ast. Soc. Aust., 19, 238
- (55)
- (56) Spergel, D.N. et al. 2003, ApJS, 148, 175
- (57)
- (58) Sneden, C. 1973, Ph.D. thesis, Univ. of Texas at Austin
- (59)
- (60) Spite, F. & Spite, M. 1982, å, 115, 357
- (61)
- (62) Spite, M., Maillard, J.P. & Spite, F. 1984, å, 141, 56
- (63)
- (64) Stephens, A. & Boesgaard, A.M. 2002, AJ, 123, 1647 (SB02)
- (65)
- (66) Thorburn, J. A. 1994, ApJ, 421, 318
- (67)
- (68) Timmes, F.X., Woosley, S.E., & Weaver, T.A. 1995, ApJS, 98, 617
- (69)
- (70) Vogt, S. S. et al. 1994, Proc. SPIE, 2198, 362
- (71)
- (72) Zhang, H.-W & Zhao, G. 2003, Chin. J. A&A, 3, 453
- (73)
| Star | S/N | log g | [Fe/H] | Li EQW | A(Li) | A(Li)NLTE | A(Li) | |
|---|---|---|---|---|---|---|---|---|
| G031-026 | 145 | 5546 | 4.50 | 1.32 | 16.51.0 | 1.59 | 1.64 | 0.05 |
| G171-050 | 185 | 5896 | 4.03 | 2.74 | 28.50.8 | 2.11 | 2.13 | 0.05 |
| G158-100 | 135 | 4981 | 4.16 | 2.55 | 4.41.1 | 0.49 | ||
| G033-031 | 130 | 4941 | 4.45 | 1.12 | 4.51.1 | 0.22 | ||
| G005-019 | 110 | 5942 | 4.24 | 1.16 | 33.01.3 | 2.26 | 2.26 | 0.05 |
| G037-037 | 105 | 5990 | 3.76 | 2.35 | 34.51.4 | 2.28 | 2.28 | 0.07 |
| G005-035 | 120 | 5439 | 4.18 | 1.76 | 26.01.2 | 1.71 | 1.77 | 0.05 |
| G246-038 | 680 | 5057 | 4.24 | 2.32 | 0.90.2 | 0.16 | ||
| G095-060 | 90 | 5169 | 4.51 | 1.64 | 10.01.7 | 0.99 | 1.09 | 0.05 |
| G082-005 | 200 | 5378 | 4.43 | 0.71 | 7.00.7 | 0.90 | 0.98 | 0.04 |
| G082-023 | 135 | 4934 | 3.64 | 3.49 | 4.41.1 | 0.44 | ||
| G247-027 | 160 | 5016 | 4.40 | 1.97 | 5.90.9 | 0.61 | ||
| G084-052 | 70 | 5039 | 4.83 | 1.64 | 8.42.1 | 0.74 | ||
| G097-040 | 80 | 5427 | 4.62 | 1.52 | 9.01.9 | 1.20 | 1.27: | 0.05 |
| LTT 2415 | 140 | 6295 | 4.11 | 2.13 | 23.51.1 | 2.31 | 2.28 | 0.06 |
| G110-034 | 100 | 5686 | 4.11 | 2.11 | 35.01.5 | 2.07 | 2.10 | 0.06 |
| G088-032 | 120 | 6136 | 3.54 | 2.55 | 22.01.2 | 2.17 | 2.17 | 0.06 |
| G088-042 | 90 | 5192 | 4.20 | 1.78 | 11.51.7 | 1.08 | 1.19 | 0.05 |
| G090-036 | 100 | 5319 | 4.14 | 1.76 | 25.51.5 | 1.59 | 1.67 | 0.06 |
| G251-024 | 90 | 5569 | 3.47 | 1.76 | 21.01.7 | 1.73 | 1.79 | 0.09 |
| G046-005 | 150 | 5191 | 4.83 | 1.41 | 3.91.0 | 0.53 | ||
| G009-036 | 140 | 5788 | 4.35 | 1.12 | 34.01.1 | 2.15 | 2.17 | 0.06 |
| G114-042 | 110 | 5761 | 4.34 | 1.11 | 22.51.3 | 1.92 | 1.95 | 0.09 |
| G116-053 | 100 | 5732 | 4.45 | 1.03 | 20.01.5 | 1.84 | 1.87 | 0.06 |
| G121-012 | 185 | 6163 | 4.37 | 0.80 | 45.00.8 | 2.59 | 2.55 | 0.05 |
| G197-030 | 95 | 5111 | 4.94 | 1.74 | 6.21.6 | 0.72 | 0.82: | |
| G122-051 | 700 | 5102 | 4.67 | 1.34 | 3.50.2 | 0.35 | 0.44: | 0.04 |
| G011-044 | 120 | 5924 | 3.82 | 2.23 | 33.01.2 | 2.21 | 2.28 | 0.06 |
| G238-030 | 210 | 5383 | 3.43 | 3.60 | 25.00.7 | 1.62 | 1.70: | 0.05 |
| G064-012 | 310 | 6074 | 3.72 | 3.45 | 24.00.5 | 2.15 | 2.15: | 0.06 |
| G165-039 | 210 | 6118 | 3.53 | 2.18 | 23.50.7 | 2.20 | 2.19 | 0.05 |
| G064-037 | 295 | 6122 | 3.87 | 3.28 | 15.50.5 | 1.97 | 1.97: | 0.05 |
| G166-037 | 110 | 5350 | 4.71 | 1.40 | 11.01.3 | 1.20 | 1.28: | 0.07 |
| G201-005 | 205 | 6018 | 3.79 | 2.50 | 27.00.7 | 2.17 | 2.17 | 0.06 |
| G239-026 | 160 | 5862 | 4.31 | 2.20 | 41.00.9 | 2.28 | 2.28 | 0.05 |
| G015-013 | 200 | 5082 | 4.61 | 1.72 | 3.00.7 | 0.33 | 0.41: | 0.05 |
| G016-025 | 120 | 5431 | 4.28 | 1.85 | 4.91.2 | 0.94 | 1.03 | |
| G180-024 | 240 | 6108 | 4.12 | 1.40 | 32.00.6 | 2.35 | 2.33 | 0.08 |
| G168-042 | 185 | 5486 | 4.80 | 0.84 | 9.00.8 | 1.18 | 1.25: | 0.07 |
| G170-021 | 100 | 5664 | 4.65 | 1.47 | 24.01.5 | 1.88 | 1.91: | 0.07 |
| G020-008aaKPNO data | 215 | 5960 | 4.04 | 2.33 | 36.00.7 | 2.28 | 2.28 | 0.05 |
| G020-008bbKECK data | 150 | 5940 | 3.91 | 2.34 | 33.01.0 | 2.22 | 2.23 | 0.05 |
| G184-007 | 115 | 5147 | 4.85 | 1.63 | 5.11.3 | 0.64 | ||
| G262-021 | 125 | 4985 | 4.26 | 1.44 | 4.71.2 | 0.37 | ||
| G144-028 | 140 | 5310 | 4.19 | 2.14 | 21.51.1 | 1.51 | 1.59 | 0.05 |
| G025-024 | 180 | 5733 | 3.98 | 1.96 | 40.50.8 | 2.19 | 2.21 | 0.05 |
| G093-001 | 65 | 5430 | 4.37 | 1.59 | 17.52.3 | 1.51 | 1.58 | 0.08 |
| G026-012 | 320 | 6089 | 4.04 | 2.49 | 28.00.5 | 2.24 | 2.23 | 0.05 |
| G188-020 | 170 | 6174 | 4.14 | 1.58 | 35.50.9 | 2.45 | 2.42 | 0.05 |
| G188-030 | 350 | 5141 | 4.44 | 1.90 | 7.00.4 | 0.82 | 0.91 | 0.04 |
| G018-040 | 140 | 5681 | 4.18 | 1.93 | 36.51.1 | 2.09 | 2.11 | 0.05 |
| G241-004 | 110 | 5139 | 5.00 | 1.57 | 5.41.3 | 0.67 | 0.77: | |
| G215-047 | 150 | 5854 | 4.25 | 1.39 | 38.01.0 | 2.25 | 2.26 | 0.07 |
| G233-026 | 80 | 5303 | 4.39 | 1.45 | 9.01.9 | 1.06 | 1.15 | 0.05 |
| G189-050 | 180 | 5254 | 4.32 | 1.47 | 23.50.8 | 1.46 | 1.55 | 0.06 |
| G242-019 | 155 | 5039 | 4.20 | 2.12 | 3.81.0 | 0.45 |
| Star | log g | [Fe/H] | [Fe/H] | A(Li) | A(Li) | [Mg/H] | [Mg/H] | [Ca/H] | [Ca/H] | [Ti/H] | [Ti/H] | [Cr/H] | [Cr/H] | [Ni/H] | [Ni/H] | [Ba/H] | [Ba/H] | |
|---|---|---|---|---|---|---|---|---|---|---|---|---|---|---|---|---|---|---|
| G171-050 | 5896 | 4.03 | 2.74 | 0.06 | 2.11 | 0.05 | 2.31 | 0.16 | 2.39 | 0.15 | 2.43 | 0.09 | 2.90 | 0.06 | 2.68 | 0.09 | 2.52 | 0.06 |
| G037-037 | 5990 | 3.76 | 2.35 | 0.06 | 2.28 | 0.07 | 2.14 | 0.29 | 2.01 | 0.09 | 2.01 | 0.08 | 2.42 | 0.17 | 2.42 | 0.09 | 2.39 | 0.09 |
| LTT 2415 | 6295 | 4.11 | 2.13 | 0.05 | 2.31 | 0.06 | 1.88 | 0.16 | 1.78 | 0.07 | 1.71 | 0.09 | 2.17 | 0.07 | 2.16 | 0.10 | 2.14 | 0.07 |
| G088-032 | 6136 | 3.54 | 2.55 | 0.06 | 2.17 | 0.06 | 2.02 | 0.16 | 2.18 | 0.06 | 2.09 | 0.09 | 2.54 | 0.14 | 2.45 | 0.16 | 2.96 | 0.13 |
| G011-044 | 5924 | 3.82 | 2.23 | 0.06 | 2.21 | 0.06 | 1.83 | 0.10 | 1.82 | 0.12 | 1.90 | 0.08 | 2.23 | 0.08 | 2.17 | 0.16 | 2.73 | 0.08 |
| G064-012 | 6074 | 3.72 | 3.45 | 0.04 | 2.15 | 0.06 | 2.82 | 0.16 | 2.84 | 0.09 | 2.95 | 0.11 | 3.38 | 0.28 | 3.73 | 0.16 | 3.65 | 0.13 |
| G165-039 | 6118 | 3.53 | 2.18 | 0.04 | 2.20 | 0.05 | 1.91 | 0.25 | 1.69 | 0.10 | 1.74 | 0.05 | 2.14 | 0.09 | 2.16 | 0.09 | 2.16 | 0.09 |
| G064-037 | 6122 | 3.87 | 3.28 | 0.04 | 1.97 | 0.05 | 2.81 | 0.16 | 2.84 | 0.10 | 2.77 | 0.06 | 3.50 | 0.15 | 3.38 | 0.16 | 3.77 | 0.16 |
| G201-005 | 6018 | 3.79 | 2.50 | 0.05 | 2.17 | 0.06 | 2.08 | 0.16 | 2.16 | 0.09 | 2.14 | 0.06 | 2.44 | 0.14 | 2.41 | 0.07 | 3.01 | 0.09 |
| G239-026 | 5862 | 4.31 | 2.20 | 0.05 | 2.28 | 0.05 | 1.94 | 0.06 | 1.97 | 0.10 | 2.02 | 0.08 | 2.30 | 0.09 | 2.37 | 0.22 | 2.39 | 0.05 |
| G020-008 | 5960 | 4.04 | 2.33 | 0.06 | 2.28 | 0.05 | 1.89 | 0.09 | 1.91 | 0.09 | 1.93 | 0.10 | 2.34 | 0.08 | 2.33 | 0.06 | 2.63 | 0.06 |
| G025-024 | 5733 | 3.98 | 1.96 | 0.05 | 2.19 | 0.05 | 1.67 | 0.06 | 1.66 | 0.07 | 1.75 | 0.06 | 2.01 | 0.07 | 1.99 | 0.10 | 1.88 | 0.14 |
| G026-012 | 6089 | 4.04 | 2.49 | 0.05 | 2.24 | 0.05 | 2.08 | 0.08 | 2.05 | 0.11 | 2.09 | 0.07 | 2.53 | 0.08 | 2.59 | 0.14 | 2.94 | 0.06 |
| G188-020 | 6174 | 4.14 | 1.58 | 0.05 | 2.45 | 0.05 | 1.26 | 0.05 | 1.22 | 0.09 | 1.22 | 0.06 | 1.57 | 0.09 | 1.54 | 0.17 | 1.39 | 0.17 |
| Star | [Fe/H] | A(Li) | A(Li)NLTE | |
|---|---|---|---|---|
| [Fe/H] = 0.70 to 1.03; [Fe/H] = 0.86 | ||||
| G082-005 | 5378 | 0.71 | 0.90 | 0.98 |
| G168-042 | 5486 | 0.84 | 1.18 | 1.25 |
| G116-053 | 5732 | 1.03 | 1.84 | 1.87 |
| [Fe/H] = 1.24 to 1.47; [Fe/H] = 1.41 | ||||
| G031-026 | 5546 | 1.32 | 1.59 | 1.64 |
| G122-051 | 5102 | 1.34 | 0.35 | 0.44 |
| G166-037 | 5350 | 1.40 | 1.20 | 1.28 |
| G170-021 | 5664 | 1.47 | 1.88 | 1.91 |
| G233-026 | 5303 | 1.45 | 1.06 | 1.15 |
| G189-050 | 5254 | 1.47 | 1.46 | 1.55 |
| [Fe/H] = 1.58 to 1.90; [Fe/H] = 1.74 | ||||
| G005-035 | 5439 | 1.76 | 1.71 | 1.77 |
| G095-060 | 5169 | 1.64 | 0.99 | 1.09 |
| G088-042 | 5192 | 1.78 | 1.08 | 1.19 |
| G090-036 | 5319 | 1.76 | 1.59 | 1.67 |
| G015-013 | 5082 | 1.72 | 0.33 | 0.41 |
| G093-001 | 5430 | 1.59 | 1.51 | 1.58 |
| G188-030 | 5141 | 1.90 | 0.82 | 0.91 |