The Locus of Highly Accreting AGNs on the – Plane: Selections, Limitations, and Implications
Abstract
We re-examine the locus of narrow line Seyfert 1 galaxies on the – (black hole mass–bulge velocity dispersion) plane in the light of the results from large new optically selected samples. We find that (1) soft X-ray selected NLS1s have a lower ratio of BH mass to than broad line Seyfert 1 galaxies; this remains a robust statistical result contrary to recent claims otherwise; (2) optically selected NLS1s have systematically lower Eddington luminosity ratio compared to X-ray selected NLS1s; and (3) as a result, the locus of NLS1s on the – plane is affected by selection effects. We argue that there is no single explanation for the origin of the – relation; instead tracks of galaxies on the – plane differ with redshift, consistent with the downsizing of AGN activity. If these results at face value are incorrect, then the data imply that AGNs with high Eddington accretion reside preferentially in relatively late type galaxies at the present epoch, perhaps a more interesting result and a challenge to theoretical models.
1 Introduction
How do black holes (BHs) form, how do they grow, when do they become “active” as in quasars and low redshift active galactic nuclei (AGNs), what is the accretion history of BHs, how does it relate to their active phase and how does all this relate to the formation and evolution of galaxies? These questions have received considerable attention in the literature in the past five years or so, at least in part due to the discovery of the – relation Gebhardt et al. 2000a ; Ferrarese & Merritt (2000); Merritt & Ferrarese (2001). The tight correlation between BH mass and the bulge velocity dispersion of its host galaxy implies that the ultimate fate of the two is linked. It is not obvious, however, how galaxies and their BHs find their way onto the – relation. A large number of theoretical models attempt to explain the observed correlation with a variety of physical processes; regulation of the bulge growth by the feedback from the active BH appears to be a popular one (e.g. King & Pounds 2003, Hopkins et al. 2005; see Mathur & Grupe 2004 for a more extensive list of references).
Do all BHs follow the same track on the – plane or does it depend on BH mass, redshift, galaxy properties or any other parameter? It is of interest, therefore, to find loci of high redshift AGNs on the – plane. Rix et al. (1999) find that z quasars have higher BH mass to host galaxy stellar mass ratio compared to that at z=0; as such they would lie above the Tremaine et al. fit Tremaine et al. (2003) to the – relation. This implies that high redshift luminous BHs grew fast while their host galaxies were still in the process of assembling. At low redshift, on the other hand, galaxies presumably have finished growing while black holes accreting at the Eddington rate will e-fold their mass in a Salpeter time. Finding the locus of highly accreting BHs on the – plane is also of interest, therefore, to understand the origin of the - relation. In the local universe, a class of Seyfert galaxies called the narrow line Seyfert 1 galaxies (NLS1s) are known to be highly accreting AGNs (Pounds et al. 1995). The locus of NLS1s on the – plane is therefore of considerable interest and is the subject of this paper. While there may not be a single answer to the origin of the – relation, e.g. it may differ with redshift, NLS1s promise to provide at least a piece of the puzzle.
2 NLS1s and the – relation
Methods that work well for measuring BH masses in normal galaxies, such as gas dynamics and stellar dynamics, do not work well for active galaxies; the glare of the active nucleus makes it difficult to use these techniques. For AGNs, reverberation mapping provides a powerful technique to measure BH masses and has been employed successfully on nearby Seyfert galaxies (Peterson 1993). Reverberation mapping, however, is time intensive, so reliable BH mass measurements have been made of only a small number of AGNs. Based on the reverberation mapped AGNs, Kaspi et al. determined an empirical relation between and the width of the H emission line & optical continuum luminosity Kaspi et al. (2000). This simple and well calibrated relation can be easily used to estimate BH masses in a large number of AGNs and has been used by a number of authors McLure & Dunlop (2002); Shields et al. (2003). Measuring poses a bigger problem, because the strong AGN light washes out underlying stellar absorption lines. The width of the narrow [OIII] emission line is often used as a surrogate for the bulge . It was noted by Whittle (1992) that the kinematics of the narrow line region of AGNs is governed by the gravitational potential of the host galaxy bulge, and not by the nuclear BH. Nelson & Whittle (1995a,b) found that FWHM([OIII]) is correlated with bulge . The outliers in the correlation were sources with strong radio jets; since most AGNs are radio-quiet, without strong jets, the use of FWHM([OIII]) as a surrogate for bulge appeared to be reasonable.
Mathur et al. (2001) were the first to place NLS1s on the – plane and found that they do not follow the same relation as broad line Seyfert 1s (BLS1s) and normal galaxies. They used X-ray spectral energy distribution to estimate the BH masses and [OIII] widths to estimate . Using a complete sample of soft X-ray selected AGNs, Grupe & Mathur (2004, Paper I hereafter) confirmed the above result. Specifically, they found that for a given , NLS1s have smaller BH masses compared to BLS1s. Their BLS1 and NLS1 samples spanned the same range in luminosity, so were well matched. In paper I, the H width was used to measure BH mass and again, [OIII] widths were used to estimate . Below we consider limitations of, controversies about, and implications of the above result.
2.1 Limitations
Paper I discusses the limitations of methods to estimate and in detail. Here we reiterate a few for the sake of completeness and emphasize a few more. There are many sources of error in using the Kaspi et al. (2000) relation to estimate BH masses: (1) this relation is calibrated on reverberation mapping measurements of , which itself is uncertain by a factor of few because of the unknown geometry of the broad emission line region. (2) While there are a few NLS1s in the broad line region radius – luminosity correlation in Peterson et al. (2000), their sample is not large enough to cover the observed range of in our samples. (3) Extrapolation of the Kaspi et al. relation to higher or lower masses would introduce an additional source of error in BH mass estimates. As a result, errors on individual values are large.
The errors on individual values are also large for various reasons. The correlation between FWHM([OIII]) and Nelson (2000) has a large scatter which produces one source of error. Secondly, [OIII] lines often show some blue asymmetry, which would overestimate FWHM([OIII]) of the core component. We corrected for the asymmetry in the [OIII] line profile in Paper I; even so, the errors on remain large.
Because of large errors on individual and measurements, we have emphasized in Paper I that the results are statistical in nature and are robust for determining the aggregate properties of the samples. These, however, are the results at face-value. Confirmation of these results require more accurate measurements of and .
2.2 Controversies
The aforementioned results, however, are controversial. While the use of FWHM(H) as a surrogate for is well accepted, the same cannot be said about FWHM([OIII]) as a surrogate for . Perhaps the most important issue regarding the use of as a surrogate for was highlighted recently by Greene & Ho (2005, GH05 hereafter), which we discuss below.
Using a large sample of narrow line AGNs111Please note that these narrow line AGNs are not NLS1s. These are AGNs in which only narrow lines from the narrow lines region of AGNs are visible while the strong nuclear continuum and the broad line region are hidden. These are traditionally referred to as type 2 AGNs. selected from the Sloan Digital Sky Survey (SDSS) GH05 compared the bulge velocity dispersion measured using the underlying host galaxy spectrum and using the narrow [OIII] emission line. This was an important study as it contained a very large sample, compared to the original work of Nelson & Whittle (1995, 1996). Moreover, the sample selection, data reduction and analysis were performed in a homogeneous way. Based on this comparison, GH05 concluded that indeed, the kinematics of the NLR gas is dominated by the bulge gravity; the widths of the low ionization NLR emission lines such [SII] and [OII] track the stellar velocity dispersion in the mean, albeit with substantial scatter. As such, they may be used as a proxy for . On the other hand, the width of the [OIII] line is significantly broader than , so cannot be used as a proxy for . However, when the blue asymmetric wing of [OIII] is removed, the width of the core component does track . This is an important conclusion because it validates the use of (after removing the blue wing) as a surrogate for in previous studies and will help many future studies. Moreover, as mentioned above, the main result of Paper I (that NLS1s have lower mass BHs than BLS1s for a given ) was derived after removing the blue asymmetry of [OIII] lines, and is thus a statistically robust result (see below). Nonetheless, GH05 point out that the scatter around the – relation is large, even after removing the blue wing, so of the core component should be used as a proxy for only in a statistical sense, as done and emphasized in Paper I. Boroson (2003) also pointed out the same using SDSS early release data, viz. the scatter in around the – relation is large and therefore should be used as a surrogate for only in a statistical sense. The Nelson & Whittle studies (1995, 1996) had one advantage over GH05; they could effectively identify the outliers in the – correlation with disturbed galaxies and/or powerful linear radio sources. Given the SDSS data quality and the sensitivity of the FIRST survey used by GH05, such identifications could not be made. One should also keep in mind that the GH05 study is based on type 2 AGNs; while it is reasonable to extend it to type 1 AGNs if orientation is the only difference between the two types, it may not be so.
Greene & Ho (2005) then go on to find secondary drivers of the deviations of from , parameterized with . They consider host galaxy morphology, local environment, star formation rate, bulge velocity dispersion, radio power, AGN luminosity, and the ratio of bolometric to Eddington luminosity (LLEdd) as possible secondary drivers. They do not find any strong correlation between and any of these parameters (though note the caveat above) except LLEdd. There appears to be a mild but systematic trend of higher in objects with higher LLEdd (formal Spearman rank correlation coefficient of 0.46, with a probability of chance correlation P) as shown in equation 3 of GH05, which is
| (1) |
for FWHM([OIII]). This led GH05 to conclude that is overestimated in objects with high LLEdd, such as NLS1s and high redshift quasars (Paper I, Shields et al. 2003).
Given the implications of these results (§3), it is important to establish whether is truly a function of LLEdd. GH05 have calculated Lbol using observed L[OIII] and a bolometric correction factor. Since their SDSS sample consists of narrow line AGNs, broad H lines are not observed, so there is no direct handle on BH mass, and so on LEdd. GH05 use the – relation of Tremaine et al (2003) to derive and so LEdd from the observed values of . Thus a function of is compared to , which in itself is a function of suggesting that the correlation between and LLEdd claimed by GH05 may be a result of a circular argument. To investigate further whether this is indeed the case, we re-wrote the above correlation equation in terms of the actual observed quantities. We find that it translates to:
| (2) |
where numerical values of constants A, B and C are a result of correlations between Lbol and L[OIII], and , and equation 1. Thus we see from equation 2 that the actual relations underlying equation 1 are a mild correlation between and L[OIII] (with a slope A=) and a strong correlation between and (with a slope B=), rather than the correlation between and LLEdd.
GH05 have also noted that correlates strongly with (as can be seen from equation 2), or with , assuming – relation. Since LLEdd depends upon BH mass, they consider whether or LLEdd is the primary driver of . They conclude that LLEdd is the primary physical parameter because the correlation of with this parameter is stronger (Spearman rank correlation coefficient ) than that with (Spearman rank correlation coefficient ). As shown above with equation 2, part of the correlation with LLEdd has come about because of the correlation of with and the rest because of the correlation of with (Nelson & Whittle 1996).
Is really correlated with L[OIII]? A literature search showed that such a correlation indeed exists in the 2dF quasar sample (Corbett et al. 2003) with the probability of a chance correlation (see also Whittle 1985). In fact, [OIII] is the only narrow line showing a correlation with luminosity in their sample. The slope and normalization of the correlation are not given in Corbett et al. (2003); however, they give the slope and normalization of the correlation between [OIII] width and Lb, the luminosity estimated from the absolute photographic bJ magnitude contributing to the emission line. It is interesting to note that the slope of their FWHM([OIII])–Lb correlation is , consistent with A= in equation 2. We also looked for this correlation in the NLS1 sample in Paper I, using the data in Grupe et al. (2004). Indeed, the data are consistent with a mild correlation between and L[OIII] with slope A=. Thus it is apparent that at least part of the claimed result of GH05, that correlates with LLEdd, can be explained in terms of the observed correlation between and L[OIII]. The rest is due to the correlation of with (Nelson & Whittle 1996). Note also that a strong correlation between L[OIII] and is reported by Nelson & Whittle (1996), which may arise from the correlations between L[OIII] and and between and .
We further investigated to what extent the results of Paper I would be compromised, if at all, if equation 1 were in fact a true correlation. There is other evidence in the literature suggesting that the excess [OIII] width is correlated with LLEdd. Recently, Boroson (2005) has systematically studied the [OIII] lines in a sample of 400 AGN spectra selected from the SDSS first data release. Unlike the GH05 sample, the spectra of the Boroson sample contain the broad H lines, giving direct estimates of BH masses and so of LEdd. He finds that (1) objects with higher Eddington ratio are more likely to have large [OIII] blueshifts; and (2) objects with large [OIII] blueshifts have anomalously broad [OIII] emission lines. However, these are not tight correlations; there are high LLEdd objects that do not show blueshifts, and lower LLEdd objects that do. Nonetheless, given the Boroson (2005) results, we need to investigate the effect of – LLEdd correlation on the result of Paper I.
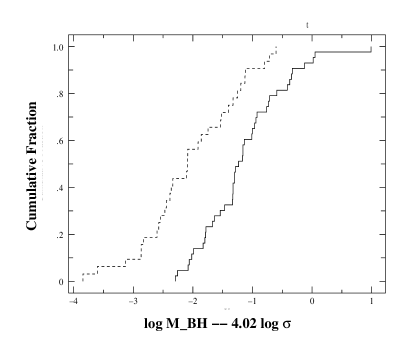
As shown in Paper I, the BH masses of our two samples of BLS1s and NLS1s are significantly different. If both samples followed the – relation, (Tremaine et al. 2003). We calculated the to ratio for all the objects in our sample, with new values calculated using equation 1. These new values of are used in Figure 1, where we plot the cumulative fraction for a K-S test of the distributions of for the two populations of BLS1s and NLS1s of Paper I. It can be clearly seen that the two populations are significantly different, with the formal K-S test probability of being drawn from the same population P. A Student’s t-test gives the probability of the two populations being similar to be P. We thus conclude that the to ratio of NLS1s is statistically smaller than that of BLS1s.
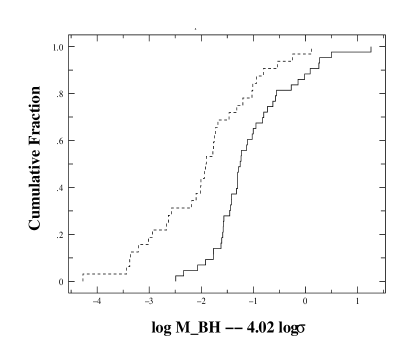
Since equation 1 is defined for in which FWHM([OIII])/2.35, that is what we used for in the K-S test shown in figure 1. However, as discussed above, it is better to remove the contribution from the blue wing of [OIII] before measuring its width. In figure 2, we plot the cumulative fraction for a K-S test of in which is measured after removing the blue wing222This is similar to Figure 4 of Paper 1, except that the statistic used is instead of . The two populations are clearly different with the K-S test probability of being drawn from the same population P (t-test probability P). GH05 do not give correlation equation for – LLEdd when is measured after removing the blue wing. Nonetheless, we once again apply the “correction” of equation 1 to the values calculated after removing the blue wing and perform the K-S test again. The two populations are still significantly different, with the probability of being drawn from the same population P (t-test probability P=).
The above exercises demonstrate that the soft X-ray selected samples of NLS1s and BLS1s of Paper I are statistically significantly different in to ratio, even when correlation of with LLEdd, as given in equation 1, is accounted for.
2.3 Why some NLS1s lie close to the – relation.
As noted by many authors (Mathur et al. 2001, Ferrarese et al. 2001, Grupe & Mathur 2004, Mathur & Grupe 2005, Barth et al. 2005), not all NLS1s have relatively smaller BH mass for their bulge . While some values of were estimated using as discussed above, some actual measurements of in NLS1 host galaxies also exist. Ferrarese et al. (2001) measured in NLS1 galaxy NGC 4051 for which BH mass is measured using reverberation mapping (Peterson et al. 2000). They found the source to lie close to the – relation. This, however, is no surprise because NGC 4051 lies close to the – relation even in Mathur et al. (2001) in which was used as a proxy for . More recently, Barth et al. (2005) measured using Mg b and/or CaII stellar absorption lines for a sample of NLS1s selected from SDSS (Greene & Ho 2004). They also find that the measured is not significantly different from that expected from the – relation. Clearly, these and similar such results are at odds with the expectation that NLS1s have growing BHs (Mathur et al. 2001, Paper I) and are thus young AGNs (Mathur 2000). One may argue that all objects with accurate measurements of lie on the – relation, so again, [OIII] line widths must be at fault. However, the example of NGC 4051, and the fact that after removing the blue wing does track , all suggest that some other factor is likely involved in this apparent contradiction.
One clue towards the reconciliation of these conflicting results comes from the work of Williams, Mathur & Pogge (2004). Since most large NLS1 samples were soft-X-ray selected, they were clearly biased towards X-ray bright objects. To remedy this situation, Williams, Pogge & Mathur (2002) constructed a large, uniformly selected optical sample of NLS1s from the SDSS early data release and found that only a fraction of them were detected in the ROSAT All Sky Survey. They performed follow up Chandra observations of ROSAT undetected sources and found that NLS1s are a mixed bag. Not all of them are soft-X-ray bright or have steep X-ray spectra indicative of high values of LLEdd. Moreover, they found that the soft-X-ray power-law slope correlates with LLEdd, with flat spectrum sources having lower LLEdd (see also Grupe 2004; Lu & Yu 1999). This strongly suggests that not all NLS1s are highly accreting sources and a large fraction of optically selected NLS1s falls in this category. Indeed, Mathur & Grupe (2005) have shown that NLS1s in their sample which have higher LLEdd have larger than those with similar BH masses, but lower LLEdd, and are thus likely to be growing.
We started to find the locus of NLS1s on the – plane because NLS1s as a class were thought to have large accretion rates relative to Eddington (/) leading to large LLEdd compared to BLS1s. The above results, however, show that not all NLS1s have large and indicate that sample selection methods strongly influence the results. To investigate this further, we compared the distributions of LLEdd for three samples: the soft-X-ray selected sample of NLS1s from Paper 1, the optically selected sample of NLS1s from Greene & Ho (2004), and the BLS1 sample from Paper I. The LLEdd values given in table 3 of Greene & Ho (2004) were corrected using the values from Barth et al. (2004), which are better determined with higher quality data on H. The LLEdd values for the soft-X-ray selected samples are from Grupe et al. (2004). One has to be cautious in comparing these samples because they do not use the same prescription to estimate Lbol. Greene & Ho (2004) use LL5100 uniformly for the entire sample, while Grupe et al. (2004) estimate the bolometric correction separately for each object in the sample using the observed spectral energy distribution. Inspection of figure 8 in Grupe (2004) reveals that the two bolometric corrections are consistent with each other. BH masses in all the three samples are estimated using H, so carry similar uncertainties. In figure 3 we plot the distributions of LLEdd for the three samples. What is seen is that the soft-X-ray selected NLS1 sample peaks at high LLEdd, the optically selected sample peaks at lower LLEdd, and the BLS1 sample peaks at even lower LLEdd. Indeed the mean LLEdd of the soft-X-ray selected NLS1 sample is , that of optically selected NLS1 sample is and that of soft X-ray selected BLS1s is (the average LLEdd of optically selected BLS1s may be even lower). This result is consistent with Williams et al. (2004) who found that the mean value of soft X-ray power-law slope decreases steadily from soft X-ray selected NLS1s to optically selected NLS1s to BLS1s.
The above results imply that soft X-ray selected NLS1s are highly likely to contain AGNs with large LLEdd, but optically selected NLS1s are not. Since AGNs with large LLEdd, and so large , are the likely ones with rapidly growing BHs, only they should have a distinct locus on the – plane, away from the Tremaine et al. relation. It should then be no surprise to find that NLS1s with relatively smaller LLEdd, notably optically selected NLS1s, lie close to the Tremaine et al. relation, as shown in, e.g., Barth et al. (2004).
3 Discussion & Conclusions
Our result at face value, that highly accreting AGNs at low redshift have lower /4 ratios than those of AGNs with low accretion rates, has implications toward our understanding of the origin of the – relation (the AGNs with high LLEdd are a subset of NLS1s while BLS1s have lower LLEdd). It tells us that BHs grow rapidly in their high accretion mode and approach the – relation asymptotically. This appears to be the case at least at low redshift where BHs grow in well-formed bulges.
At higher redshifts, however, the situation appears to be different. As discussed in §1, quasars at high redshift appear to lie above the – relation. This implies that the BHs in these quasars are likely to have already grown to their “final” mass, but their host galaxies have yet to grow further through interactions and mergers. Thus the tracks of high redshift quasars on the – plane may be horizontal, from low to high mass bulges while that of low redshift Seyfert galaxies may be vertical, from low to high BH masses. At low redshift, where merger rates are very low, bulges in some galaxies have grown to their “final” mass/ velocity dispersion, before their BHs have fully grown. This is consistent with the newly emerging picture of “downsizing of AGN activity” or the “anti-hierarchical BH growth” in which high mass BHs grow rapidly at high redshift while lower mass BHs grow at successively lower redshifts (Merloni 2004). Since we are probing BHs of in our NLS1 sample, it makes sense that we catch them in their growing stage at present epoch (Mathur & Grupe 2004).
Thus, we argue that there is no single answer to the origin of the – relation; it is a function of redshift. The feedback from AGN may be the primary mechanism governing the co-evolution BHs and galaxies at high redshift (Hopkins et al. 2005), but it may not work at low redshift where merger rates are exceedingly low. Of course, not all bulges are formed through mergers; disk/bar instability can also result in formation of pseudo-bulges (Kormendy & Kennicutt 2004). To our knowledge there is no theoretical model on the co-evolution of BHs and pseudo-bulges to explain the – relation via feedback. Some other mechanism, e.g. controlled accretion rate due to capture of bulge stars by the accretion disk (Kollmeier & Miralda-Escude 2004), may play a dominant role at low redshift in ultimately placing all galaxies on the – relation.
On the other hand, our result at face value may not be correct due to incorrect estimates of (incorrect estimates are unlikely; Paper I). It just may be that all galaxies, with dead or active BHs, with low or high accretion rates, follow the same – relation. Implications of such a result are perhaps even more interesting. As shown in Paper I (their figure 2), the distributions of BH masses of our soft X-ray selected NLS1 and BLS1 samples are significantly different, with average of NLS1s being 6.9 and that of BLS1s equal to 7.9. If all these galaxies lie on the – relation, it would imply that NLS1s preferentially reside in host galaxies with low mass/velocity dispersion bulges, or in later type galaxies. Since a subset of these NLS1s have high =/, this implies that BHs with high Eddington ratio preferentially reside in later type galaxies at low redshifts, compared to AGNs with low Eddington accretion. This may be even a more challenging theoretical problem to address, than the origin of the – relation, for which there seem to have plenty of explanations. Some of this might simply be a gas supply issue. If the gas available to feed the BHs at present epoch is relatively small, the accretion rate on smaller mass BHs may be close to Eddington, but it would be substantially sub-Eddington for higher mass BHs. When we search for luminous NLS1s based on their narrow H widths, we are necessarily looking for smaller mass BHs with high accretion rates, and they are to be found in later type galaxies. Both the high mass and low mass BHs would be growing in mass by the same rate then, but the fractional growth would still be higher for the lower mass BHs. To keep the high BHs from moving away from the – relation, the gas supply in late type galaxies will have to be lower. Finding the locus of highly accreting AGNs on the – plane is important either way.
We are grateful to the anonymous referee for careful and thoughtful reading of the paper and useful comments. We also thank Greene & Ho for their comments.

References
- Barth et al. (2005) Barth, A., Greene, J., & Ho, L. 2005, ApJL, 619, 151
- Boroson (2003) Boroson, T.A., 2003, ApJ, 585, 647
- (3) Corbett, E.A. et al. 2003, MNRAS, 343,705
- Ferrarese & Merritt (2000) Ferrarese, L., & Merritt, D., 2000, ApJ, 539, L9
- Ferrarese et al. (2001) Ferrarese, L., Pogge, R.W., Peterson, B.M., Merritt, D., Wandel, A., & Joseph, C.L., 2001, ApJ, 555, L55
- (6) Gebhardt, K., Bender, R., Bower, G., Dressler, A., Faber, S.M., et al., 2000, A&A, 539, L13
- (7) Gebhardt, K., Kormendy, J., Ho, L.C., Bender, R., Bower, G., et al., 2000, ApJ, 543, L5
- Greene & Ho (2004) Greene, J. & Ho., L. 2004 ApJ, 610, 722
- Greene & Ho (2005) Greene, J. & Ho., L. 2005 ApJ, in press. astro-ph/0503675
- Grupe et al. (2004) Grupe, D., Wills, B.J., Leighly, K.M., & Meusinger, H., 2004, AJ, 127, 156
- Grupe (2004) Grupe, D., 2004, AJ, 127, 1799
- Grupe & Mathur (2004) Grupe, D., & Mathur, S. 2004, ApJL, 606, 41
- Hopkins et al. (2005) Hopkins, P. et al. 2005, ApJ, submitted. astro-ph/0504253
- Kaspi et al. (2000) Kaspi, S., Smith, P.S., Netzer, H., Moaz, D., Jannuzi, B.T., & Giveon, U., 2000, ApJ, 533, 631
- King & Pounds (2003) King, A.R., & Pounds, K.A., 2003, MNRAS, in press, astro-ph/0305541
- Kollmeier & Miralda-Escude (2005) Kollmeier, J. & Miralda-Escude, J., 2005, ApJ, 619, 30
- (17) Kormendy, J. & Kennicutt, R. 2004, ARAA, 42, 603
- (18) Lu, Y. & Yu, Q. 1999 astro-ph/9911289
- Mathur (2000) Mathur, S., 2000, MNRAS, 314, L17
- Mathur et al. (2001) Mathur, S., Kuraszkiewicz, J., & Czerny, B., 2001, New Astronomy, Vol. 6, p321
- Mathur & Grupe (2004) Mathur, S. & Grupe, D. 2004, in “Growing Black Holes”, Ed. A. Merloni, S. Nayakshin and R. Sunyaev, Springer-Verlag series of ”ESO Astrophysics Symposia”
- Mathur & Grupe (2005) Mathur, S. & Grupe, D. 2005, A&A, in press.
- McLure & Dunlop (2002) McLure, R.J., & Dunlop, J.S., 2002, MNRAS, 331, 795
- Merloni (2004) Merloni, A. 2004 in “Growing Black Holes”, Ed. A. Merloni, S. Nayakshin and R. Sunyaev, Springer-Verlag series of ”ESO Astrophysics Symposia”
- Merritt & Ferrarese (2001) Merritt, D., & Ferrarese, L., 2001, ApJ, 547, 140
- Nelson (2000) Nelson, C.H., 2000, ApJ, 544, L91
- Nelson & Whittle (1995) Nelson, C.H., & Whittle, M., 1995, ApJS, 99, 67
- Nelson & Whittle (1996) Nelson, C.H., & Whittle, M., 1996, ApJ, 465, 96
- Peterson et al. (2000) Peterson, B.M., McHardy, I.M., Wilkes, B.J., Berlind, P., Bertram, R., et al., 2000, ApJ, 542, 161
- Peterson (1993) Peterson, B.M., 1993, PASP, 105, 247
- Pounds et al. (1995) Pounds, K.A., Done, C., & Osborne, J., 1995, MNRAS, 277, L5
- Rix et al. (1999) Rix, H-W. et al. 1999 astro-ph/9910190
- Shields et al. (2003) Shields, G.A., Gebhardt, K., Salviander, S., Wills, B.J., Xie, B., Brotherton, M.S., Yuan, J., & Dietrich, M., 2003, ApJ, 583, 124
- Tremaine et al. (2003) Tremaine, S., Gebhardt, K., Bender, R., et al., 2003, ApJ, 574, 740
- (35) Whittle, M. 1985, MNRAS, 213, 33
- (36) Whittle, M. 1992, ApJ, 387, 121
- Williams et al. (2002) Williams, R.J., Pogge, R.W., & Mathur, S., 2002, AJ, 124, 3042
- Williams et al. (2004) Williams, R.J., Mathur, S., & Pogge, R.W. 2004, ApJ, 610, 737